Controlling Dzyaloshinskii-Moriya interactions in the skyrmion host candidates FePd1-xPtxMo3N
Abstract
Ferromagnets crystallizing in structures described by chiral cubic space groups, including compounds with the B20 or -Mn structures, are known to host long-period chiral spin textures such as skyrmion lattices. These spin textures are stabilized by a competition between ferromagnetic exchange and antisymmetric Dyzaloshinskii-Moriya (DM) exchange, which is enhanced by the spin-orbit coupling associated with high-atomic-number elements. For real-world application, it is desirable to find materials that can host compact skyrmion lattices at readily accessible temperatures. Here, we report on the crystal chemistry and magnetic phase diagrams of a family of compounds with the filled -Mn structure, FePd1-xPtxMo3N with ranging from 175 K to 240 K. DC and AC magnetization measurements reveal magnetic phase diagrams consistent with the formation of a skyrmion pocket just below . The magnitudes of ferromagnetic and DM exchanges are determined from the phase diagrams, demonstrating that the introduction of increasing amounts of Pt can be used to increase spin-orbit coupling in order to control the expected skyrmion lattice parameter between 140 nm and 65 nm while simultaneously increasing .
I Introduction
Magnetic skyrmions are topologically protected vortex spin textures which act like single particles and may be manipulated as magnetic bits. These quasiparticle spin textures are promising candidates for magnetic racetrack-memory and other low-power, high-density spintronic devices Felser (2013); Fert et al. (2013). Magnetic skyrmions were first observed in B20 compounds (space group ) MnSi Mühlbauer et al. (2009) and Fe0.5Co0.5Si Münzer et al. (2010); Yu et al. (2010). In this structure type, breaking of inversion symmetry generates long-range Dzyaloshinskii-Moriya (DM) exchange driven by spin-orbit coupling Bogdanov and Hubert (1994); Dzyaloshinskii (1958); Moriya (1960). Competition between this antisymmetric exchange and the usual ferromagnetic exchange leads to stabilization of long-period chiral spin structures, including helimagnetic, conical, and skyrmion lattice states.
It is of particular interest to develop new materials that exhibit skyrmions near room temperature with small diameters of the skyrmion vortex. Most known bulk hosts form stable skyrmion lattices only in a small pocket in the temperature and field phase diagram just below the Curie temperature: around 30 K for both MnSi and Fe0.5Co0.5Si Bauer and Pfleiderer (2016a, 2012). In order to stabilize skyrmions at higher temperatures, one must look to chiral magnets with high Curie temperatures (i.e. strong ferromagnetic exchange). In the B20 compound FeGe, which has = 278 K, skyrmions have been observed near room temperature Yu et al. (2011). More recently, skyrmion lattices at temperatures at and above room temperature have been studied in the compounds CoxZnyMnz () with the -manganese crystal structure (space group or ) Tokunaga et al. (2015). As in the B20 compounds, these materials exhibit a stable skyrmion pocket just below , which is tunable between about 150 K and 475 K. Remarkably, by field-cooling through this pocket one may also observe a long-lived metastable skyrmion lattice which exists in a broad range of temperatures and fields Karube et al. (2017, 2018). This phenomenon is believed to be caused by pinning of the skyrmions by the atomic site disorder Münzer et al. (2010); Ritz et al. (2013); Karube et al. (2017, 2018); Bocarsly et al. (2019).
The skyrmion lattice parameter is controlled by a balance between the ferromagnetic exchange, which supports parallel alignment of spins, and the DM exchange, which supports rotation of near-neighbor spins with respect to one-another. The lattice parameter is therefore approximately given by Kataoka (1987a), where is the ferromagnetic exchange stiffness and is the DM exchange density Bogdanov and Hubert (1994); Heide et al. (2009); Rößler et al. (2011). In principle, one may therefore decrease the skyrmion size by introducing heavy atoms into a skyrmion host to increase spin-orbit coupling and increase . This approach has been successful in thin film heterostructures, where adding a layer of a heavy element such as Pt next to a magnetic layer can tune SOC Soumyanarayanan et al. (2017). However, in bulk materials this approach has not been straightforward to implement because chemical substitutions of heavy elements tend to have the dominant effect of weakening ferromagnetic exchange stiffness . This may result in smaller skyrmions, but at the cost of dramatically lowering the temperature at which the skyrmion lattice phase is observed. For example, in Mn1-xIrxSi, the skyrmion lattice parameter decreases by a factor of two for = 0.06, but the decreases by a factor of three Dhital et al. (2017). In Fe1-xMnxGe a composition change of = 0.2 decreases the skyrmion lattice parameter by a factor of four, while decreases by roughly 20 % Shibata et al. (2013).
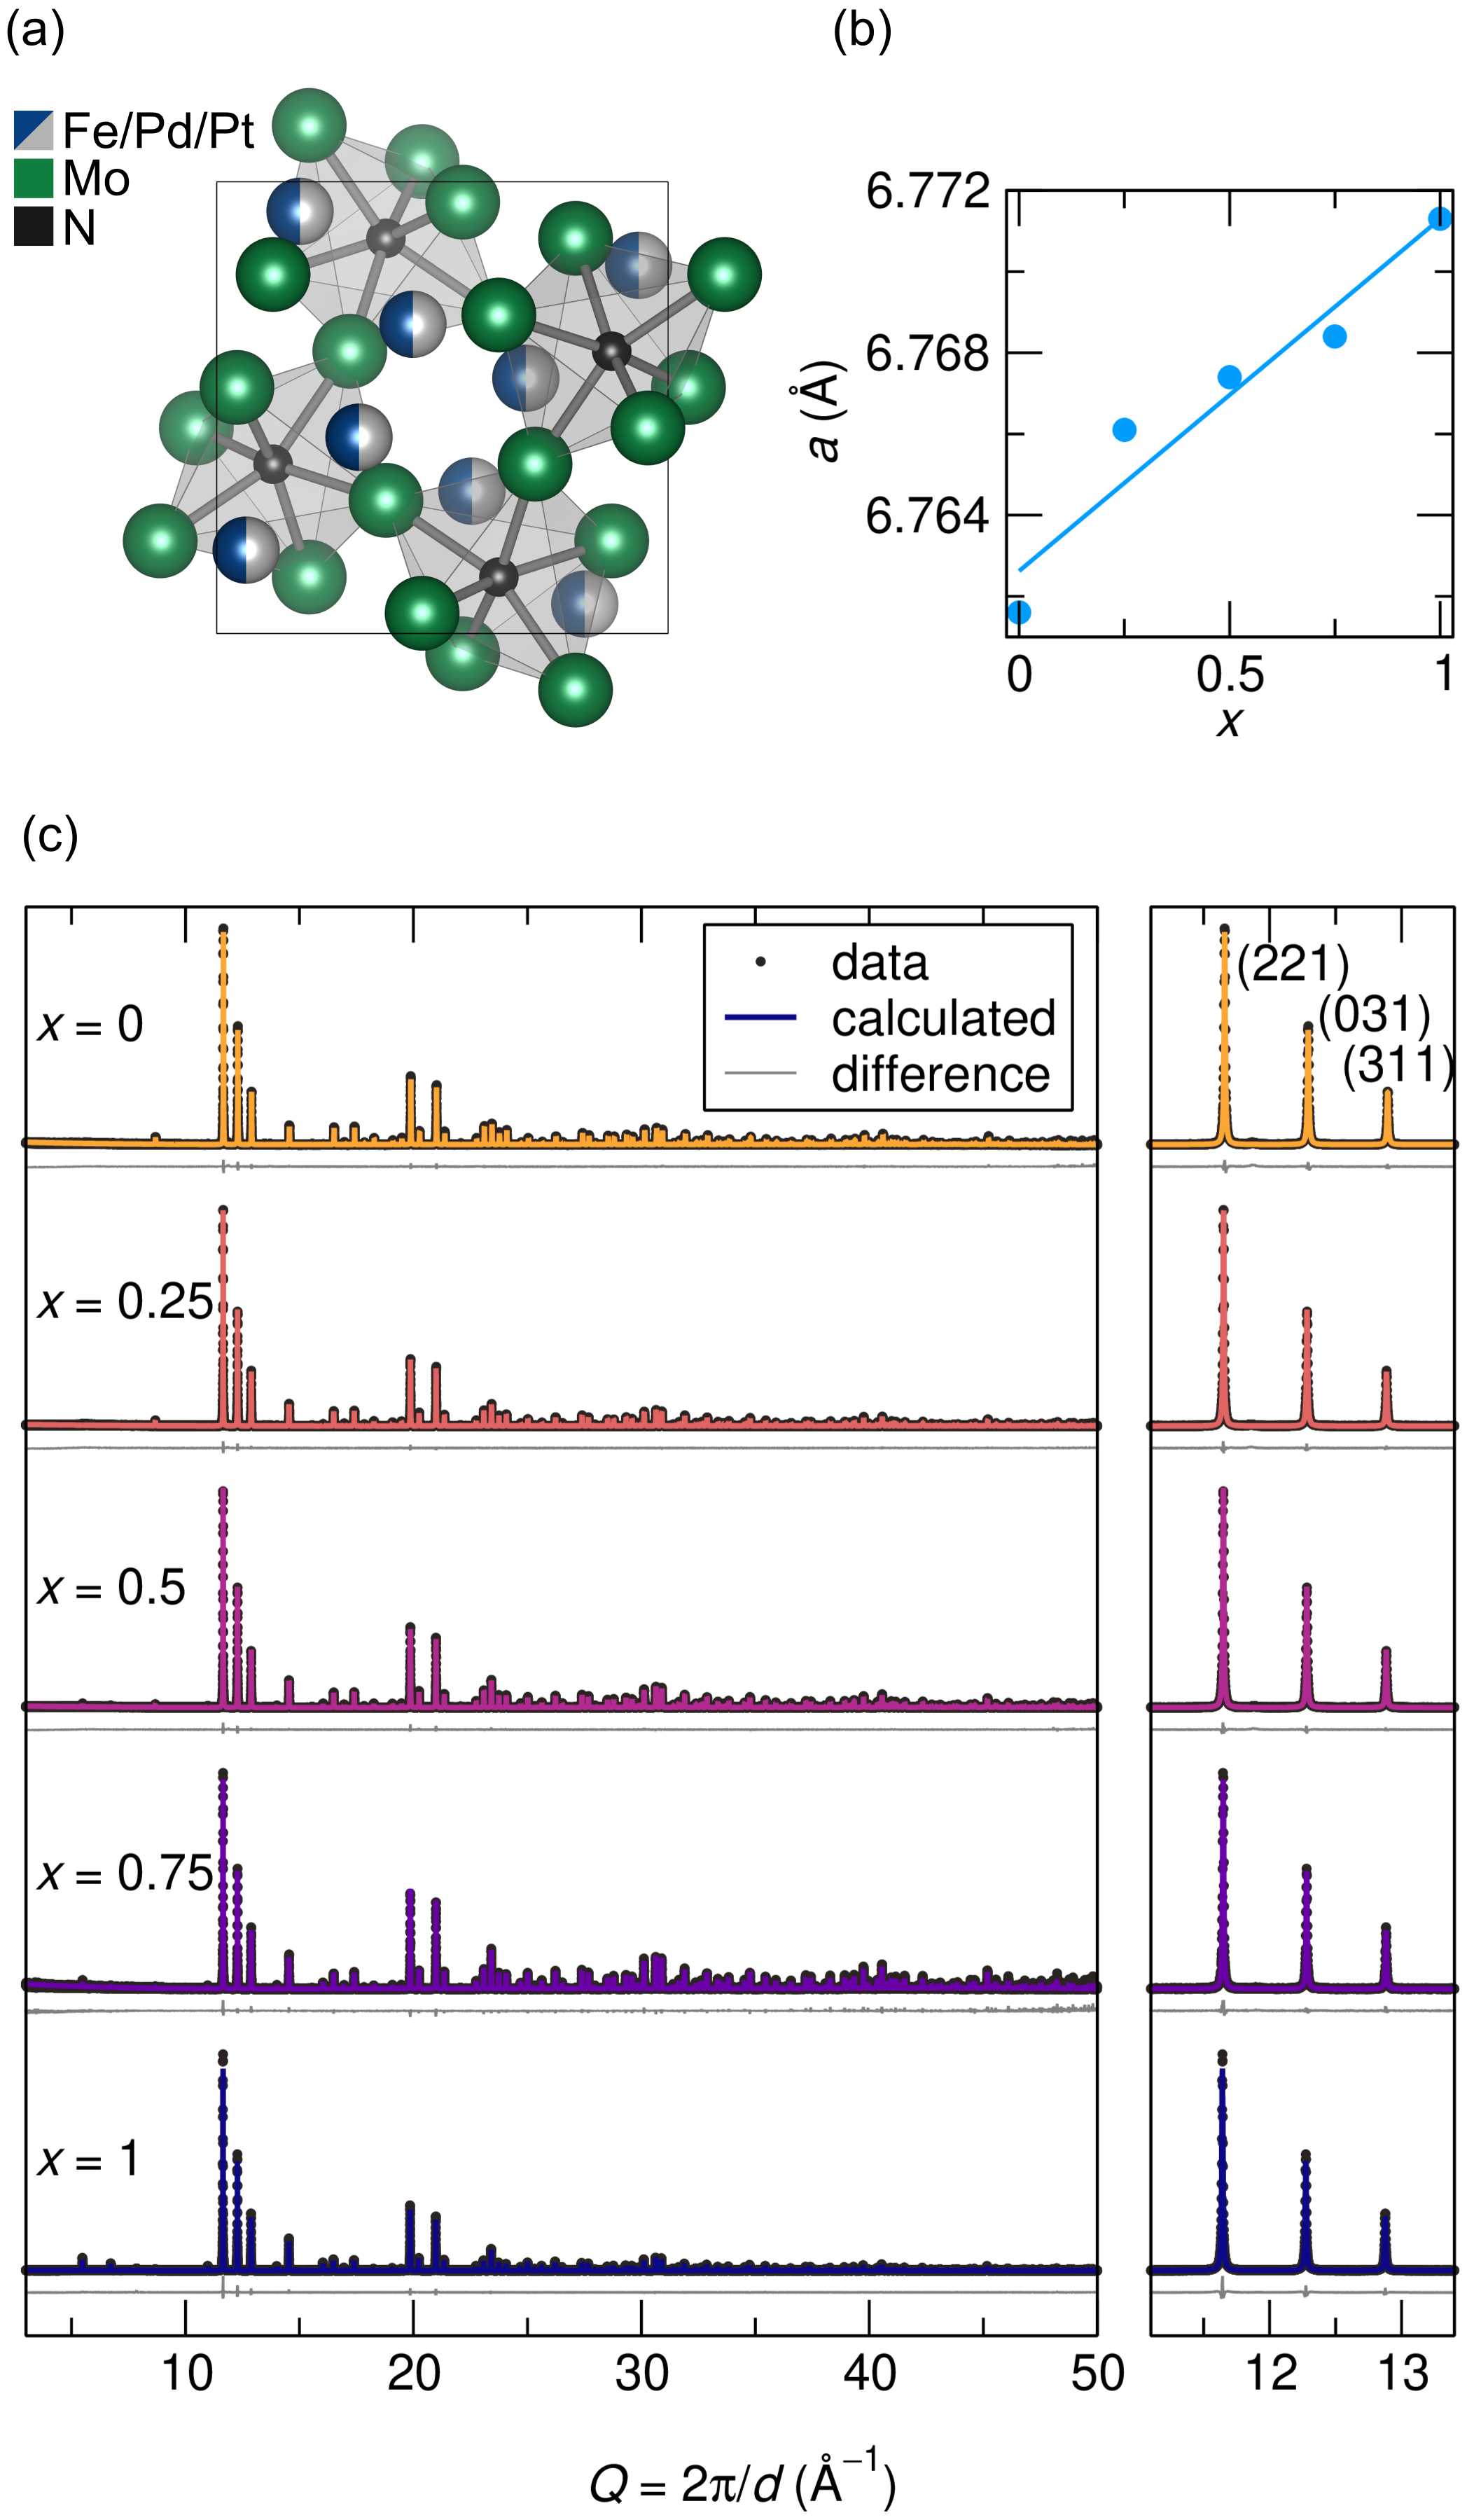
Battle and co-workers Prior and Battle (2003); Prior et al. (2004, 2005); Battle et al. (2007) have reported the formation of ferromagnetic nitrides in the filled--Mn structure, FeMo3N ( = Co, Ni, Rh, Pd, Pt) with Curie temperatures up to 225 K ( = Pt). This structure type, shown in Fig. 1 (a), is simply the -Mn structure type with additional interstitial B, C, or N atoms. As these compounds have the chiral spacegroups of -Mn ( or ) and show ferromagnetic behavior, they are good candidates for skyrmion formation. Indeed, skyrmions in the filled -manganese compound FexCo1.5-xRh0.5Mo3N at temperatures around 100 K have been reported using Lorentz transmission electron microscopy and magnetic measurements Li et al. (2016).
Here, we report the preparation of FePd1-xPtxMo3N as a series with 5 compounds ( = 0, 0.25, 0.5, 0.75, 1) and the characterization of their structural and magnetic properties. Magnetic phase diagrams are determined, revealing an A-phase pocket just below the Curie temperatures, which is expected to host a skyrmion lattice. An analysis of these phase diagrams shows that the introduction of Pt atoms, associated with large spin-orbit coupling, leads to an increase in while leaving largely unchanged. Therefore, this substitution dramatically lowers the expected skyrmion lattice parameter while actually enhancing . This study demonstrates how the introduction of heavy atoms can be used to control chiral magnetism in a bulk material, in a system where such a substitution does not weaken ferromagnetic exchange.
II Methods
II.1 Sample preparation
Polycrystalline samples of FePd1-xPtxMo3N (, 0.25, 0.5, 0.75, 1) were prepared by direct nitridation of the metals Conway and Prior (2019). The appropriate transition metals were intimately ground in stoichiometric mixtures, pelletized and heated under a gas flow of 5% H2 in N2 (flow rate 7 dm3 min.-1) for 36 h at 975 ∘C. The samples were then re-ground and re-pelletized and heated once again at the same conditions for 24 h. In both steps of the process, the furnaces were purged with the reaction gas prior to heating and the samples were cooled down to room temperature under gas flow. Samples with a total mass of 500 mg were prepared. Reagents employed: Fe (Sigma-Aldrich) 99.9%, Pd (Sigma-Aldrich) 99.9%, Pt (Alfa Aesar) 99.95%, Mo (Sigma-Aldrich) 99.9%. This thermal treatment procedure gave well-crystalized phase-pure samples according to laboratory X-ray diffraction, but in order to further improve on the sample crystallinity and density, the samples were again re-ground and re-pelletized and annealed in amorphous silica tubes filled with 1 atm N2 for 48 h. In order to contain this pressure and temperature of N2 gas safely, thick-walled silica tubes were chosen (outer diameter: 15.8 mm, wall thickness: 2.8 mm, length: 7 cm). The samples were annealed at the following temperatures: at 1000∘C, at 1050∘C, at 1100∘C, at 1150∘C and at 1200∘C. These annealing temperatures were chosen to be about 50 ∘C below the decomposition temperature of each sample, as determined by Differential Scanning Calorimetry.
II.2 Characterization
The progress after each step of the synthesis was verified by X-ray powder diffraction using a Panalytical Empyrean powder diffractometer operating with Cu-Kα radiation in Bragg-Brentano geometry. Differential scanning calorimetry was performed using a Netzsch DSC 404 C Pegasus Thermal analyzer equipped with a high temperature furnace (up to 1500 ∘C). Samples with a mass of about 20 mg were measured in \ceAl2O3 crucibles in flowing \ceN2 gas. After successful preparation, high-resolution synchrotron powder diffraction data was collected for all samples in the series at beamline 11-BM at the Advanced Photon Source (APS), Argonne National Laboratory, using an average wavelength of 0.457838 Å. The patterns were collected at a temperature of 295 K. Elemental analysis was performed on powder samples on Kapton tape using a Rigaku ZSX Primus IV X-ray fluorescence (XRF) spectrometer.
Rietveld refinement of the crystal structures was carried out using TOPAS academic. The synchrotron patterns were fit with a Stephens strain model Stephens (1999) (two parameters), and a standard Gaussian size broadening term (one parameter). A fixed axial divergence asymmetry correction based on the instrument geometry was used to handle diffractometer peak asymmetry. Absorption of the X-rays by the capillary samples was corrected for according to the chemical compositions and capillary diameter (0.8 mm) by refining the packing density of the samples to values between 30% and 40%. Unit cell parameters, atom positions as well as the elemental compositions were refined, assuming the atomic sites were each fully occupied. For the samples containing both Pd and Pt, the compositions were additionally restricted to stoichiometries consistent with the nominal Pd/Pt ratio, e.g. for : and . Isotropic displacement parameters () were refined for the two metal-filled sites in the unit cell. The value for the nitrogen-filled 4 site was fixed to a refined overall .
DC and AC magnetic measurements between 2 K and 400 K were obtained on a Quantum Design MPMS3 SQUID magnetometer. Pieces with masses less than 1 mg were measured in polypropylene capsules. First, DC magnetization as a function of temperature between 2 K and 400 K was collected under a constant field of 0.02 T while sweeping temperature at a rate of 7 K min-1. Five-branch hysteresis loops between 7 T and T were then collected at 2 K at a rate of 10 mT s-1. Detailed magnetic phase diagrams for the , 0.5, and 1 samples were constructed using DC magnetization and AC susceptibility measurements as a function of field at closely spaced temperatures near the magnetic transition. The AC susceptibility measurements were performed every 2 K at temperatures below the Curie transition using excitation frequencies of 10 Hz and amplitudes of 0.5 mT. The susceptibility was measured every 0.7 mT between 0 and 25 mT and every 5 mT between 25 mT and 100 mT. The DC magnetization was measured every 1 K while sweeping at a rate of 0.2 mT s-1 between 0 and 100 mT, and collecting a data point every 1 second. The field derivatives of the AC and DC measurements were calculated using Tikhonov regularization Stickel (2010).
Additionally, the magnetoentropic behavior of \ceFePtMo3N was characterized using the technique described in Ref. Bocarsly et al., 2018. DC magnetization versus temperature sweeps at closely spaced fields were performed around the magnetic transition temperature of \ceFePtMo3N to obtain magnetocaloric information. The sweeps were performed between 210 K and 240 K at a rate of 4 K min-1 with a spacing of 2 mT between 2 and 30 mT and a spacing of 5 mT between 30 mT and 80 mT. The temperature derivatives of these sweeps were then calculated using Tikhonov regularization as well to give information about how the entropy changes with applied field at any given temperature and field, according to the Maxwell relation:
| (1) |
where , , , and are the magnetization, temperature, entropy, and field, respectively. This quantity can then be integrated with respect to field, to give the isothermal magnetic entropy change , which is the entropy difference between the sample at a magnetic field and at zero field:
| (2) |
III Results and discussion
III.1 Crystal structure
| 0 | 0.25 | 0.5 | 0.75 | 1 | |
|---|---|---|---|---|---|
| (Å) | 6.762 | 6.766 | 6.767 | 6.768 | 6.771 |
| 8 | 0.0654 | 0.0656 | 0.0654 | 0.0653 | 0.0650 |
| 8 | 0.91(2) | 0.76(2) | 0.68(1) | 0.60(2) | 0.90(1) |
| 12 | 0.2046 | 0.2045 | 0.2043 | 0.2042 | 0.2041 |
| 12 | 0.79(1) | 0.68(1) | 0.63(1) | 0.47(2) | 0.77(7) |
| 0.500(8) | 0.500(5) | 0.503(3) | 0.501(5) | 0.491(2) | |
| 0.500(8) | 0.375(3) | 0.248(1) | 0.125(1) | – | |
| – | 0.125(1) | 0.248(1) | 0.374(4) | 0.509(2) | |
| 21.02 | 18.95 | 16.56 | 29.04 | 15.93 | |
| 17.04 | 16.13 | 13.36 | 30.41 | 10.79 |
Rietveld refinements of synchrotron powder diffraction patterns for the compounds in the series FePd1-xPtxMo3N are shown in Fig. 1(c). The reported -Mn structure () Conway and Prior (2019) fits the obtained diffraction patterns very well. Sharp diffraction peaks are observed, and no peaks violating this model or suggesting the presence of secondary phases are observed. The 8 site is occupied by a combination of Fe, Pd, and Pt. Mo fully occupies the 12 site, forming distorted corner-sharing Mo6N octahedra with the interstitial nitrogen atoms on the 4 site, as shown in Fig. 1(a). The lattice parameter of the unit cell is found to increase with rising Pt content Fig. 1(b). The refined compositions are in good agreement with the results from the XRF measurements (Tab. S1). Details of the refinements are presented in table 1.
Differential scanning calorimetry (DSC) was employed to characterize the thermal stability of the compounds after the two gas nitridation steps. Upon heating under 1 atm. of \ceN2 gas all samples show an endothermal signal somewhere between 1100∘C ( = 0) and 1250∘C ( = 1) (Fig. S1), which corresponds to decomposition of the samples via loss of nitrogen. Upon subsequent cooling, the nitrogen is not reabsorbed, and the resulting sample is found to be a mix of metal binaries. When heating in Ar, the decomposition temperatures were found to be roughly 100 K lower, and so the annealing step for the sample preparation was performed under nitrogen pressure, using temperatures chosen to be about about 50 K below the observed decomposition temperature of each sample. This annealing step is found to substantially improve sample crystallinity, as evidenced by narrow diffraction peak widths and the sharpness of the magnetic transitions. Because the = 1 sample has the highest decomposition temperature, it could be annealed at the highest temperature and consequently has the clearest magnetic features.
III.2 Magnetic properties
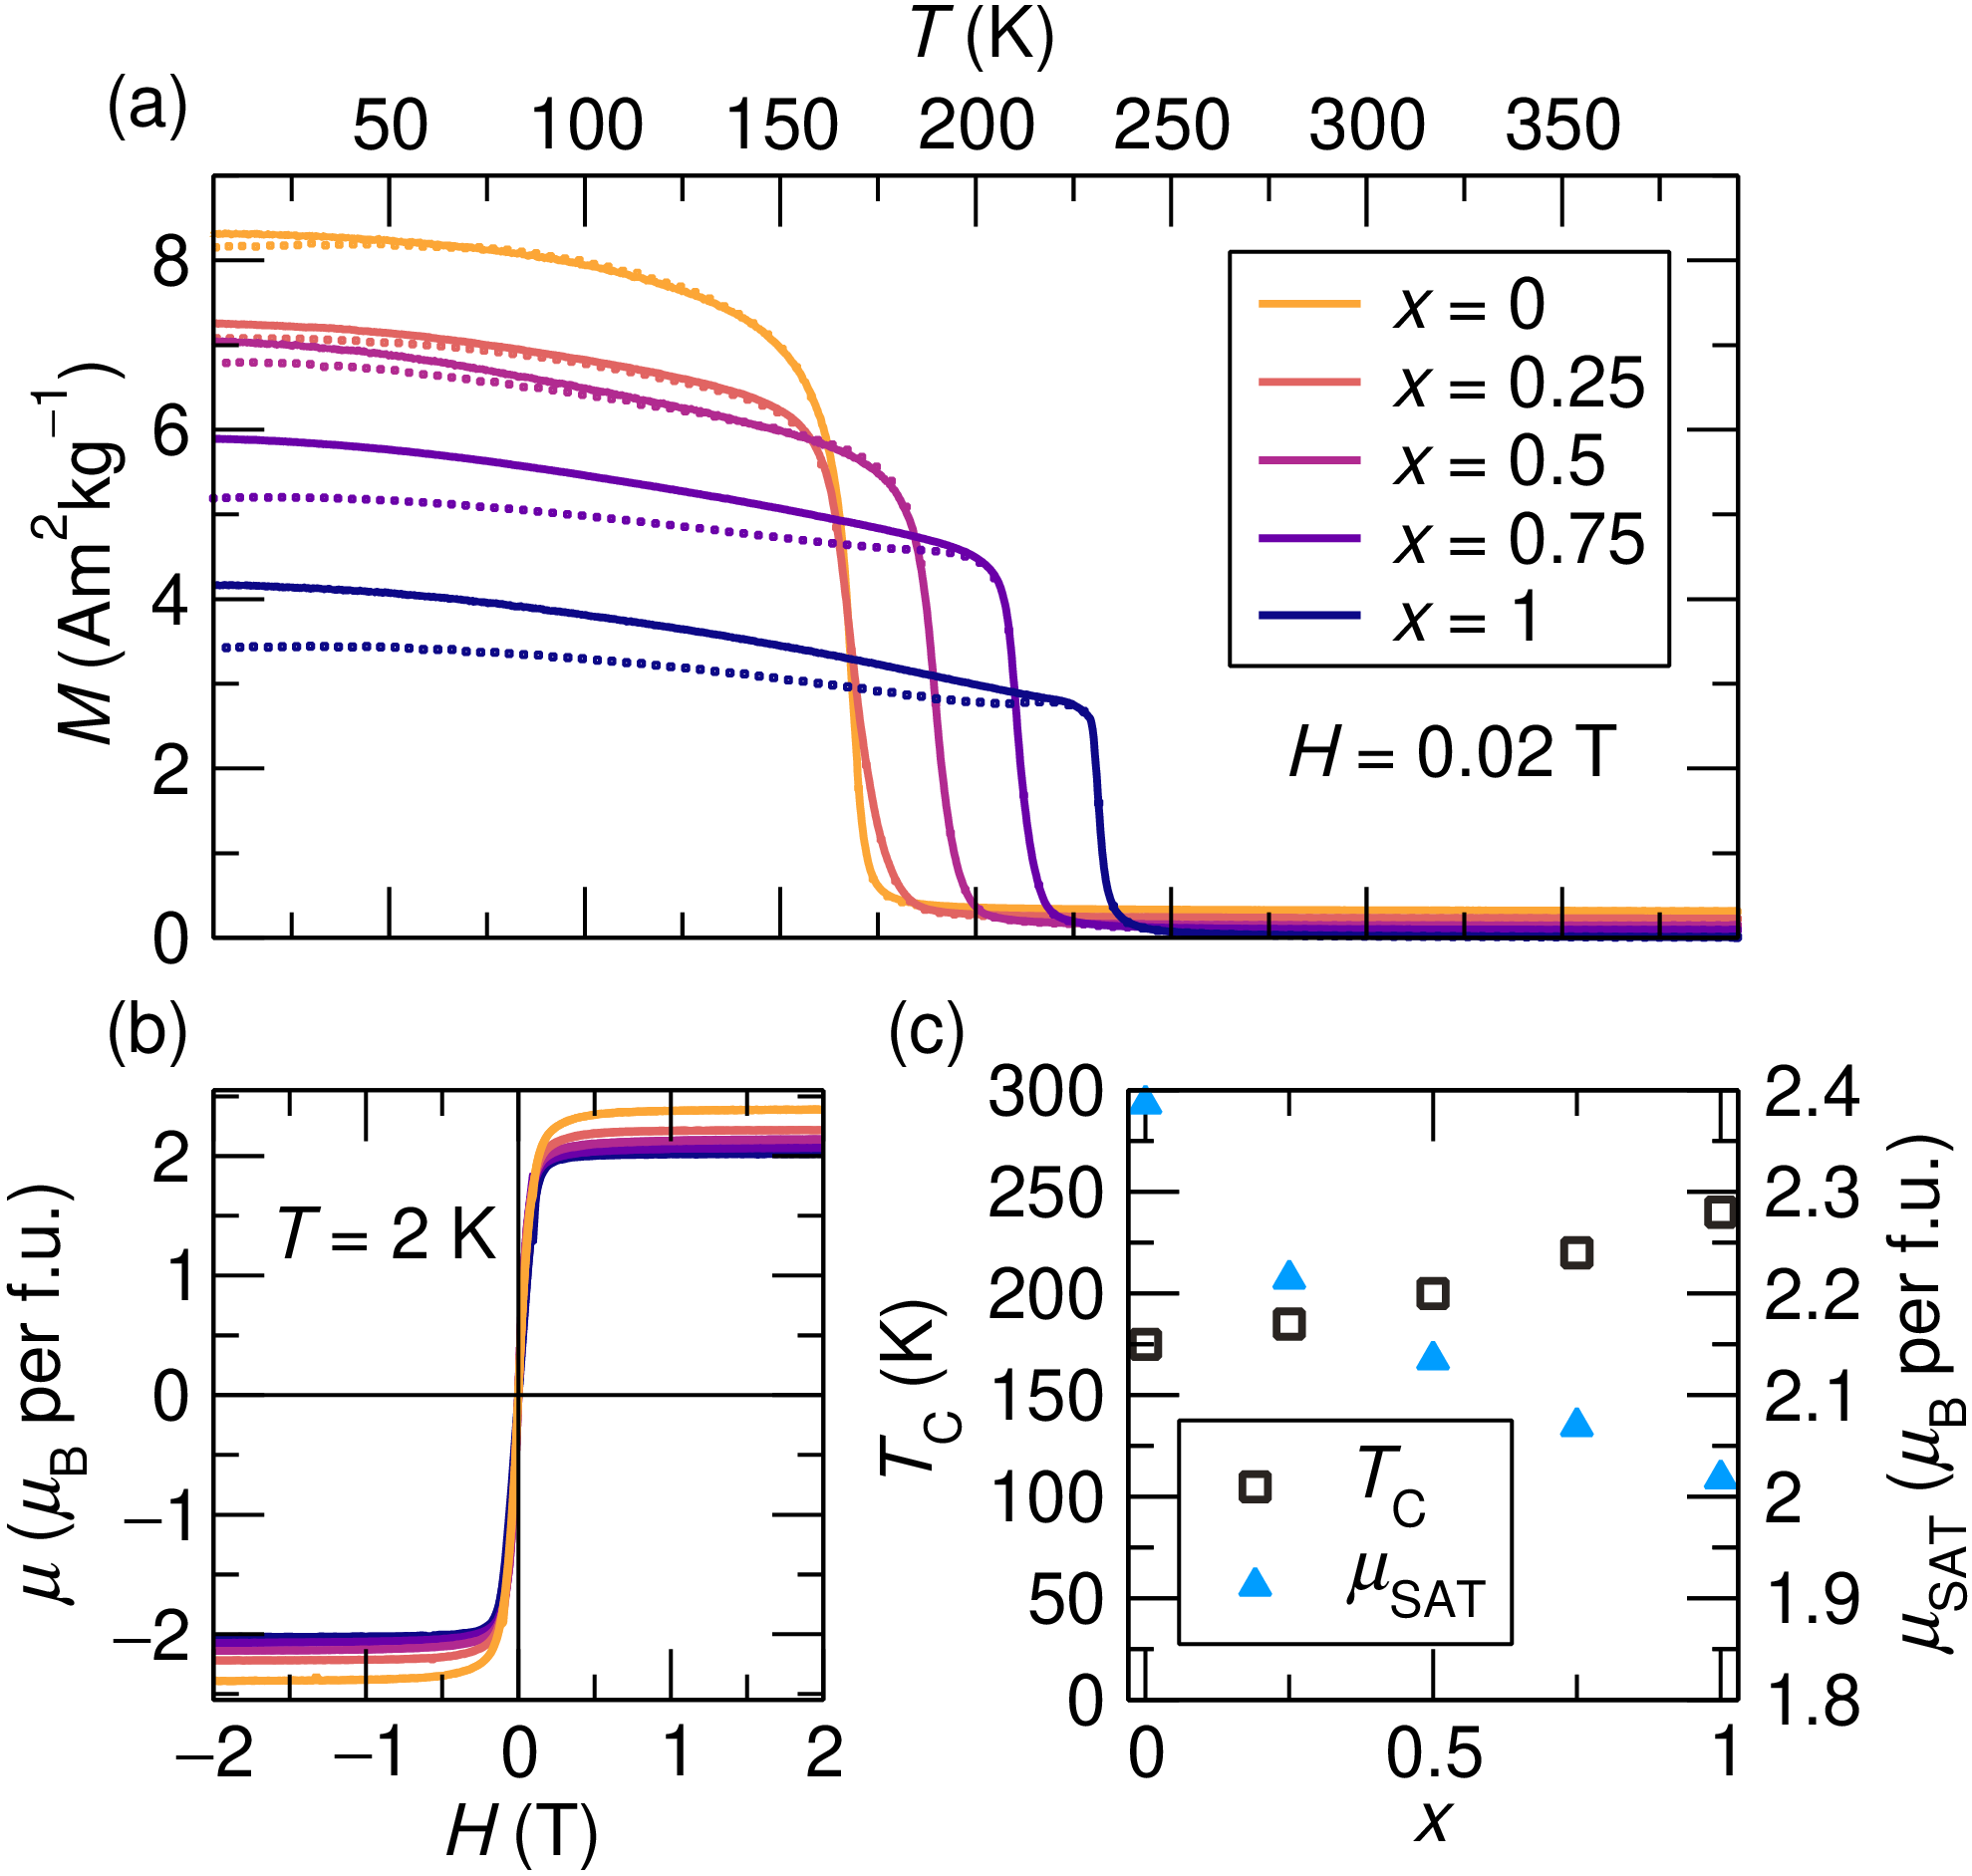
All compounds of the series show soft ferromagnetic behavior and a saturated magnetic moment between 2.0 and 2.4 per Fe atom at = 2 K [Fig. 2 (b), Table 2]. The magnetization saturates at approximately = 0.4 T. This behavior is consistent with other reports on this materials class Prior et al. (2004, 2005). The zero field cooled warming and the field cooled warming curves in Fig. 2 (a) display a small amount of irreversibility below the Curie temperature, with the splitting between field-cooled and zero-field cooled curves increases with increasing Pt content. However, this irreversibility is too small to cause a visible hysteresis around the origin in the hysteresis loops. The sharpness of the Curie transitions supports that the samples are of high quality. was determined from the onset of the Curie transition.
| (K) | (/Fe) | |
|---|---|---|
| 0 | 175 | 2.39 |
| 0.25 | 185 | 2.21 |
| 0.5 | 200 | 2.14 |
| 0.75 | 220 | 2.07 |
| 1 | 240 | 2.02 |
III.3 Magnetic phase diagrams
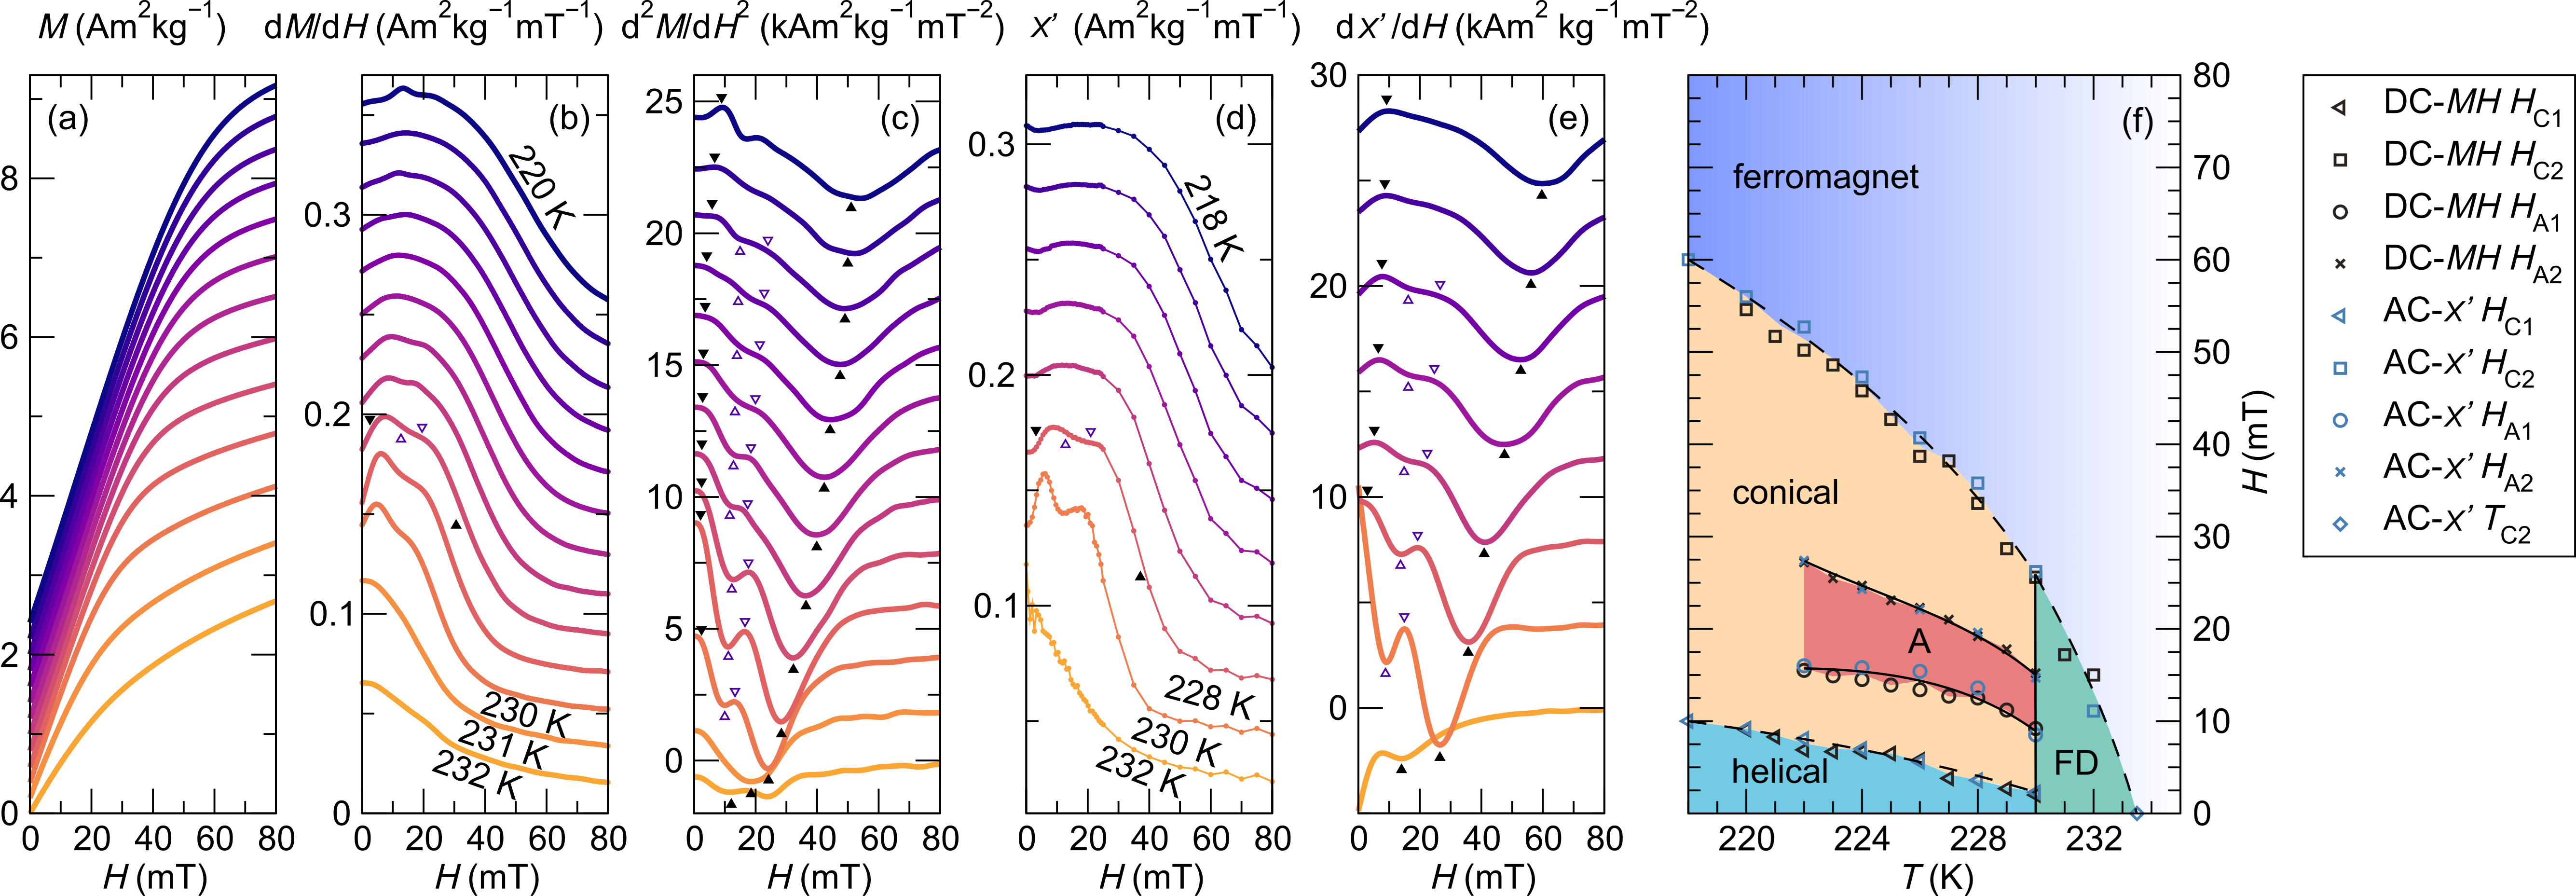
Magnetic phase diagrams for the = 0, 0.5, and 1 samples were constructed on the basis of DC magnetization and AC susceptibility measurements as a function of field, collected at several temperatures near the Curie temperature. This process is shown in detail for \ceFePtMo3N ( = 1) in Fig. 3. Thirteen DC curves and eight AC curves are shown. The AC susceptibility measurements are collected using a relatively low excitation frequency of 10 Hz, and therefore should correspond approximately to the field derivative of the DC magnetization data . Therefore, the DC and AC data are expected to provide the same information, although measurement and data analysis details may lead to minor differences. In practice, we find that the AC measurements serve as a high-sensitivity complement to the high-density data derived from DC magnetization.
Just below = 230 K, a characteristic double-bump feature may be seen in both AC [Fig. 3 (d)] and in calculated from the DC magnetization data [Fig. 3 (b)]. This feature is characteristic of the phase evolution seen just below in chiral cubic magnets Bauer and Pfleiderer (2016b, 2012); Adams et al. (2012); Tokunaga et al. (2015); Li et al. (2016); Bocarsly et al. (2018), from a helical state at zero field (low susceptibility) to a canted conical state (high susceptibility), to a skyrmion lattice (low susceptibility), back to the canted conical state (high susceptibility) and finally to a field-polarized state (low susceptibility). The phase boundaries between these phases are found at the inflection points, which may conveniently be identified as local maxima and minima in the field derivative of the susceptibility, i.e. AC [Fig. 3 (e)] or DC [Fig. 3 (c)]. Below about 222 K, the transitions in and out of the skyrmion lattice phase (called and in Fig. 3 (c,e)) disappear, but the transitions from helical to conical () and conical to field-polarized () remain. Above = 230 K, only is observed.
When these features are plotted on temperature and field axes, a magnetic phase diagram that is consistent with the phase diagram of other chiral cubic skyrmion host materials is obtained [Fig. 3 (f)]. This generically observed diagram features a helical ground state that transforms into a canted conical phase and eventually a field-polarized ferromagnetic phase upon application of field. Just below the Curie temperature, an “-phase” pocket, which is expected to host a skyrmion lattice structure, is found. In \ceFePtMo3N, this pocket is found between 10 mT and 20 mT and 222 K and 230 K. At 230 K, a Brazovskii transition is found, which involves a line of first-order transitions from the ordered chiral phases to a short-range ordered “fluctuation-disordered” phase Janoschek et al. (2013); Brazovskii (1975); Bauer and Pfleiderer (2016a) that persists to 233.5 K. The data points determining the phase boundaries from DC and AC magnetic measurements are in good agreement.
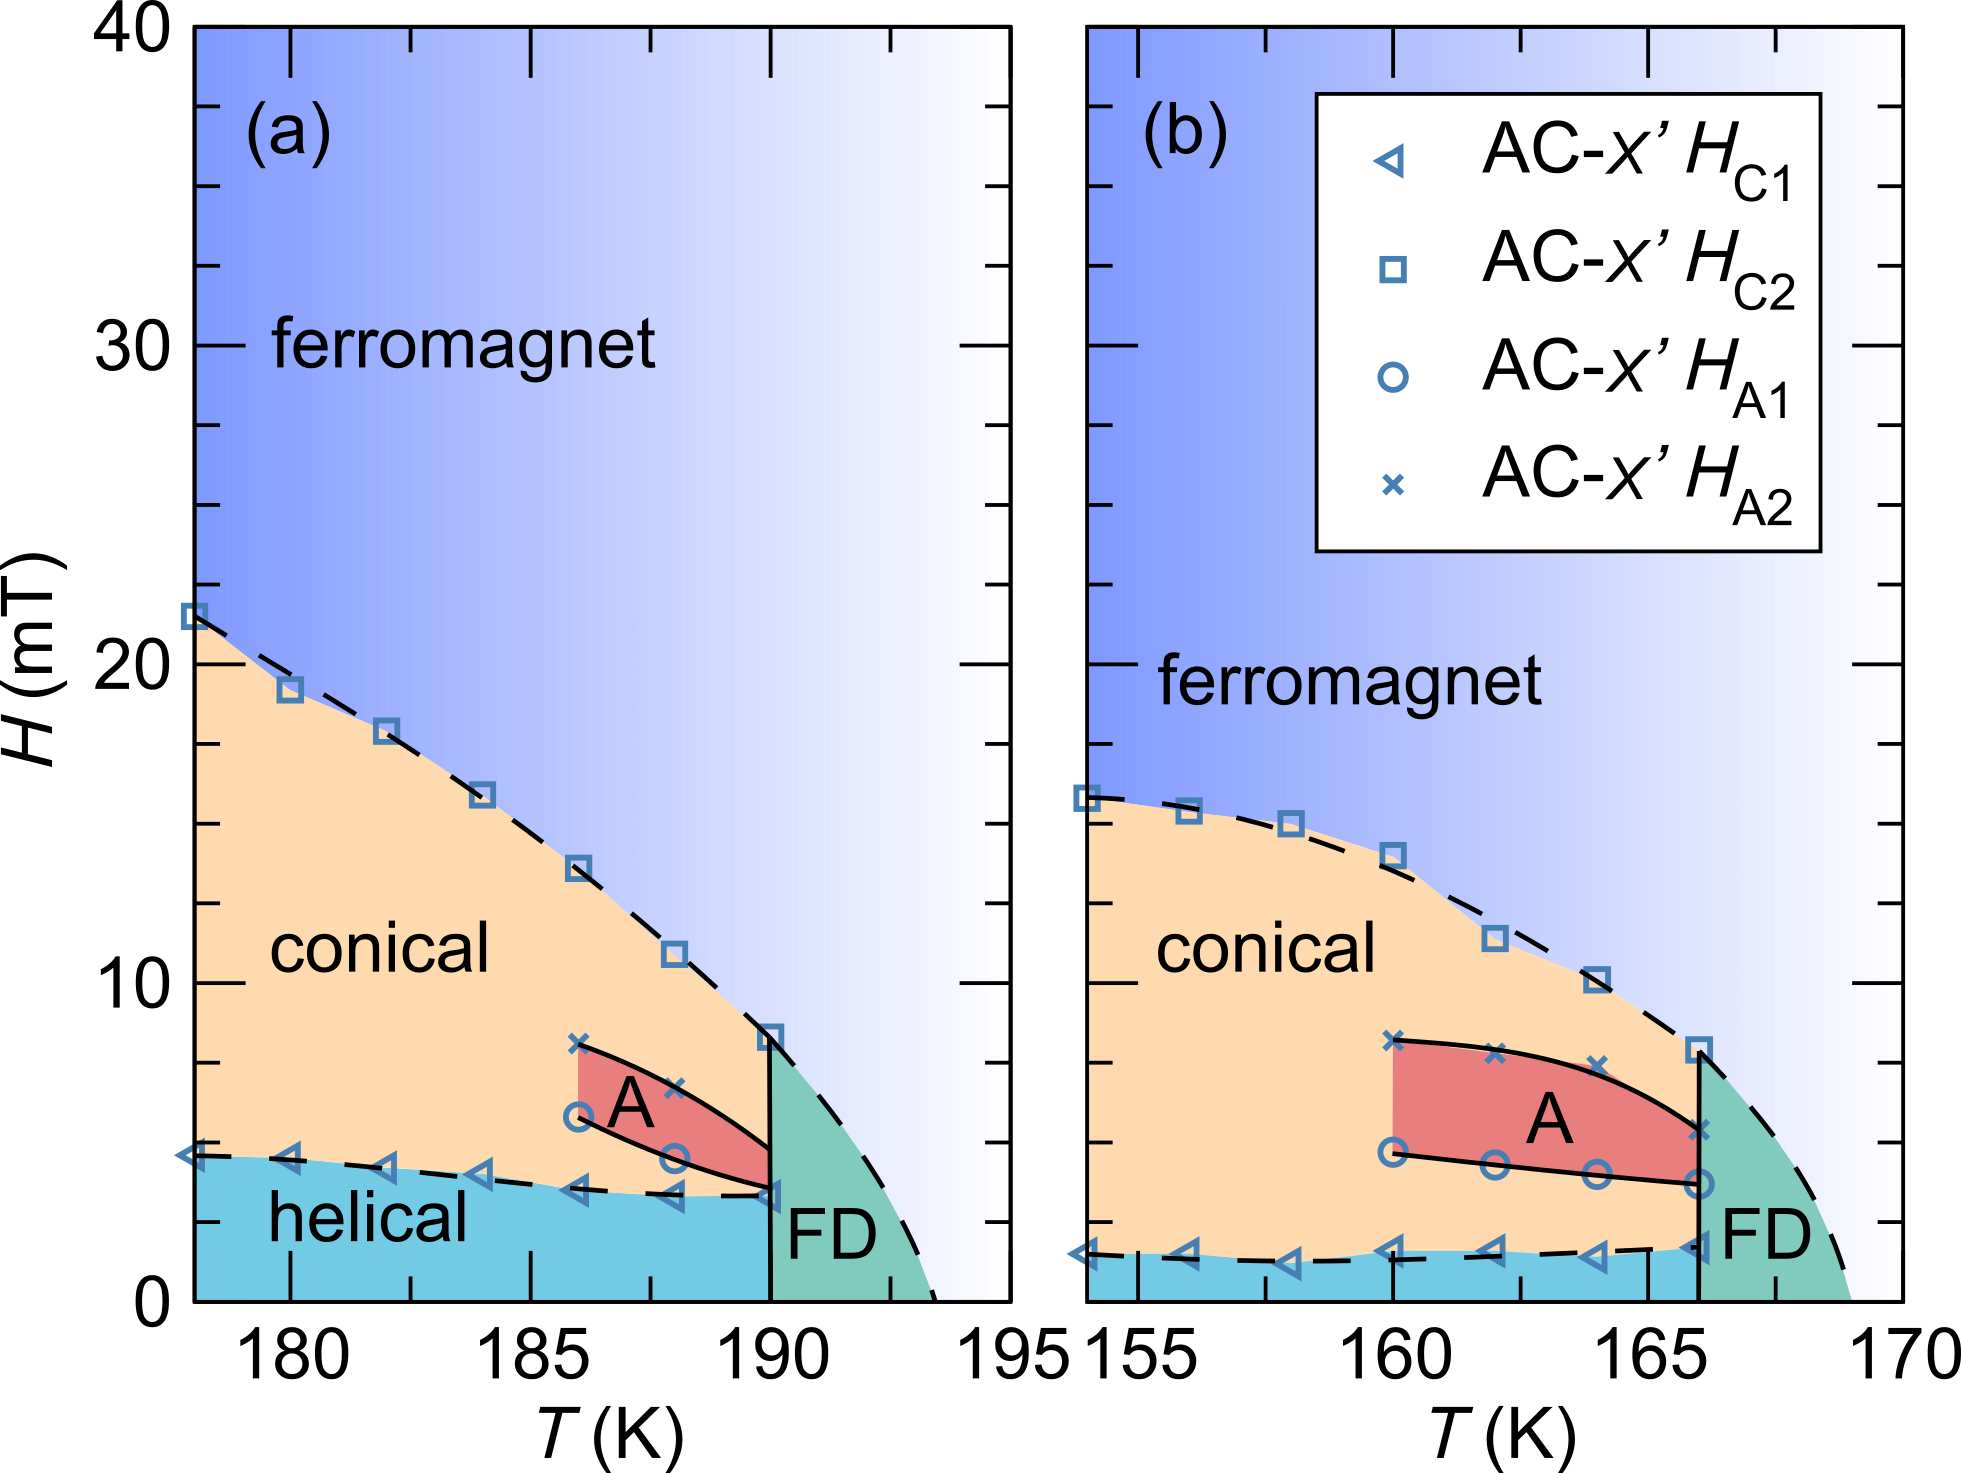
Magnetic phase diagrams constructed from AC susceptibility measurements of the compounds with and can be found in Fig. 4. Both compounds exhibit signatures similar to FePtMo3N. Skyrmion lattice pockets (A) are observed below the fluctuation disordered state (FD) starting at 190 K () and 166 K (). The lower temperatures for the A regions correspond to the lower Curie transition temperatures of the compounds. Additionally, the A regions emerge at lower magnetic fields.
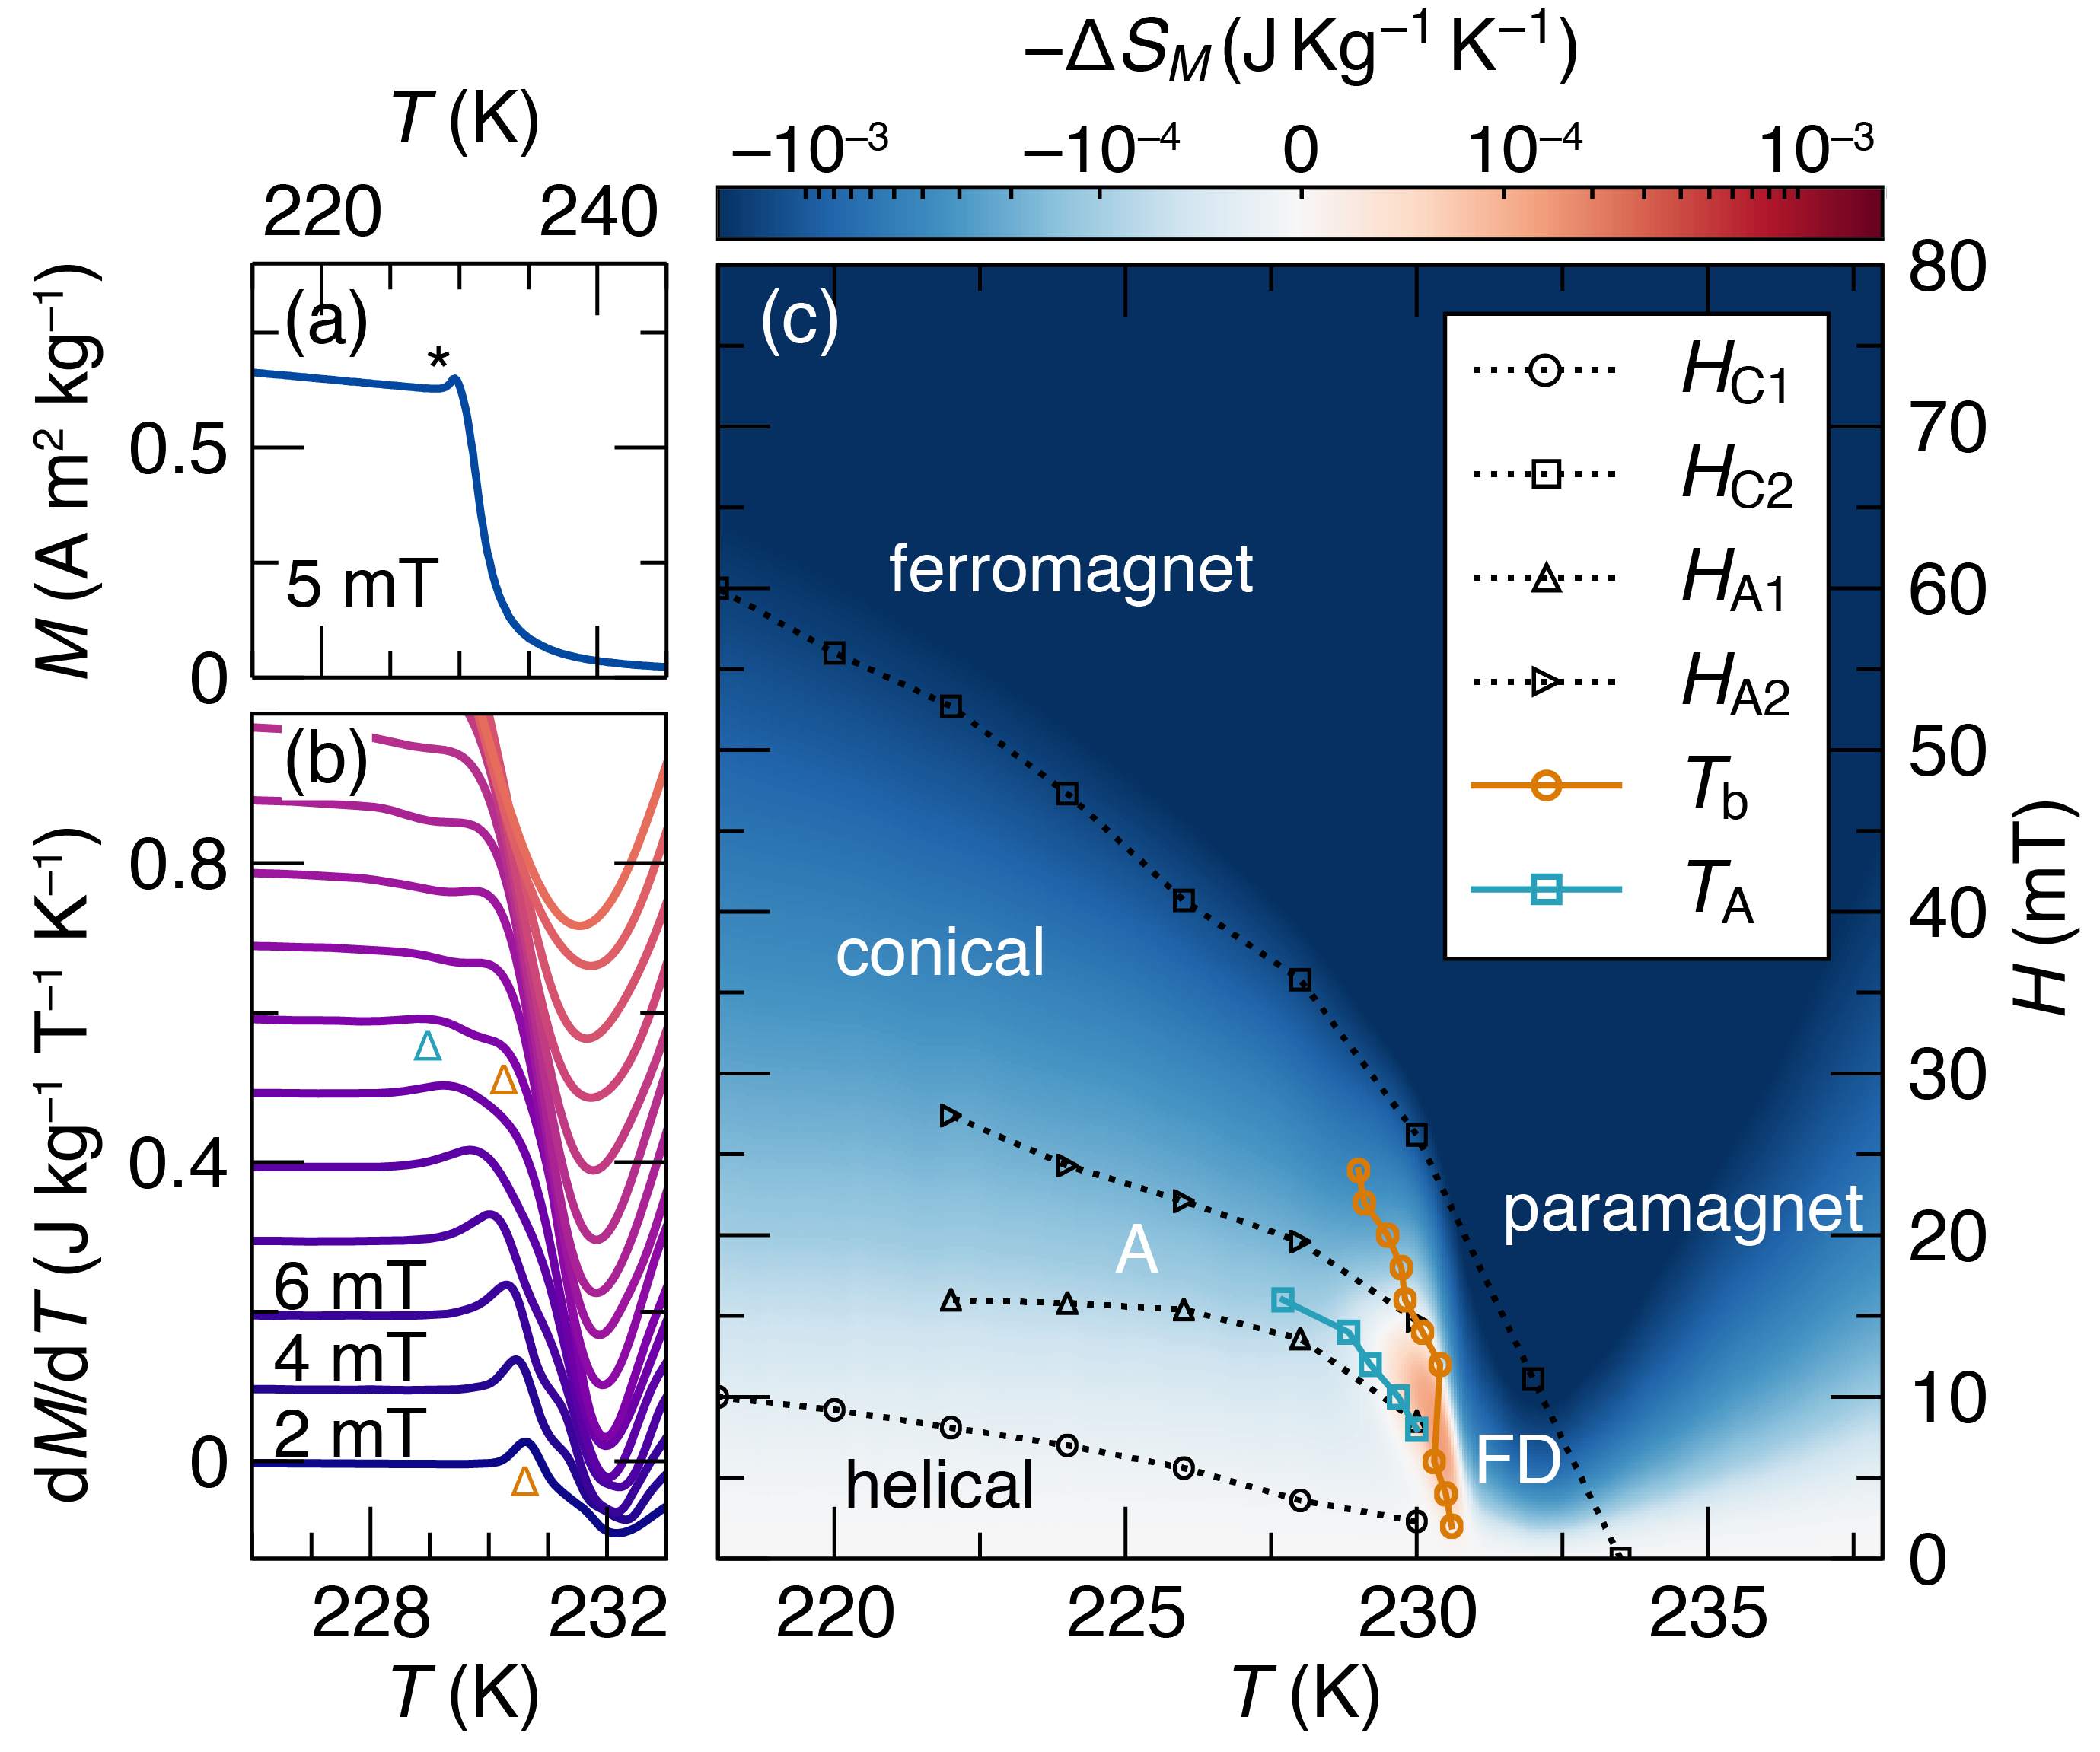
Another way of looking at the magnetic phase diagram of magnetic skyrmion host is on the basis of magnetoentropic mapping, as was previously used to reveal bulk entropy changes associated with magnetic phase transitions in the chiral cubic skyrmion host FeGe Bocarsly et al. (2018). Using the fact that the temperature derivative of magnetization is equal to the field derivative of entropy (Eq. 1), magnetization vs. temperature measurements collected at many fields are used to create a map of the entropic response to field of the sample (Fig. 5). In measurements of \ceFePtMo3N in low magnetic fields (e.g. 5 mT), a characteristic cusp right below the Curie transition is apparent, shown with an asterisk in Fig. 5 (a). When the derivative of this curve is taken, the cusp becomes a region of positive [Fig. 5 (b)]– i.e. application of a magnetic field increases the entropy of the system. In a skyrmion host material, this counterintuitive phenomenon occurs both at the field-driven conical to skyrmion lattice transition () and at the Brazovskii transition, where field drives the transformation from ordered phases to the fluctuation-disordered phase. For most other cases, application of a magnetic field decreases entropy by suppressing spin fluctuations. By tracking the positions of maxima in , phase boundaries of these phase transitions can be determined.
Figure 5 (c) shows shows a map of the isothermal magnetic entropy changes of \ceFePtMo3N, overlaid with the phase diagram determined using AC susceptibility. is the integral with field of [Eq. 2]. In this map, red regions indicate increased entropy relative to the zero-field state, and blue indicates decreased entropy. The orange and teal points ( and ) represent the maxima in , and generally agree with the position of the Brazovskii transition and the transition from the conical state to the A phase determined using AC susceptibility, although the feature associated with is very subtle and is not resolvable below 227 K. We attribute this weak signal to the polycrystalline nature of the samples: because this technique measures the bulk entropic response of the sample, grain boundaries and defects that do not host the ordered skyrmion lattice phase will weaken the observed bulk entropy signal and contribute a net negative signal as applied field decreases the spin disorder at these features. For comparison, the magnitude of the positive magnetoentropic signals seen here is about 5 times less than were observed in single crystals of FeGe Bocarsly et al. (2018), but is comparable to that seen in a polycrystalline sample of the skyrmion host \ceCo8Zn9Mn3 Bocarsly et al. (2019). Despite this weakened signal, close to a pocket of increased entropy (the red area in the map) is resolvable, indicating the formation of a phase with higher entropy than the helical ground state. This increased bulk entropy signal is consistent with the formation of a bulk skyrmion lattice phase in the A phase region.
III.4 Effect of spin-orbit coupling on magnetic exchange and Dzyaloshinskii-Moriya interaction
While the phase diagrams for the x = 0, 0.5, and 1 are qualitatively the same, the details of the temperatures and fields are expected to be controlled primarily by the ferromagnetic exchange stiffness () and Dzyaloshinskii-Moriya interaction densities (). Furthermore, the helimagnetic wavelength and skyrmion lattice parameter are expected to be related to these constants according to . Here, we use the determined magnetic phase diagrams to obtain estimates for and (and therefore skyrmion lattice parameter) as a function of Pt content .
First, the observed Curie temperature is used to obtain . A Monte-Carlo investigation of the phase diagram of the Heisenberg model for a cubic chiral magnet Buhrandt and Fritz (2013) has determined that the observed magnetic transition temperature (specifically, the temperature of the Brazovskii transition) is:
| (3) |
Where is an effective exchange energy (units of eV) and is the Boltzmann constant. In a cubic system, this exchange energy can be converted to an exchange density (units of eV nm-1) using:
| (4) |
where is the lattice parameter and coordination number (3 for the 8c site in the present structure) Chikazumi (1997). is the spin value of the magnetic lattice, which in this case we take to be the average spin value of an atom on the 8c lattice, which is half occupied by magnetic Fe and half by nonmagnetic Pd/Pt). This value is determined using the 2 K saturated magnetization.
The field at which the conical phase saturates to a ferromagnetic state () can then be used to determine . If one ignores magnetocrystalline anisotropy, which is believed to be small due to the low helical to conical transition fields observed, is expected to occur at:
| (5) |
where , , and are the volume of the formula unit cell, the gyromagnetic ratio, the reduced Planck constant and the vacuum permeability, respectively Kataoka (1987b); Wilson et al. (2014). is the spin density at a given temperature. In this picture, the temperature-dependence of the ordered magnetic moment drives the temperature-dependence of . This spin density is obtained from the spontaneous ordered magnetic moment, according to:
| (6) |
at each temperature is deducted from the Arrot-Belov plot (Fig. S2) Belov and Goryaga (1956); Arrot (1957); Kuz’min et al. (2010). For each sample, six sweeps with a spacing of 2 K were performed below the Curie temperature. Linear fits to the data with values of / above 0.05 T kg A-1m-2 were used to determine the values from the intercepts. The parameter was obtained by Eq. 5 using six values each for and below the Brazovskii transition. Table 3 shows , , , and the helical wavelength for the compounds of the series. We note that the approximations made during this analysis, such as the conversion factor between and and neglecting the anisotropy terms may lead to errors in the obtained and parameters. In particular, neglecting anisotropy may cause a slight overestimation of and therefore a small underestimation in . However, we do not expect that the overall trends, especially with regard to expected helical wavelength will change. In addition, the calculated values for are consistent with those observed for iron cobalt rhodium molybdenum nitride Li et al. (2016).
| (10-21 J) | (10-12 J m-1) | (10-4 J m-2) | (nm) | ||
|---|---|---|---|---|---|
| 0 | 2.25 | 0.60 | 3.56 | 1.42 | 157 |
| 0.25 | 2.37 | 0.55 | 3.21 | 1.68 | 120 |
| 0.5 | 2.57 | 0.54 | 3.26 | 1.88 | 109 |
| 0.75 | 2.82 | 0.52 | 3.35 | 2.20 | 96 |
| 1 | 3.08 | 0.51 | 3.48 | 3.35 | 65 |
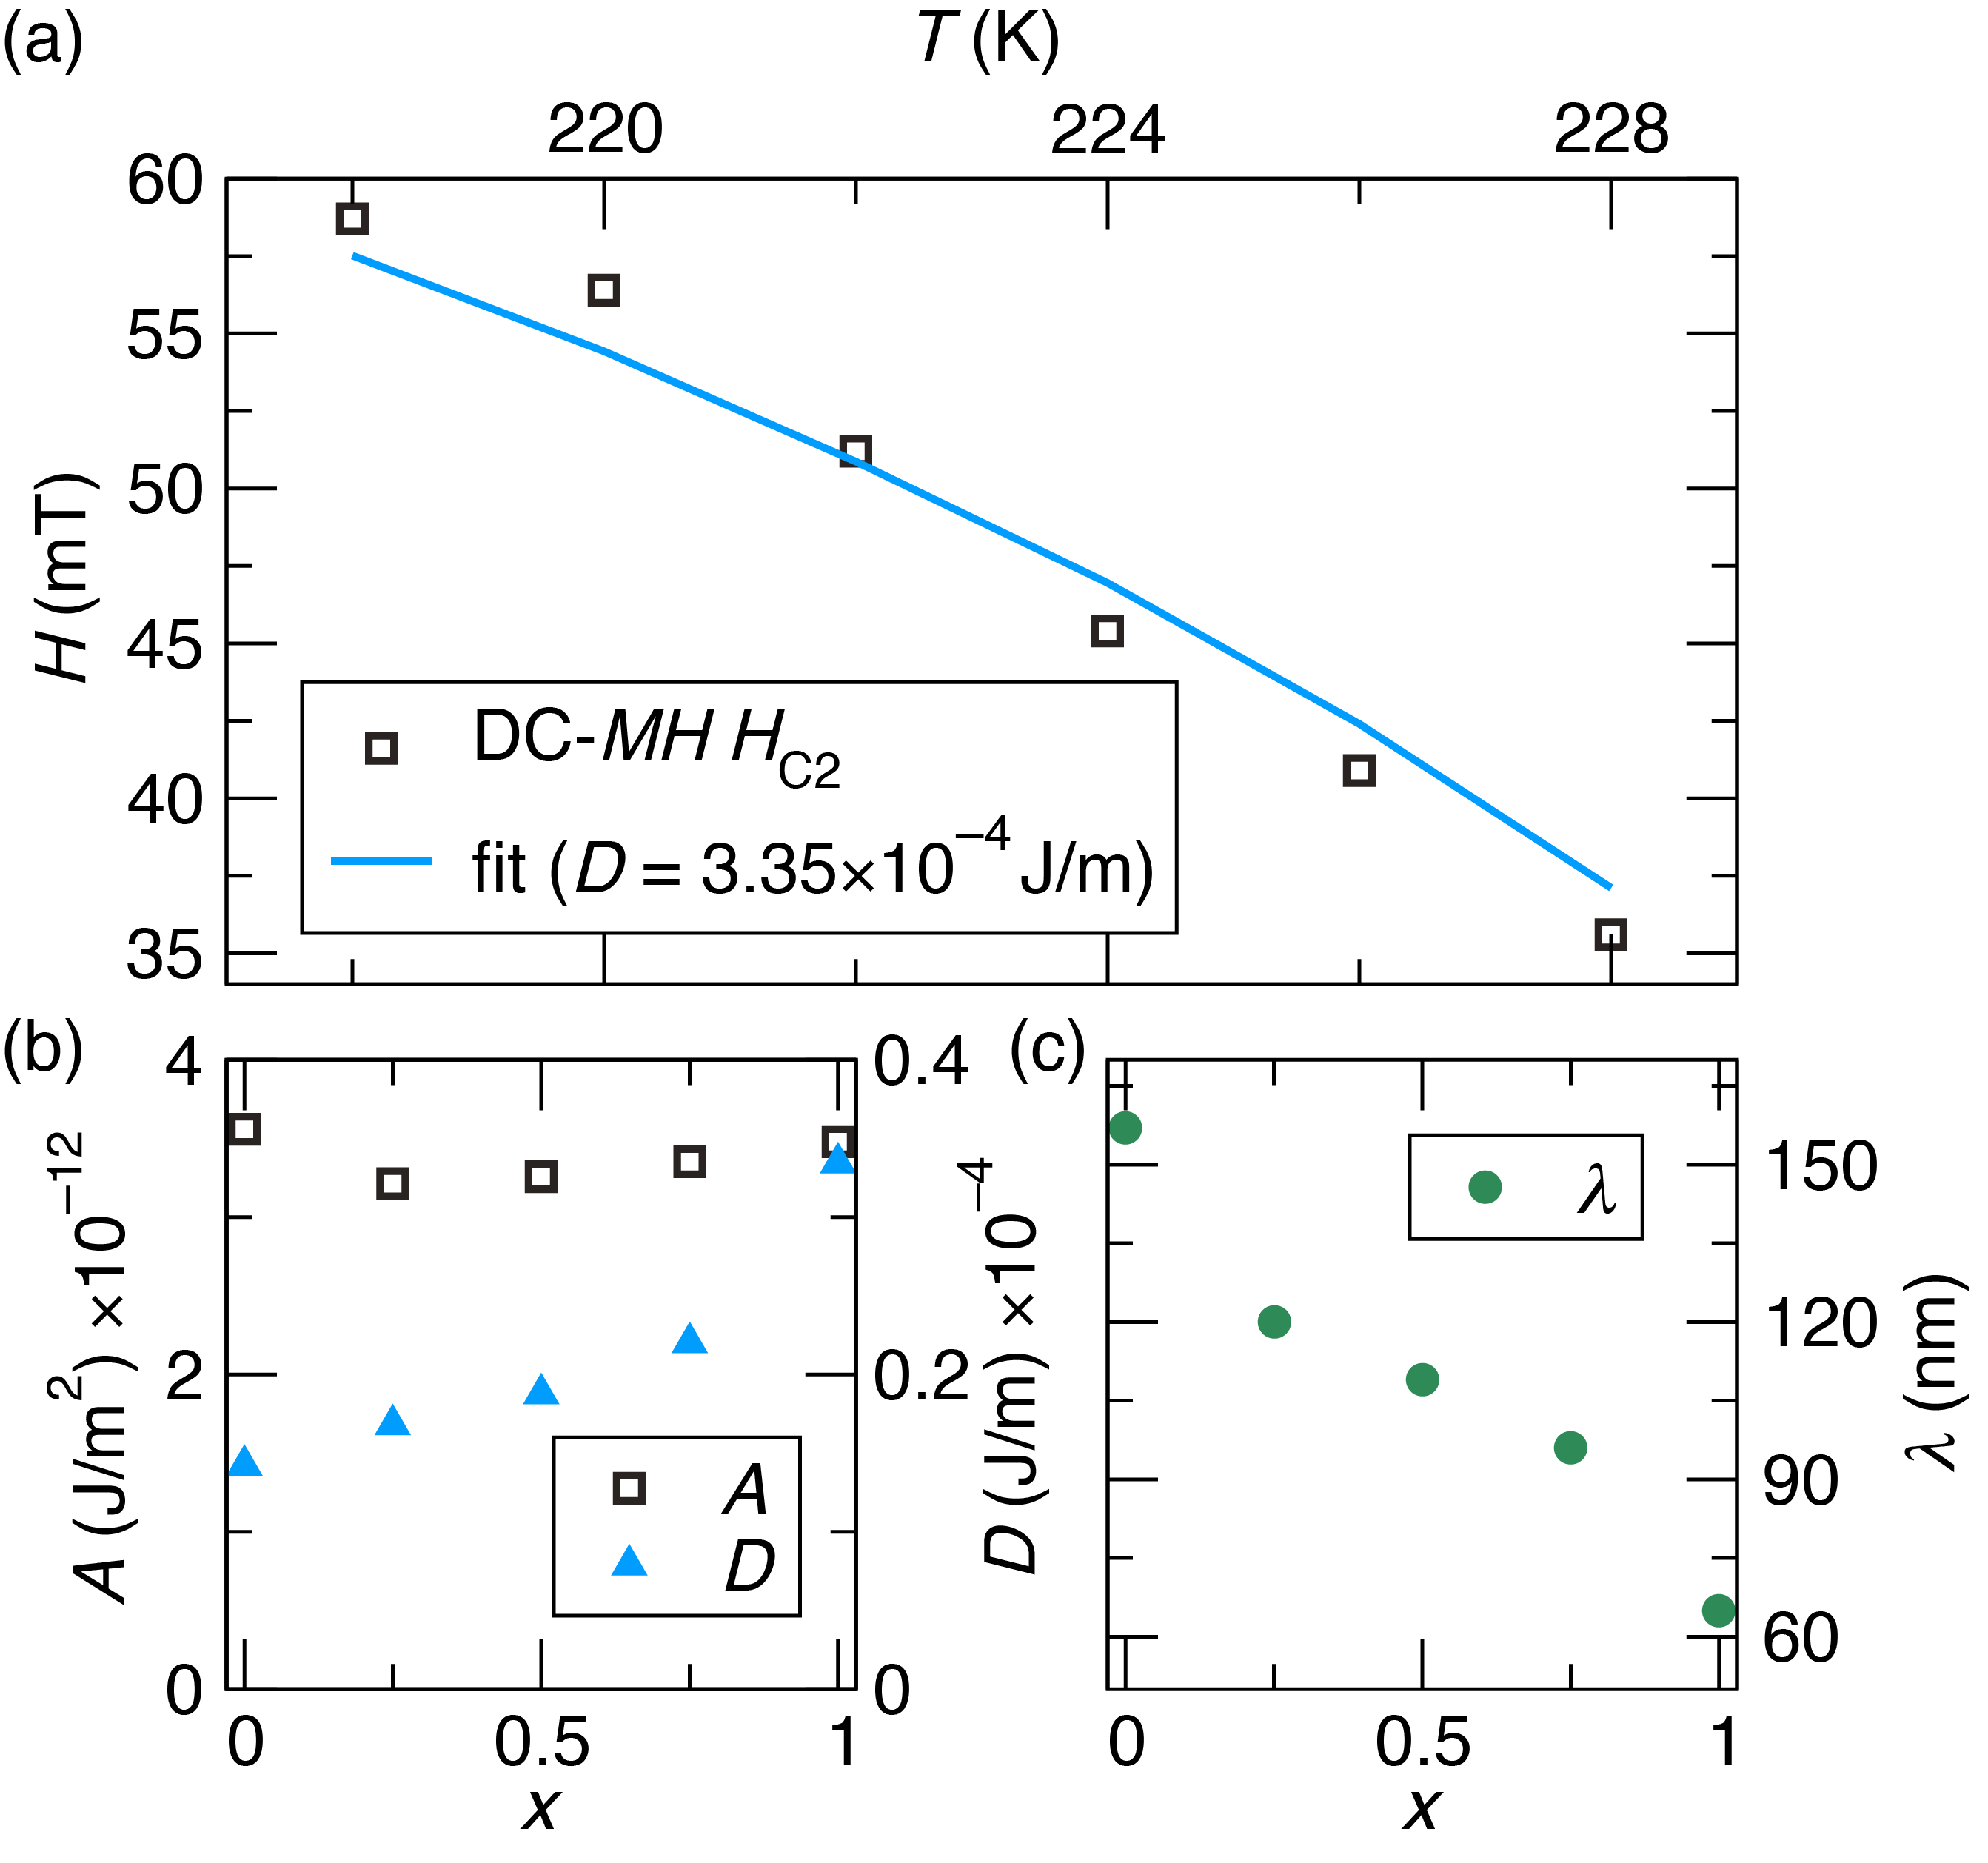
Fig. 6 (b) shows the change of and with the variation of the composition . The exchange stiffness generally increases slightly with increasing , which corresponds to the increasing Curie temperatures. The value for the sample differs from the trend of the series due to the higher value. Overall, only changes by about 10 % across the series. On the other hand, the parameter is found to increase dramatically with rising , increasing by 235 % across the series. Therefore, we conclude that the introduction of heavy Pt atoms enhances the strength of spin-orbit coupling and therefore DM interaction. This increase is also visible in Fig. 2 (a), where the larger DM interactions lead to bigger saturation fields and therefore to a smaller susceptibility in the low field magnetic measurements for the compounds with higher Pt content. As a result of the increasing DM interaction strength, the helical period length [Fig. 6 (c)] and the skyrmion lattice parameter are expected to decrease from 157 nm for = 0 to 65 nm for = 1. The increase in spin-orbit coupling also causes the fields needed to stabilize the skyrmions to increase from about 50 mT for = 0 to about 150 mT for = 1. The proposed skyrmion lattice phases in the polycrystalline nitride samples are with their expected lattice parameters ranging between 50 nm and 150 nm suitable for direct observation using small-angle neutron scattering Gilbert et al. (2019) or Lorentz transmission electron microscopy Li et al. (2016).
The expected wavelengths for the compounds in the series FePd1-xPtxMo3N are comparable to that observed in the near-room-temperature skyrmion host FeGe ( = 278 K, = 70 nm) Yu et al. (2011). On the other hand, much smaller skyrmions have been observed in MnSi (18 nm) Mühlbauer et al. (2009); however, this small skyrmion size can be largely attributed to the small ferromagnetic exchange constant, as evidenced by the low = 29 K. On the other hand, CoxZnyMnz, which can show a stable skyrmion lattice between at high-temperature (150 K to 475 K, depending on composition), shows larger skyrmion lattice parameters of between 115 nm and 190 nm Tokunaga et al. (2015). In the room-temperature antiskyrmion host Mn1.4PtSn, the lattice parameter ranges from about 150 nm to 350 nm depending on temperature and field Nayak et al. (2017). A unique feature in our nitrides is that the skyrmion size can be decreased while simultaneously increasing the Curie temperature. The skyrmion size is reduced by more than 50% going from \ceFePdMo3N to \ceFePtMo3N, while the Curie temperature is simultaneously increased by 65 K. In the compounds CoxZnyMnz (), the change in composition from Co9Zn9Mn2 to Co8Zn8Mn4 decreases the helical period length from 155 nm to 125 nm but also decreases from 425 K to 310 K. Similar behavior can be seen in the skyrmion hosts Mn1-xIrxSi and Fe1-xMnxGe, where the decrease of also leads to significant reduction in Dhital et al. (2017); Shibata et al. (2013).
IV Conclusion
We have shown that FePd1-xPtxMo3N compounds in the filled -Mn crystal structure are promising bulk skyrmion host candidates. High-purity polycrystalline samples with different Pd/Pt ratios can be made in a simple gas nitridation procedure, followed by an annealing step under pressurized nitrogen. DC magnetization and AC susceptibility measurements reveal that these compounds exhibit magnetic phase diagrams consistent with those of other chiral cubic skyrmion hosts. In FePtMo3N, an A phase below 230 K with a width of 8 K and a height of 10 mT is seen. The magnetic phase diagrams of these compounds are used to determine the ferromagnetic exchange stiffness and Dzyaloshinskii-Moriya interaction density for each of the compounds. This analysis indicates that increases with increasing Pt content, and, consequently, the skyrmion lattice parameter is predicted to be tunable between 157 nm ( = 0) and 65 nm for ( = 1). This study demonstrates that the introduction of heavy elements into a skyrmion host can be used to control and achieve small skyrmions; however, for this strategy to be effective the substitution must be performed in such a way as to not weaken the ferromagnetic exchange.
Acknowledgements.
This work was supported by Materials Research Science and Engineering Center (MRSEC) program of the National Science Foundation through DMR-1720256 (IRG-1). Use of the Advanced Photon Source at Argonne National Laboratory was supported by the U. S. Department of Energy, Office of Science, Office of Basic Energy Sciences, under Contract No. DE-AC02-06CH11357. J.D.B. is supported by the NSF Graduate Research Fellowship Program under grant no. 1650114.References
- Felser (2013) C. Felser, Angew. Chem. Int. Ed. 52, 1631 (2013).
- Fert et al. (2013) A. Fert, V. Cros, and J. Sampiano, Nat. Nanotechnol. 8, 152 (2013).
- Mühlbauer et al. (2009) S. Mühlbauer, B. Binz, F. Jonietz, C. Pfleiderer, A. Rosch, A. Neubauer, R. Georgi, and P. Böni, Science 323, 915 (2009).
- Münzer et al. (2010) W. Münzer, A. Neubauer, T. Adams, S. Mühlbauer, C. Franz, F. Jonietz, R. Georgii, P. Böni, B. Pederson, M. Schmidt, A. Rosch, and C. Pfleiderer, Phys. Rev. B 81, 041203(R) (2010).
- Yu et al. (2010) X. Z. Yu, Y. Onose, N. Kanazawa, J. H. Park, J. H. Han, Y. Matsui, N. Nagaosa, and Y. Tokura, Nature 465, 901 (2010).
- Bogdanov and Hubert (1994) A. Bogdanov and A. Hubert, J. Magn. Magn. Mater. 138, 255 (1994).
- Dzyaloshinskii (1958) I. Dzyaloshinskii, J. Phys. Chem. Solids 4, 241 (1958).
- Moriya (1960) T. Moriya, Phys. Rev. 120, 91 (1960).
- Bauer and Pfleiderer (2016a) A. Bauer and C. Pfleiderer, Topological Structures in Ferroic Materials, edited by J. Seidel, Springer Series in Materials Science 228, 1 (2016a).
- Bauer and Pfleiderer (2012) A. Bauer and C. Pfleiderer, Phys. Rev. B 85, 214418 (2012).
- Yu et al. (2011) X. Z. Yu, N. Kanazawa, Y. Onose, K. Kimoto, W. Z. Zhang, S. Ishiwata, Y. Matsui, and Y. Tokura, Nat. Mater. 10, 106 (2011).
- Tokunaga et al. (2015) Y. Tokunaga, X. Z. Zu, J. S. White, H. M. Rønnow, D. Morikawa, Y. Taguchi, and Y. Tokura, Nat. Commun. 6, 7638 (2015).
- Karube et al. (2017) K. Karube, J. S. White, D. Morikawa, M. Bartkowiak, A. Kikkawa, Y. Tokunaga, T. Arima, H. M. Rønnow, Y. Tokura, and Y. Taguchi, Phys. Rev. Mater. 1, 074405 (2017).
- Karube et al. (2018) K. Karube, J. S. White, D. Morikawa, C. D. Dewhurst, R. Cubitt, A. Kikkawa, X. Yu, Y. Tokunaga, T. Arima, H. M. Rønnow, Y. Tokura, and Y. Taguchi, Sci. Adv. 4, 7043 (2018).
- Ritz et al. (2013) R. Ritz, M. Halder, C. Franz, A. Bauer, M. Wagner, R. Bamler, A. Rosch, and C. Pfleiderer, Phys. Rev. B 87, 134424 (2013).
- Bocarsly et al. (2019) J. D. Bocarsly, C. Heikes, C. M. Brown, S. D. Wilson, and R. Seshadri, Phys. Rev. Mater. 3, 014402 (2019).
- Kataoka (1987a) M. Kataoka, J. Phys. Soc. Jpn. 56, 3635 (1987a).
- Heide et al. (2009) M. Heide, G. Bihlmayer, and S. Blügel, Physica B 404, 2678 (2009).
- Rößler et al. (2011) U. K. Rößler, A. A. Leonov, and A. N. Bogdanov, J. Phys.: Conf. Ser. 303, 012105 (2011).
- Soumyanarayanan et al. (2017) A. Soumyanarayanan, M. Raju, A. L. Gonzales Oyarce, A. K. C. Tan, M.-Y. Im, A. P. Petrović, P. Ho, K. H. Khoo, M. Tran, C. K. Gan, F. Ernult, and C. Panagopoulos, Nat. Mater. 16, 898 (2017).
- Dhital et al. (2017) C. Dhital, L. DeBeer-Schmitt, Q. Zhang, W. Xie, D. P. Young, and J. F. DiTusa, Phys. Rev. B 96, 214425 (2017).
- Shibata et al. (2013) K. Shibata, X. Z. Yu, T. Hara, D. Morikawa, N. Kanazawa, K. Kimoto, S. Ishiwata, Y. Matsui, and Y. Tokura, Nat. Nanotechnol. 8, 723 (2013).
- Prior and Battle (2003) T. J. Prior and P. D. Battle, J. Solid State Chem. 172, 138 (2003).
- Prior et al. (2004) T. J. Prior, D. Nguyen-Manh, V. J. Couper, and P. D. Battle, J. Phys.: Condens. Matter 16, 2273 (2004).
- Prior et al. (2005) T. J. Prior, S. E. Oldham, V. J. Couper, and P. D. Battle, Chem. Mater. 17, 1867 (2005).
- Battle et al. (2007) P. D. Battle, F. Grandjean, G. J. Long, and S. E. Oldham, J. Mater. Chem. 17, 4785 (2007).
- Li et al. (2016) W. Li, C. Jin, R. Che, W. Wei, L. Lin, L. Zhang, H. Du, M. Tian, and J. Zang, Phys. Rev. B 93, 060409(R) (2016).
- Conway and Prior (2019) J. O. Conway and T. J. Prior, J. Alloys Compd. 774, 69 (2019).
- Stephens (1999) P. W. Stephens, J. Appl. Crystallogr. 32, 281 (1999).
- Stickel (2010) J. J. Stickel, Comput. Chem. Eng. 34, 467 (2010).
- Bocarsly et al. (2018) J. D. Bocarsly, R. F. Need, R. Seshadri, and S. D. Wilson, Phys. Rev. B 97, 100404(R) (2018).
- Bauer and Pfleiderer (2016b) A. Bauer and C. Pfleiderer, “Generic aspects of skyrmion lattices in chiral magnets,” in Topological Structures in Ferroic Materials, Springer Series in Materials Science, Vol. 228, edited by J. Seidel (Springer, Cham, 2016) pp. 1–28.
- Adams et al. (2012) T. Adams, A. Chacon, M. Wagner, A. Bauer, G. Brandl, B. Pederson, H. Berger, P. Lemmens, and C. Pfleiderer, Phys. Rev. Lett. 108, 237204 (2012).
- Janoschek et al. (2013) M. Janoschek, M. Garst, A. Bauer, P. Krautscheid, R. Georgii, P. Böni, and C. Pfleiderer, Phys. Rev. B 87, 134407 (2013).
- Brazovskii (1975) S. A. Brazovskii, Sov. Phys. JETP 41, 85 (1975).
- Buhrandt and Fritz (2013) S. Buhrandt and L. Fritz, Phys. Rev. B 88, 195137 (2013).
- Chikazumi (1997) S. Chikazumi, “Physics of ferromagnetism,” (Oxford University Press, USA, 1997).
- Kataoka (1987b) M. Kataoka, J. Phys. Soc. Jpn. 56, 3635 (1987b).
- Wilson et al. (2014) M. N. Wilson, A. B. Butenko, A. N. Bogdanov, and T. L. Monchesky, Phys. Rev. B 89, 094411 (2014).
- Belov and Goryaga (1956) K. Belov and A. N. Goryaga, Fiz. Met. I Metalloved. 2, 3 (1956).
- Arrot (1957) A. Arrot, Phys. Rev. 108, 1394 (1957).
- Kuz’min et al. (2010) D. Kuz’min, D. Givord, and V. Skumryev, J. Appl. Phys. 107, 113924 (2010).
- Gilbert et al. (2019) D. A. Gilbert, A. J. Grutter, P. M. Neves, G.-J. Shu, G. Zimanyi, B. B. Maranville, F.-G. Chou, K. Krycka, N. P. Butch, S. Huang, and J. A. Borchers, Phys. Rev. Mater. 3, 014408 (2019).
- Nayak et al. (2017) A. K. Nayak, V. Kumar, T. Ma, P. Werner, E. Pippel, R. Sahoo, F. Damay, U. K. Rößler, C. Felser, and S. S. P. Parkin, Nature 548, 561 (2017).