Probing the Pinning Strength of Magnetic Vortex Cores with sub-nm Resolution
Topological magnetic textures such as vortex cores or skyrmions are key candidates for non-volatile information processing Parkin et al. (2008); Jung et al. (2012); Fert et al. (2013, 2017). This exploits the texture movement by current pulses that is typically opposed by pinning Jiang et al. (2015); Woo et al. (2016). A detailed understanding of pinning is hence crucial with previous experiments being either limited in terms of controlled magnetic texture positioning Hanneken et al. (2016); Attané et al. (2001) or in terms of spatial resolution Cowburn et al. (1998); Burgess et al. (2013); Holleitner et al. (2004); Rahm et al. (2004); Kläui et al. (2003); Badea and Berezovsky (2016); Basith et al. (2012); Compton and Crowell (2006). Here, we use spin-polarized scanning tunneling microscopy to track a magnetic vortex core that is deliberately moved by a 3D magnetic field. The core covering Fe-atoms gets pinned by defects that are only a few nm apart. Reproducing the vortex path via parameter fit, we deduce the pinning potential of the defects as a mexican hat with short-range repulsive and long-range attractive part. By comparison with micromagnetic simulations, the attractive part is attributed to a local suppression of exchange interaction. The novel approach to deduce defect induced pinning potentials on the sub-nm scale is transferable to other non-collinear spin textures eventually enabling an atomic scale design of defect configurations, e.g., for reliable read-out in race-track type devices Castell-Queralt et al. (2019); Fernandes et al. (2018).
The intentional pinning of non-collinear magnetic textures by designed defects could enable reliable positioning of domain walls, skyrmions or vortices in future devices such as race-track memories Parkin et al. (2008); Fert et al. (2013, 2017). Magnetic textures are typically pinned in areas of altered magnetization, exchange interaction, anisotropy, or Dzyaloshinskii-Moriya interaction Paul (1982); Fernandes et al. (2018); Stosic et al. (2017); Müller and Rosch (2015). Previous experiments probed domain walls Cowburn et al. (1998); Holleitner et al. (2004); Basith et al. (2012), magnetic vortices Burgess et al. (2013); Rahm et al. (2004); Badea and Berezovsky (2016); Compton and Crowell (2006); Vansteenkiste et al. (2008) or skyrmions Hanneken et al. (2016) embedded in stripes Holleitner et al. (2004); Basith et al. (2012), rings Kläui et al. (2003), islands Burgess et al. (2013); Rahm et al. (2004); Badea and Berezovsky (2016); Compton and Crowell (2006); Vansteenkiste et al. (2008) or thin films Cowburn et al. (1998); Attané et al. (2001); Hanneken et al. (2016) revealing pinning at large, artificial structures (size: nm) such as notches Kläui et al. (2003), holes Vansteenkiste et al. (2008); Rahm et al. (2004) or locally thinned areas of the film Holleitner et al. (2004); Burgess et al. (2013) as well as at intrinsic irregularities, e.g., due to surface roughness Chen et al. (2012) or dislocations Attané et al. (2001). Recently, the pinning of skyrmions at single magnetic impurities has also been probed, but without exerting controlled forces Hanneken et al. (2016). Hence, so far experiments were not able to deduce the pinning potential of point defects with the required sub-nm spatial resolution.
Here, we employ spin polarized scanning tunneling microscopy (STM) to study pinning of the curled magnetization of a magnetic vortex core Shinjo (2000); Wachowiak et al. (2002). We apply well defined lateral forces by in-plane magnetic fields and independently tune the size of the vortex core by an out-of-plane field . The latter enables control on the non-collinearity of the core magnetization and, hence, on the strength of exchange energy density in the core. Surprisingly, we find that a vortex core with diameter 3.8 nm and depth 10 nm ( Fe-atoms) jumps between defects only a few nm apart. The exact pinning position is deduced by measuring topography and core magnetization simultaneously, revealing an eccentric core pinning 2 nm away from the next adsorbate. We reproduce the measured core path along several defects via superposing pinning potentials, each consisting of an attractive part with amplitude 200 meV originating from quenched and an even stronger repulsive part of unknown origin.
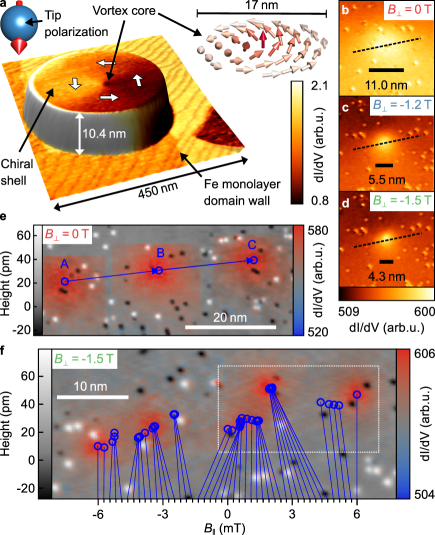
Atomically flat, elliptical Fe islands with vortex configuration are prepared by molecular beam epitaxy on W(110) (methods) Wachowiak et al. (2002); Bode et al. (2004). STM with antiferromagnetic Cr tips Bassi et al. (2007) records the topography and the spin polarized differential conductance d/d simultaneously (methods). Figure 1a displays an overlay of these signals for a typical island. The vortex core appears as a dark spot due to the spin-polarized d/d contribution proportional to the dot product of tip and sample magnetization vectors Bode (2003). Defects are visible (Fig. 1b-d) via the non-magnetic part of d/d probing the local density of states Bode (2003).
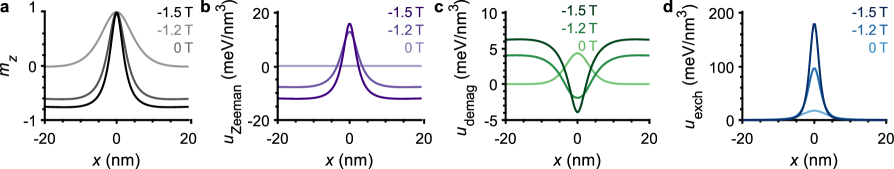
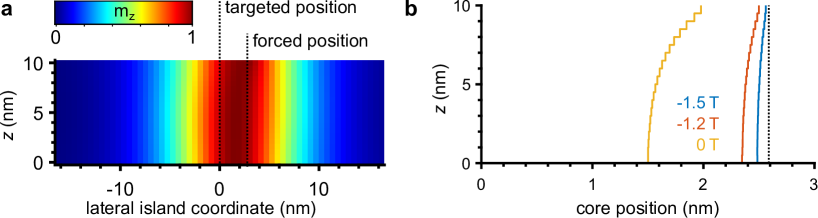
A 3D vector magnet provides and Mashoff et al. (2009), hence, tunes the vortex core size and its position, respectively Wachowiak et al. (2002). Figure 1b-d show d/d-images of the core at increasing opposing the core magnetization. The magnetization can be represented by the normalized out-of plane contribution . The Zeeman energy increases and the core diameter shrinks with full width at half maximum (FWHM) of the distribution of nm (0 T), nm (-1.2 T) and nm (-1.5 T) Wachowiak et al. (2002). This is reproduced by micromagnetic simulations (supplement S2) implying a large modification of at the core center due to increasing spin canting: 18 meV/nm3 (0 T), 95 meV/nm3 (-1.2 T), 180 meV/nm3 (-1.5 T). The tuning enables varying the vortex-defect-interaction for all defects that modify exchange interaction.
Figure 1e reveals the presence of, at least, two types of defects. The 15 pm deep depressions are presumably oxygen adsorbates as remainders from the sample preparation. The 40 pm high protrusions are Cr atoms originating from tip preparation by voltage pulses. To study the interaction between the vortex core and these defects, we use to exert a lateral force on the vortex that shifts the core towards a target position. We monitor the deviation from the target due to defect pinning. For a defect-free magnetic cylinder, the core position with respect to the island center is adequately described by the rigid vortex model Guslienko et al. (2001). It minimizes the potential leading to Badea and Berezovsky (2016), i.e., the displacement is proportional to with displacement rate . Albeit elliptic islands lead to a directional dependence of and , the core displacement remains largely proportional to (supplement S4). With additional defects, the potential changes leading to deviations from the regular displacement along a straight path.
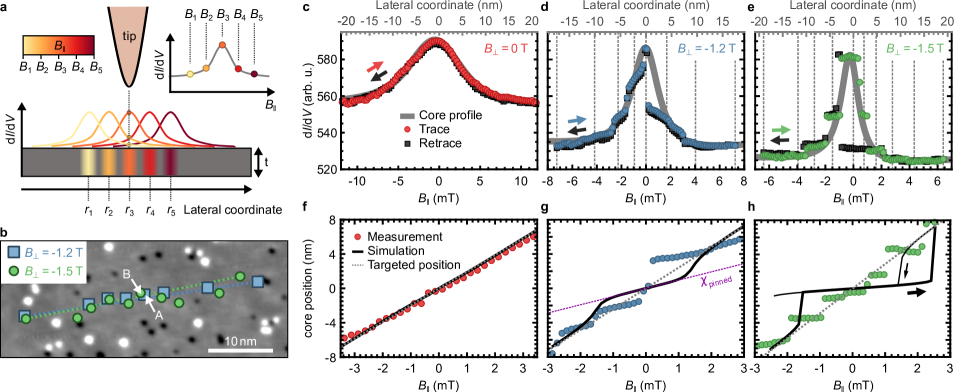
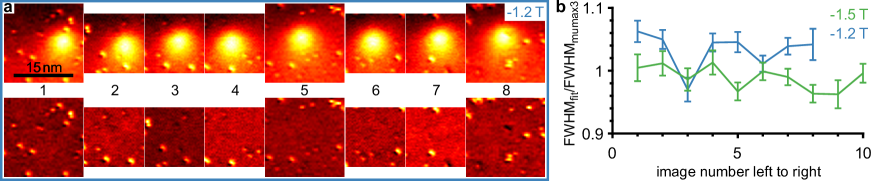
Figure 1e shows the vortex core at three equidistant for T . The resulting two displacement vectors exhibit equal lengths nm implying a constant displacement rate nm/mT as corroborated in Fig. 2f. In contrast, Fig. 1f shows irregular vortex core motion for T and 45 equidistant . The core positions are neither equidistant nor along a straight path, but cluster in the vicinity of defects indicating attractive pinning of the core. Remarkably, a vortex core containing Fe atoms (diameter: 3.8 nm, depth: 10 nm) is pinned close to a single adsorbate. Bending of the core in depth direction is relatively small as verified by micromagnetic simulations (supplement S5).
The pinning naturally reduces the displacement rate . To determine the resulting , a second type of experiment is performed. While the vortex core is displaced by 99 equidistant , d/d is measured at fixed tip position (Fig. 2a). We target for the identical defect-free path of length 35 nm along several defects for different (Fig. 2b). For T, the resulting d/d features an identical shape as the core shape probed by d/d in real space at constant (gray solid line), i.e., d/d is the same for a tip scanning across a fixed vortex core and for a vortex core scanned below a fixed tip by . This confirms, that the large core at T barely interacts with the defects. In contrast, the datasets at T and -1.5 T show sudden jumps not appearing in the real space data (Fig. 2d,e). They split the curve into segments of reduced slope due to core pinning. The transitions between the segments correspond to jumps between different pinning sites.
To compare these data with theory, we firstly establish a link between the measured d/d and the core displacement (methods). The conversion uses the real space d/d(), implicitly assuming an immutable core profile and a straight core path. The core shape indeed exhibits negligible FWHM changes by less than along the path (supplement S6). The motion is not straight (Fig. 2b), but the relatively small excursions imply an error of by only 5 % (0.3 %) at T ( T) (supplement S6). Figure 2f-h display the converted data. For 0 T, we find one constant slope T nm/mT, while, for T (-1.5 T), segments with average slope T nm/mT ( T nm/mT) are interrupted by jumps. A small segment with even negative slope appears (Fig. 2h, mT) likely originating from a larger sidewards excursion of the core. We deduce a large tuning of the displacement rate ratio %, 42 %, and 3 % at T, -1.2 T, and -1.5 T, respectively.
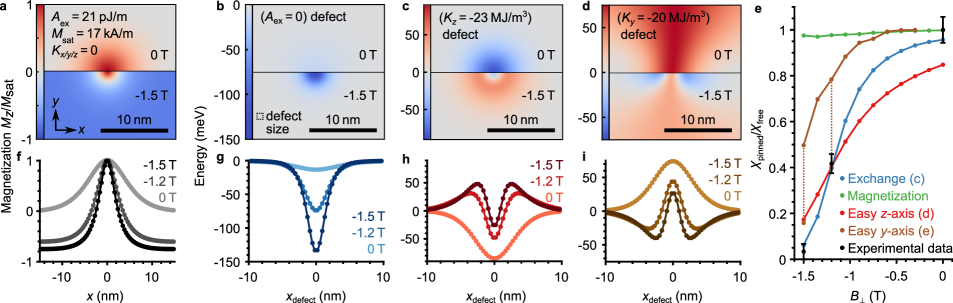
To reproduce this, we conduct micromagnetic simulations of an Fe cylinder (diameter: 280 nm, height: 10 nm) with exchange stiffness , saturation magnetization , and uniaxial anisotropy known from previous experiments Wachowiak et al. (2002). The pinning site is modeled by suppressing , respectively , within nm3. This defect is moved laterally through the vortex in the island center emulating the vortex movement through the defect by equidistant (methods). The deduced core path as function of is plotted as solid lines in Fig. 2f-h. It reveals slopes around very close to the segment slopes of the experimental data, i.e., we find theoretical %, 40 %, and 6 % for T, -1.2 T, and -1.5 T, respectively. This strongly suggests that quenching of is the origin of pinning.
To corroborate this conjecture, simulations are pursued for defects with changed , and . Figure 3b-d and g-i show resulting pinning potentials deduced from the energy of the vortex core at the corresponding positions (methods). The defect with quenched features a purely attractive potential with an order of magnitude variation in amplitude by (Fig. 3g). The defects with changed anisotropy show more complex potentials with amplitudes that are less dependent on .
For each kind of defect, we simulated the displacement rate around the potential minimum and compared with experimental values (Fig. 3e). The measured trend is quantitatively reproduced for a defect with quenched , but not for the other types. Using and as unrestricted fit parameters, can, at most, be reproduced for one of the three within error bars. The optimal fitting, moreover, leads to unrealistically large cumulative anisotropies for a single adsorbate: meV, eV (supplement S10). Quenched magnetization does barely pin the core at all implying that quenched is indeed the main origin of pinning.
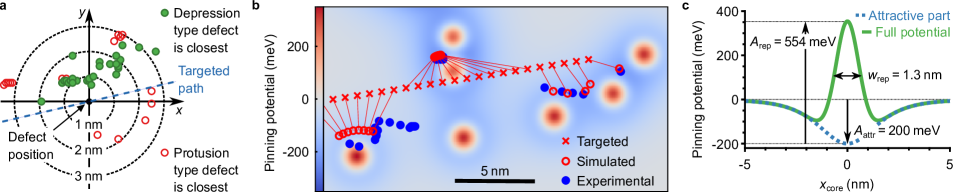
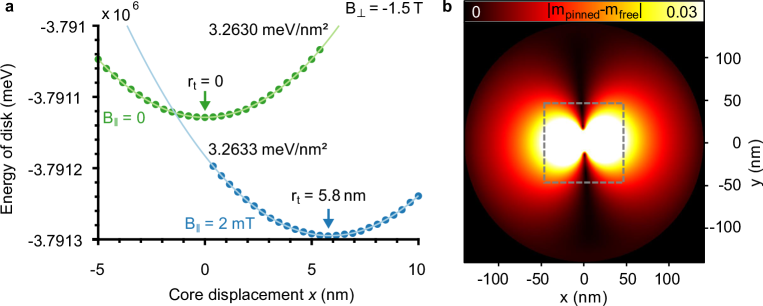
Next, we evaluate the precise pinning position of the vortex core center with respect to the closest adsorbate (Fig. 4a). They cluster at 1-2 nm away from the adsorbate indicating an additional repulsion. Moreover, the offset is mostly directed perpendicular to the target path as expected for an isotropic potential preferentially attracting an object along a line perpendicular to its target path.
To estimate the repelling part of the potential, we employed a fit of 24 subsequent experimental pinning positions (blue dots, Fig. 4b) by adapting three parameters for an identical potential centered at each adsorbate, namely a scaling factor for the axially symmetric ()-potential (Fig. 3g, T) as well as height and FWHM of an axially symmetric Gaussian repelling part (Fig. 4c). The energetic cost of moving the core from the target path towards pinning is firstly calculated without defects via micromagnetic simulations of the vortex energy required to force the core away from its target path. Subsequently, this energy is combined with the pinning potentials yielding the minimum energy position (methods). Figure 4b shows rather good agreement of resulting optimized path (red circles) and measured core positions (blue circles) employing the defect potential of Fig. 4c.
It is a mexican hat with minima located 1.5 nm away from the center as expected from the pinning positions (Fig. 4a). The mexican hat also reproduces the queuing of the core in front of the double defect located above the target path (Fig. 4b). This queuing is markedly different from the slow motion during pinning at a single defect. It cannot be reproduced by overlapping two ()-potentials with arbitrary independent positions and, hence, corroborates the mexican hat shape. Naturally, the ()-part of Fig. 3g has to be rescaled to compensate for the repelling part, i.e. the ()-defect has to be slightly enlarged.
We were not able to pinpoint the origin of the repulsive part. Since it is smaller than the vortex core, it cannot be reproduced by simply changing parameters constantly within a certain area. We refrained from optimizing more complex defect structures avoiding the increasing parameter space.
Employing simulations based on density functional theory (DFT), we investigated the impact of single Cr and O adatoms on the magnetic properties of Fe(110). We find remarkably strong changes of the pairwise magnetic exchange interactions (, : atomic sites) affecting up to neighboring Fe atoms (supplement S10). The summed up change is meV consisting of similar amounts of weakening and strengthening of due to the oscillatory behavior of the interactions as function of distance. Hence, the sum of changes of amounts to eV. However, if the vortex core texture is not changed by the defect as implied by the barely changing spin contrast in STM (supplement S6), the amplitude of the core-adsorbate interaction amounts to only meV (supplement S10). Thus, while the DFT results reveal that single Cr or O adsorbates influence the core path on the 0.5 nm scale (supplement S10), they do not explain the experiments quantitatively. We speculate that the adsorbate structure is either different than anticipated or that the adsorbate is accompanied by particular strain fields below the surface accounting for the missing energy.
Our novel method provides the first quantitative handle on pinning energies of magnetic textures at the sub-nm scale. In principle, it can be applied to different kinds of deliberately placed defects on different types of magnetic islands featuring vortices. It can also be used for other non-collinear textures such as skyrmions or transverse domain walls anticipated to be used in racetrack memories Parkin et al. (2008); Fert et al. (2013, 2017). Both have been imaged by spin polarized STM Romming et al. (2013); Bode (2003); Hanneken et al. (2016). For skyrmions, additionally the spin canting and, hence, can be tuned by Romming et al. (2015). Forces on domain walls can be exerted by , Ono (1999); Kläui et al. (2003), while skyrmions can be moved by electric currents Jiang et al. (2015); Woo et al. (2016), for which respective forces are deduced by combining micromagnetic simulations and an analytic description via the Thiele equation Sampaio et al. (2013). This would enable experimental probing of the theoretically predicted skyrmion-defect interaction strenghts Fernandes et al. (2018); Lin et al. (2013); Müller and Rosch (2015); Stosic et al. (2017). Eventually, our method could provide tailoring rules for defect induced guiding of magnetic textures in racetrack memories Castell-Queralt et al. (2019); Fernandes et al. (2018).
Acknowledgements.
We gratefully acknowledge insightful discussions with H.-J. Elmers, S. Blügel, A. Schlenhoff, M. Liebmann and financial support of the German Science Foundation (DFG) via PR 1098/1-1 and of the European Research Council (ERC) under the European Union’s Horizon 2020 research and innovation program (ERC-consolidator grant 681405 — DYNASORE). We are grateful for the computing time granted by the JARA-HPC Vergabegremium and VSR commission on the supercomputer JURECA at Forschungszentrum Jülich and at the RWTH Aachen supercomputer.I Methods
Preparation. A W(110) crystal (surface orientation better than 0.1°) is cleaned in ultra high vacuum (UHV) (base pressure: 10-10 mbar) by repeated cycles of annealing in oxygen atmosphere (partial pressure: 10-7 mbar) at 1400°C for 10 min and subsequent flashing to 2200°C for 10 s. Afterwards, ten pseudomorphic monolayers of Fe are deposited at room temperature by electron beam evaporation from an Fe rod (purity 99.99+%). The sample is then annealed at 710°C for 20 min leading to the formation of Fe islands such as in Fig. 1a on top of an Fe wetting layer Bode et al. (2004).
Spin polarized STM. The tunneling tip is fabricated from a mm2 beam of polycrystalline, antiferromagnetic Cr (purity 99.99+%). Tip sharpening employs electrochemical etching by a suspended film of 2.5 M NaOH solution within a PtIr loop that is at potential of 5.5 V with respect to the tip. Etching is stopped at drop off of the lower beam part via differential current detection. The upper part of the beam is immediately rinsed with DI water and glued onto a custom tip holder. The tip is then loaded into the UHV system and, subsequently, into the STM scan head at 6 K Mashoff et al. (2009). The atomic structure of the tip is optimized during tunneling by voltage pulses (10 V/30 ms) between tip and sample until spin contrast is achieved. Voltage is applied to the sample. The differential conductance d/d is measured by adding a 50 mV RMS sinusoidal voltage (1384 Hz) to the applied DC and recording the resulting oscillation amplitude of the tunnel current using a lock-in amplifier. The system enables a 3D magnetic field with out-of-plane component up to 7 T and simultaneous in-plane part up to 1 T in each in-plane direction Mashoff et al. (2009).
Micromagnetic simulations. The program mumax3 Vansteenkiste et al. (2014) is used to simulate relaxed magnetization states of an Fe cylinder of height 10 nm and diameter 280 nm with cell size nm3. Magnetic parameters are marked in Fig. 3a. Defects are emulated by altered magnetic parameters in cells at the top layer. For sweeps of with defect, two approximations are employed in order to reduce computational time. Instead of sweeping , we keep T and shift the defect through the vortex core by with deduced from a simulation of the vortex with varying but without defects. Second, we crop the simulation area down to cells via adding the previously calculated demagnetization field of the neglected area manually. This leads to an effective, spatially varying external magnetic field . The reasonable validity of these approximations is described in supplement S7. The resulting core center positions ( maxima) as a function of defect position are deduced from spline interpolations of in the layer below the defect. This avoids the more ambiguous evaluation of the partially discontinuous within the surface layer in the presence of defects.
Vortex core fitting to determine its center position. To reproduce the experimental spin polarized images and, hence, to deduce the vortex core center positions, vortex magnetization patterns are firstly simulated via mumax3. The result is then adapted to the experimental image at corresponding . Therefore, the polar and azimuthal angle of the tip magnetization are optimized using the dot product between sample and tip magnetization vector as image contrast. The resulting values are additionally offset and scaled to account for the non-spin-polarized d/d signal and the unknown amplitude of the spin-polarized d/d signal, respectively. Moreover, the vortex core center position is optimized in both lateral directions and the calculated image is slightly scaled laterally to account for inaccuracies of the fit (supplement S2).
The seven parameters (2 tip magnetization angles, offset, scaling factor, core position, lateral scaling factor) are fitted towards minimum RMS deviation between the simulated and the measured d/d map. The blue circles in Fig. 1e-f as partly also displayed in Fig. 4b and the squares and circles in Fig. 2b are the fitted lateral positions of the vortex core center with each symbol belonging to a fit of one d/d map. The fit error in core center position turns out to be nm. Fit images, residual images and standard deviations for all fit parameters are given in supplement S3.
For the superposition of topography and sequences of d/d data (Fig. 1e-f), the in-plane magnetization contribution of the fitted image is removed from the measured one and, for Fig. 1f, the resulting image is scaled by a Gaussian envelope function for the sake of visibility.
Conversion from d/d to core positions. To calculate a vortex core position from a d/d value measured at fixed tip location but varying , we use the line profile d/d of the vortex core measured at constant (Fig. 1bd). We first employ the fit procedure as explained in the previous section and then utilize the less noisy profile from the fitted, simulated images. Angle of chosen profile line and lateral shift of the profile line with respect to the core center are selected such that the maximum value in d/d and the d/d values at maximum and minimum of (Fig. 2c-e) are reproduced by a straight target path (supplement S4). The parameter is set to zero at maximum d/d. Using the resulting d/d, the measured d/d at is assigned to a core center position (d/d) with being the unit length vector in the selected profile direction. Principally, there are two possibilities of (d/d), left and right from the center of the profile line. They are handled such that the core center always moves to the closer of the two and continuously across .
Calculating vortex core pinning potentials To calculate the pinning potentials as displayed in Fig. 3, the parameters are homogeneously changed within cells mimicking the defect. Subsequently the defect is moved through the fixed vortex core and the resulting vortex energy is calculated by mumax3. The approximation to move the defect instead of the vortex core is discussed in supplement S7.
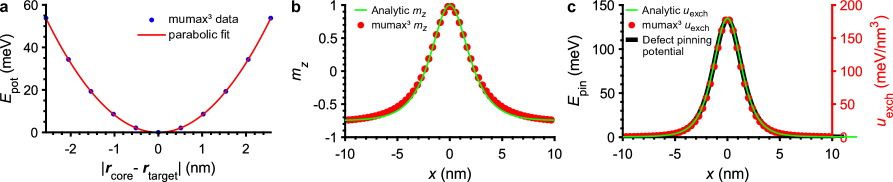
Simulating the vortex path for multiple defects. The vortex core position for an immutable core profile is given by minimizing the potential energy . is the energetic cost to move the vortex away from its target in the absence of defects. It is deduced from a set of mumax3 simulations fixing the vortex core artificially at different . This employs fixing within cells on the surface located away from . The values in that area are set to the values found in the center of the vortex core, if calculated without defects. The vortex core, consequently, moves to a particular with respect to . For this position, we calculate the vortex energy. We checked that the area of fixed leads to negligible changes of the vortex energy (supplement S8). For sake of simplicity, we approximate the resulting by an excellently fitting paraboloid (supplement S8).
The pinning potential of a single adsorbate is emulated as the sum of a repelling Gaussian and an analytic representation of the attractive part due to a defect with quenched . This pinning potential eventually reproduces the profile of Fig. 4c by fitting the core path in Fig. 4b. The analytic representation of the attractive part is derived straightforwardly from an analytic part of the core magnetization profile reading with fit parameters and Hubert and Schäfer (2008). The deduced analytic is fitted to the result from mumax3 (Fig. 3g) with respect to and exhibiting an RMS deviation of only 0.6 mV between analytic and micromagnetic representation of (supplement S8).
The subsequent fitting of the core path optimizes FWHM and amplitude of the repelling Gaussian as well as a scaling parameter for the attractive, analytic exchange part (Fig. 4c) towards minimizing the RMS of the distances between calculated and measured core center positions (Fig. 4b). Additionally, the start and end point of the target path are varied by up to nm during the fit with respect to the observed first and last core positions to account for possible pinning at these sites.
II Supplementary information
S1: Fe island
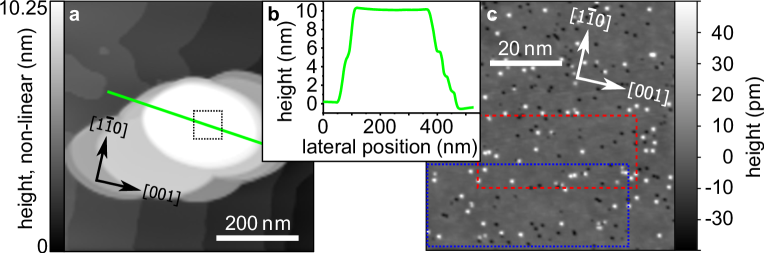
Figure 5a shows an STM image of the Fe island that has been studied in Fig. 1b-f and Fig. 2 of the main text. Its size is nm3. The crystallographic axes of the substrate as deduced from a low-energy electron diffraction pattern are added. The topographic image suffers from a multi-tip artifact that images the island several times. This does not influence spectroscopic measurements on the topmost imaged surface since the additional tips are a few nanometers away from that surface during its measurement.
S2: Micromagnetic energy densities of vortex core
Magnetic vortex patterns are relaxed within the micromagnetic software package mumax3 for a circular Fe island of thickness 10 nm and diameter 280 nm at perpendicular fields of T, -1.2 T, and -1.5 T. The simulation space is discretized into cells of size nm3. Magnetic parameters are set to saturation magnetization kA/m, exchange stiffness pJ/m, and zero magnetocrystalline anisotropy Wachowiak et al. (2002). Spatially resolved energy densities of the Zeeman term, the demagnetization and the exchange are output by the software after relaxation of the magnetization pattern. Profiles through the vortex center of the cylindrical symmetric energy densities are shown together with profiles of the scaled out-of-plane magnetization in Fig. 6.
The profiles (Fig. 6a) largely map the experimentally observed images, in particular, if the exact shape of the island is taken into account (section II). The exchange energy densities (Fig. 6d) are much larger than the other two energy contributions. They, moreover, vary by approximately an order of magnitude with , which results in a strong variation of pinning strength with for a defect with quenched , as described in the main text.
S3: Core fitting procedure
Figure 7 visualizes the fitting procedure for images of the vortex core as shown in Fig. 1b-d of the main text and again in the 2nd column of Fig. 7.
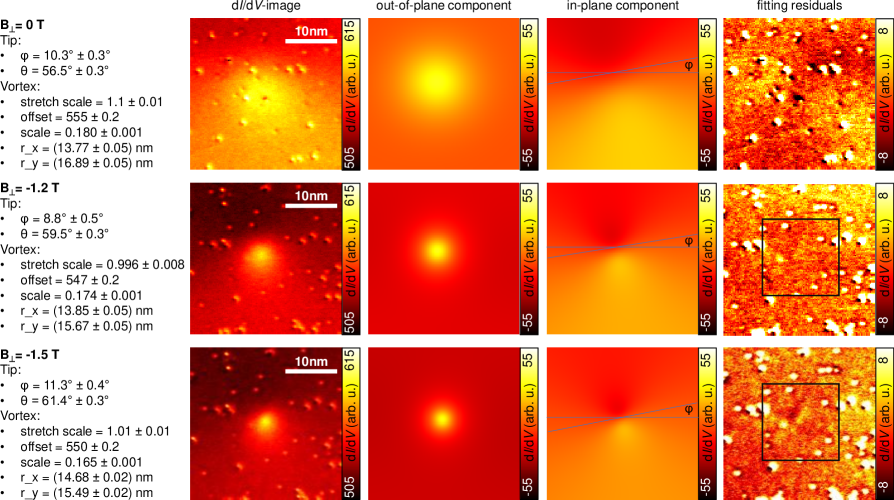
The micromagnetic simulations employed for the core fits are conducted for an Fe island with thickness of 10 nm and lateral shape as determined by STM experimentally. The island is discretized in cells of nm3. The experimental images and the micromagnetically simulated magnetization images are firstly interpolated to the same resolution. Moreover, defects are removed from the experimental image by a masking procedure prior to the fitting. Fit parameters are the two angles of the tip magnetization vector, the core position , a small lateral scale factor for the simulated images as well as the required offset and scale factor to transfer the dot product of magnetization vectors of tip and sample to the simulated value Bode (2003).
The seven fit parameters are optimized towards minimum RMS deviation between simulated and measured d/d map employing the MATLAB inbuilt trust-region-reflective least squares algorithm. At larger , we only use the displayed black squares in the right column of Fig. 7 for optimization such that we get more sensitive to the core region. The quality of the fits is visible in the most right column of Fig. 7 showcasing the residual images that are obtained by subtracting the simulated image from the experimental one. Only the adsorbates on the surface are visible with barely any magnetic contrast originating from the vortex core, even at the tenfold increased contrast scale of the residual images with respect to the experimental images. The resulting fit parameters and confidence intervals are given in the left column of Fig. 7.
The fit parameters firstly reveal a tip magnetization that slightly cants into the out-of plane direction with increasing as expected. Moreover, the stretch scale is very close to one at larger , while deviating by 10% at T. In line, the residual contrast surrounding the core is more pronounced at T, where it features four areas of alternating bright and dark contrast. This is likely caused by the influence of adsorbates on the in-plane magnetization that prohibits a perfect fitting by the micromagnetic vortex simulated without defects. In line, the stretch factor at larger also deviates from one by %, if the adapting area is not reduced to the displayed square. The deduced offset and scale are very similar for all three . The obtained large consistency of all fit parameters implies that the fits are reliable, in particular, at larger , enabling a rather precise determination of the core center position of the vortex.
Via the extracted angle of tip magnetization, we, moreover, can discriminate the out-of-plane contrast and the in-plane contrast of the images as displayed in the third and forth column of Fig. 7 for the simulated images. The in-plane angle of tip magnetization is additionally marked. The discrimination is used to display an overlap of several vortex cores in one image as in Fig. 1e-f of the main text. To improve the visibility of each core, we subtract the in-plane contrast from the experimental images. For Fig. 1f of the main text and the second supplemental movie, we afterwards multiply the remaining out-of-plane contrast including defects by a Gaussian envelope centered at the vortex core center. This makes following the vortex core visually significantly more easy.
S4: Core movement in elliptic island
As described in the main text, the lateral core position induced by follows with displacement rate for a circular magnetic island Badea and Berezovsky (2016). We assume a similar relation for the investigated elliptical island. This allows us to deduce target positions from by a shift from the starting point T nm. The validity of this assumption is verified by micromagnetic simulations revealing that a change of by results in nearly identical core shifts independent of . We employ a grid of simulations with equidistant using the experimental island shape with cell size nm3 and magnetic parameters as displayed in Fig. 3a of the main text.
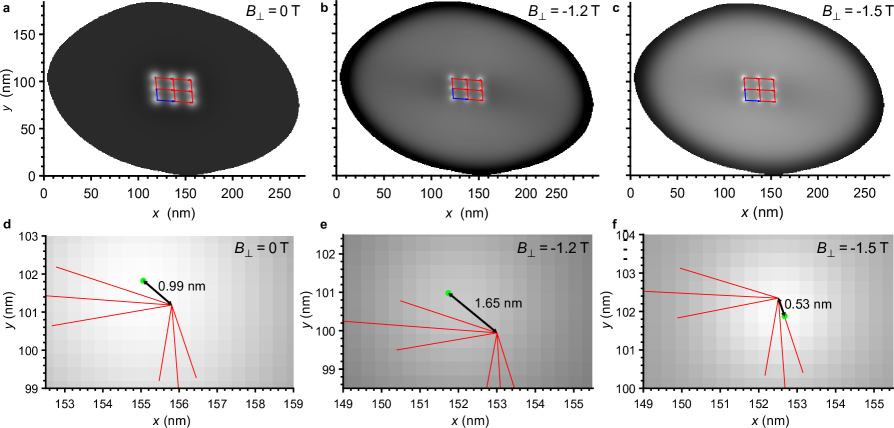
Fig. 8ac show an overlay of the resulting nine vortex cores with centers connected by colored vectors for each of the three experimental . The bottom left vortex core is used as reference point with two lattice vectors (blue) to its nearest neighbors. These vectors set the displacement rates and . Assuming constant , the red vectors mark the lattice continuation that roughly hits the other calculated vortex cores. Zooming into the area of the upper right core (Fig. 8df) reveals a remaining mismatch of nm. This corresponds to a displacement error of % on the full range of 37 nm of core movement, directly translating to an error of the anticipated constant in Fig. 2fh of the main text. Note that the distance of the simulated core movement in Fig. 8 is identical to the experimental one in Fig. 2fh of the main text.
S5: Core bending within Fe island by pinning at the surface
Spin polarized STM probes the magnetization of the surface layer that could be distinct from the magnetization in deeper layers. In particular, if the pinning center is at the surface only, the vortex core might bend towards its target position in deeper layers. Here, we show that the resulting vortex core bending is small.
We analyze micromagnetic simulations with vortex cores shifted from the island center. The shift is achieved by fixing within surface cells offset from the island center. The fixed values are set to the values that are found in the core center for simulations without defects. The resulting cross section of through the island (Fig. 9a) is analyzed. We use cross sections slightly offset from the island center to avoid the cells with artificially fixed . Figure 9b shows deduced core positions ( maxima) evaluated for each layer separately. The core at T (-1.2 T, -1.5 T) is bent by 30 % (6.3 %, 2.7 %) of the average displacement from the island center. The bending at T, where we observe pinning in the experiment, is well below 10% and, hence, barely changes the pinning energy. Such core bending is anyway included in our micromagnetic simulations of (Fig. 3g of the main text) and in the calculation of the parabolic potential for moving the vortex core away from its target (Fig. 11a, Fig. 12a).
S6: Core position error using data at fixed position and varying
In Fig. 2 of the main text, we deduced the vortex core position from measuring at fixed tip position, while varying . This assumes a rigid vortex motion along a straight path. The assumption implies errors, since the vortex core shape could change by interactions with defects and the core is displaced from the straight path due to defect pinning as visible in Fig. 2b of the main text. These errors are discussed in the following.
To quantify the change of core shape, we analyze the core images along the core path of Fig. 2b of the main text (Fig. 9a). The FWHM of distribution is deduced from core fitting as described in section S3 . It is displayed in Fig. 9b varying by about without any obvious trend within the error bars from the fitting procedure. Hence, core shape modifications during pinning are below . This value is regarded as error for the link between measured d/d and core displacement (Fig. 2 of main text).
Moreover, the core path is deflected from the straight path by the defects. It exhibits RMS deviations perpendicular to the target path up to 1.3 nm (Fig. 2b of main text). This implies two systematic errors. First, the path gets longer by the zigzag motion such that is underestimated by assuming a straight path. This error is estimated straightforwardly by using the measured path of Fig. 2b of the main text. The real path is by 5 % (0.3 %) longer than the straight path at T (-1.2 T). For the estimate, we measure the largest angle between target path and direct lines between adjacent core positions to be 30°(7°) at T (-1.2 T) (Fig. 2b, main text) and assume a normal distribution of such angles between adjacent core positions up to the maximum angle.
Second, perpendicular motion changes the sensed core magnetization at fixed tip position since the tip probes another part of the vortex. This error largely disappears for multiple pinning sites, since it either enhances or decreases by corresponding changes of depending on the individual core center position with respect to the tip and the target path.
S7: Approximations for micromagnetic simulations
For simulated sweeps of , as employed for Fig. 2f-h, Fig. 3e, and Fig. 4b of the main text, two approximations are used to reduce computational time. They are validated in the following.
As first approximation, instead of sweeping , we shift the defect by through the vortex core. This requires that , the displacement energy of the vortex around a target position , does not depend on .
To show this, we simulate for either located in the center of the island or offset from it (main text, methods). We employ a grid with one cell in vertical direction for the sake of simplicity such that the core displacement is accomplished by a single cell of fixed located away from . It turned out that remained parabolic at all relevant distances of up to 30 nm from the center of the island. Fig. 11a displays the micromagnetically calculated for different along the target path in comparison with parabolic fits showcasing the nice agreement. The curvature of the parabola changed by 0.01 % (10 %) for distances of 5 nm (30 nm) from the island center. We conclude that the displacement of the vortex mostly depends on the relative distance to the defect, but only marginally on the absolute position of the core within the island. Hence, moving the defect instead of the vortex core is a reasonable approximation to deduce (Fig. 2f-h and Fig. 3e of the main text). Note that Fig. 2f-h of the main text cover only nm such that the curvature error is well below 1%.
This agreement also justifies the assumption of a paraboloid for for the simulation of core movement in the disorder potential as shown in Fig. 4b of the main text. Deviations from the paraboloid in the direction perpendicular to the target path are even smaller, since the effective magnetization around the vortex is even less changed.
The independence of from is corroborated by a simplified analytic model assuming a rigid movement of vortex magnetization by Rahm et al. (2004). This employs the magnetic displacement model for a magnetic cylinder discussed in the main text with potential energy . The equation can be rewritten as with and . Hence, moving on a circular island leads only to an offset in potential energy (second term), but does not affect the potential curvature or the potential shape.
As second approximation, we crop the simulation area to cells and add the demagnetization field of the missing exterior by hand leading to an effective magnetic field . is calculated once for an unperturbed vortex without defects at T and is fixed afterwards for all other simulations. This is possible, since we always use T and, thus, nm via the first approximation. The small core displacement resulting from pinning forces by defects changes the magnetization only within the cropped area significantly. Figure 11b shows the spatially resolved absolute difference in magnetization between a vortex core located at nm and a core moved by pinning to nm at T. This displacement is larger than any displacement observed experimentally due to defects. The scaled magnetization outside the fully simulated area (gray box) varies by less than 3 % strongly decaying away from the square. As shown in section II, the general influence of demagnetization on the vortex core energy is small. Hence, the resulting error of using an unmodified is likely negligible.
S8: Approximations for core path simulation
To emulate the vortex core path at varying , we determine its lateral position by potential energy minimization within a potential landscape given by defects as described in the main text. The potential energy firstly consists of the potential describing the energy cost to move the core away from its target position in the absence of defects. Secondly, the pinning potentials centered at each adsorbate contribute to the potential energy. For both potential parts, we use approximations that enable easier computation.
is deduced from forcing the vortex core away from . Therefore, is fixed within simulation cells at the surface positioned away from to the values of a defect-free vortex core center. Subsequently, the vortex energy at the resulting core position is calculated. This mimics forcing the core away from by a defect. Such movement differs from movements via regarding the change of magnetization in the surrounding of the core. The required unphysical area of fixed magnetization barely changes the vortex energy. To estimate the corresponding error, we employed a second relaxation step while fixing the magnetization obtained from the first relaxation in all cells except of the priorily fixed ones and one additional ring of cells surrounding them. For the largest core displacement observed at T, the potential energy changes by only 1.8 % due to this second relaxation step. Hence, the energy error of fixing in a few cells is well below 2 %. Afterwards, the resulting is fitted by a parabola (Fig. 12a). The fit exhibits a negligible RMS deviation of 0.03 meV to the micromagnetic data for the largest displacements observed experimentally. Thus, we used a parabola for further on.
For the pinning potentials , identical for each , we superposed a repelling Gaussian and the scaled exchange energy density of the core as described in the main text. To increase computational speed, we employ an analytic representation of , based on an analytic approximation of :
| (1) |
with being the magnitude of in the surrounding of the vortex core and the width of the core . This leads to
| (2) | |||||
with and .
Figure 12c compares from mumax3 with the analytic description as best fit by adapting and FWHM. Excellent agreement is achieved with rms deviation of 0.6 meV only. The comparison of profiles is shown in Fig. 12b. The reversed pinning potential for a defect with suppressed within nm3 (Fig. 3g of main text) is added to Fig. 12c. Obviously, the relatively small defect simply tracks such that the scaled analytic can be used to mimic the attractive part of the defect potential for the core path simulation.
S9: Errors in core path simulation and deduced pinning potential
The most severe error in core path simulation results from the remaining uncertainty in the adaption of the core shape at a defect. As shown in Fig. 10b, the FWHM of the profile fluctuates by %. This translates via eqs. (1) and (2) (section II) to an error of % in the FWHM of , hence, influencing the pinning potential analogously by construction. The other energy errors are significantly smaller, namely, the error due to determination of via fixing in simulation cells (%, section II), the error due to determination of by moving the defect instead of the vortex core ( %, section II), the error due to the parabolic fit of (%, section II) and the error due to the cropping procedure (likely negligible, section II).
Another source of error is more difficult to quantify. It is given by uncertainties in the determined core positions that are non-linearly linked to the deduced defect potential. This includes the missing knowledge on the true target path due to the fact that start and end point of the path of the vortex core are influenced by defects, too. The adaption of these points in our fitting routine reveals deviations by nm on the full length of 40 nm in line with typical excursion lengths from the straight path due to defects. A similar deviation results from the anticipated straight target path in an elliptic island being incorrect by nm on the path of 40 nm, too (section II). Other position errors are much smaller such as uncertainties in core center positions deduced from the fitting of noisy images ( nm, section II), uncertainties in the overlap of adjacent images of the vortex core ( nm) and creep and drift effects within the images ( nm, Mashoff et al. (2009)).
Importantly, the main errors can be improved, in principle, via reducing the defect density, such that the distance between defects is significantly larger than the core diameter. Then, the influence of a single defect on the core shape can be probed in detail and start and end points of the target path can be chosen far away from any defect. Subleading errors can be reduced by more elaborate micromagnetic simulations.
S10: Ab-initio calculations
We performed ab-initio based calculations of Cr- and O-adatoms deposited on an Fe(110) surface using density functional theory (DFT) as implemented in the full-potential Korringa-Kohn-Rostoker Green function (KKR-GF) method Papanikolaou et al. (2002); Bauer (2014). Relativistic effects are taken into account via the scalar relativistic approach with the self-consistent inclusion of the spin orbit coupling as a perturbation. The exchange correlation potential is treated in the local spin density approximation as parametrized by Vosko, Wilk and Nusair Vosko et al. (1980). Instead of seeking for the wave function of the system, the KKR-GF method aims primarily at calculating the Green function using multiple scattering theory by solving the Dyson equation:
| (3) |
This enables, e.g., to describe impurities deposited on a pristine substrate using an embedding scheme. Indeed, the previous Dyson equation can be solved in real space by obtaining the Green function of the investigated material by knowing the Green function of the perfect Fe(110) substrate and , the potential change induced by the adatom. Once the Green function is obtained, the electronic and magnetic properties are deduced by extracting, e.g., charge and spin densities, local density of states, and magnetic exchange interactions.
The Fe(110) substrate with a lattice constant of pm is simulated considering a slab containing 12 layers of Fe with enough vacuum layers surrounding it, six on each side of the slab. After relaxing the atomic positions at the surface, leading to values in accordance with Ossowski and Kiejna (2015), we solve the previous Dyson equation for a real-space impurity cluster. This cluster has a diameter of 6 lattice constants and consists of the adsorbate and 150 Fe atoms from the substrate (Fig. 13a/c). The adsorbates, O or Cr, are located in the long bridge position at a distance of 103 pm above the surface as known for O Miyano et al. (1986); Getzlaff et al. (1999); Eder et al. (2001); Ossowski and Kiejna (2015) and assumed to be identical for Cr.
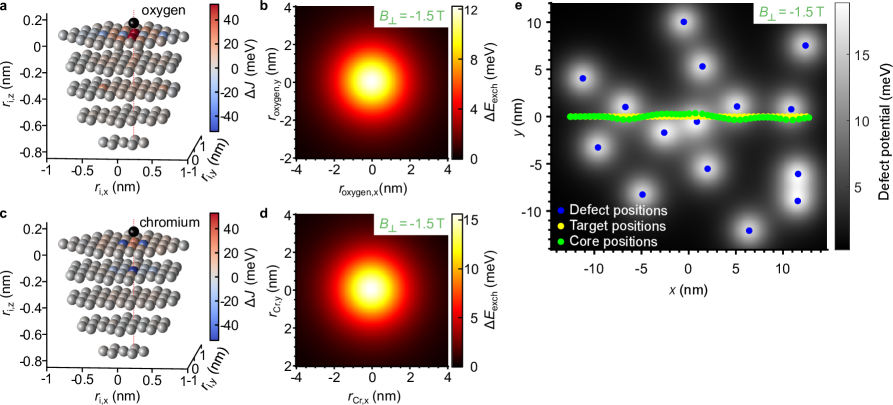
Without the adsorbate, the average magnetic moment of the Fe atoms is 2.65 . With O (Cr), the closest Fe moment decreases to 1.68 (0.68 ) while the substrate without considering the adsorbate experiences a cumulative reduction of the magnetization by 1.7 (4.6 ).
The change of the anisotropy due to the oxygen adsorbate was calculated by the energy difference , where and denote the orientation of a ferromagnetic spin configuration along (-axis), (-axis) or (-axis). Hence, indicates that the easy axis turns towards the -direction when putting the O-adatom on top. The calculated values are meV, meV and meV, i.e., an in-plane magnetization along is favoured by the O-adatom. Importantly, these energies are much lower than the experimentally observed pinning energies ( meV) discarding any influence of the anisotropy energy on the pinning.
Utilizing a mapping procedure based on infinitesimal rotation of the magnetic moments Liechtenstein et al. (1984, 1987), the magnetic exchange interactions of an isotropic Heisenberg Hamiltonian , are extracted from the ab-initio calculations, where and are the unit vectors of the magnetic moments of the and atom, respectively.
A comparison of exchange parameters with and without adsorbate reveals that the cumulative exchange interaction is enhanced around both types of adatoms. Thus, we observe a global exchange stiffening. Figure 13a shows a 3D map of the difference of the site dependent exchange parameter where . The Fe atoms nearest to the adsorbate along [1-10] (-axis) exhibit a stiffening of the exchange interaction, while the exchange interaction along [001] (-axis) gets weaker, but by a smaller amount. The same is shown in Fig. 13c for the Cr adsorbate, where stiffening along [1-10] is weaker and weakening along [001] is more pronounced than for the O adsorbate. The accumulated change in exchange energy amounts to 217 meV (86 meV) for O (Cr) including the contribution of the Cr adatom of meV. Since the exchange energy is increased in total (stiffening), a non-collinear magnetic texture as in the vortex core gains energy, if located away from the adsorbate, eventually leading to vortex core repulsion.
To reveal the interaction profile between adsorbates and vortex core, we employ as obtained from DFT and calculate the exchange energy via with the directions of the magnetic moments set by the micromagnetically simulated vortex core profile. Changing the vortex core position with respect to the adsorbate reveals the interaction potentials as shown for T in Fig. 13b and d. The shape of the two potentials is identical with slightly different amplitude of 12 meV (15.5 meV) for the O (Cr) adatom. This amplitude is still an order of magnitude lower than in the experiment (Fig. 4c, main text).
Nevertheless, assuming the Cr induced interaction potential (Fig. 13d), we simulated a vortex core path for randomly distributed Cr defects with density as in the experiment (Fig 13e). The simulation procedure is identical to the one employed for Fig. 4b of the main text. The resulting core path (green) at T deviates by up to 600 pm from the straight target path (yellow). Such a deviation can be recorded by spin polarized STM and showcases that single adsorbates can alter the vortex path for a core size consisting of Fe atoms.
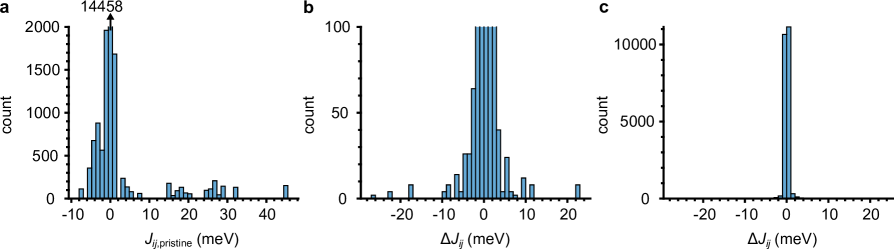
However, the much stronger excursions from the target path observed in the experiment can not be explained by this simulation. One origin of the discrepancy could be different values of than calculated via DFT. Figure 14 shows histograms of the exchange parameter for the Fe atoms of the pristine substrate (Fig. 14a) as well as of the change of the exchange parameters due to adding an O adsorbate (Fig. 14b, c). The changes of are partly as large as itself. They, moreover, exhibit nearly as much reduction as increase of . In line, the accumulated meV amounts to only 10% of the accumulated absolute energy change eV. This showcases that details in the interaction strengths including sign changes can modify the accumulated exchange energy significantly via subtraction of two similarly large numbers.
Other possible origins of the discrepancy are already mentioned in the main text. Firstly, the structural position of the adsorbate might not be correctly described in the DFT calculations again changing in detail. Secondly, the adsorbate might pinpoint to a particular strain field that might originate from the growth procedure and offers preferential adsorption sites.
S11: Supplemental videos
Supplemental video 1 consists of 45 d/d-images recorded at T, while moving the vortex core by 44 equidistant steps with T. These images are also used to determine the core positions shown in Fig. 1f of the main text. Each image covers an area of nm2. Experimentally, pixels are recorded at V, nA and modulation voltage of 50 mVRMS. To optimize visibility, additional interpolated pixels are displayed in the movies. The scan frame center is moved linearly between adjacent images by a vector deduced from centering the core in initial and final image. Supplemental video 2 shows the same data in different color scale and overlaid on a separately measured topography of the whole area. Here, the d/d-images are displayed after subtracting the contrast originating from in-plane magnetization and multiplying the image with a Gaussian intensity profile as described in section II. Additional minor shear and stretch transformations by % are applied to remove the effects of piezo creep.
References
- Parkin et al. (2008) S. S. P. Parkin, M. Hayashi, and L. Thomas, Science 320, 190 (2008).
- Jung et al. (2012) H. Jung, Y.-S. Choi, K.-S. Lee, D.-S. Han, Y.-S. Yu, M.-Y. Im, P. Fischer, and S.-K. Kim, ACS Nano 6, 3712 (2012).
- Fert et al. (2013) A. Fert, V. Cros, and J. Sampaio, Nat. Nanotechnol. 8, 152 (2013).
- Fert et al. (2017) A. Fert, N. Reyren, and V. Cros, Nat. Rev. Mater. 2, 17031 (2017).
- Jiang et al. (2015) W. Jiang, P. Upadhyaya, W. Zhang, G. Yu, M. B. Jungfleisch, F. Y. Fradin, J. E. Pearson, Y. Tserkovnyak, K. L. Wang, O. Heinonen, S. G. E. te Velthuis, and A. Hoffmann, Science 349, 283 (2015).
- Woo et al. (2016) S. Woo, K. Litzius, B. Krüger, M.-Y. Im, L. Caretta, K. Richter, M. Mann, A. Krone, R. M. Reeve, M. Weigand, P. Agrawal, I. Lemesh, M.-A. Mawass, P. Fischer, M. Kläui, and G. S. D. Beach, Nat. Mater. 15, 501 (2016).
- Hanneken et al. (2016) C. Hanneken, A. Kubetzka, K. von Bergmann, and R. Wiesendanger, New J. Phys. 18, 055009 (2016).
- Attané et al. (2001) J. P. Attané, Y. Samson, A. Marty, D. Halley, and C. Beigné, Appl. Phys. Lett. 79, 794 (2001).
- Cowburn et al. (1998) R. P. Cowburn, J. Ferré, S. J. Gray, and J. A. C. Bland, Phys. Rev. B 58, 11507 (1998).
- Burgess et al. (2013) J. A. J. Burgess, A. E. Fraser, F. F. Sani, D. Vick, B. D. Hauer, J. P. Davis, and M. R. Freeman, Science 339, 1051 (2013).
- Holleitner et al. (2004) A. W. Holleitner, H. Knotz, R. C. Myers, A. C. Gossard, and D. D. Awschalom, Appl. Phys. Lett. 85, 5622 (2004).
- Rahm et al. (2004) M. Rahm, J. Stahl, W. Wegscheider, and D. Weiss, Appl. Phys. Lett. 85, 1553 (2004).
- Kläui et al. (2003) M. Kläui, C. A. F. Vaz, J. Rothman, J. A. C. Bland, W. Wernsdorfer, G. Faini, and E. Cambril, Phys. Rev. Lett. 90, 097202 (2003).
- Badea and Berezovsky (2016) R. Badea and J. Berezovsky, Phys. Rev. Appl. 5, 064003 (2016).
- Basith et al. (2012) M. A. Basith, S. McVitie, D. McGrouther, and J. N. Chapman, Appl. Phys. Lett. 100, 232402 (2012).
- Compton and Crowell (2006) R. L. Compton and P. A. Crowell, Phys. Rev. Lett. 97, 137202 (2006).
- Castell-Queralt et al. (2019) J. Castell-Queralt, L. González-Gómez, N. Del-Valle, A. Sanchez, and C. Navau, Nanoscale 11, 12589 (2019).
- Fernandes et al. (2018) I. L. Fernandes, J. Bouaziz, S. Blügel, and S. Lounis, Nat. Commun. 9, 4395 (2018).
- Paul (1982) D. I. Paul, J. Appl. Phys. 53, 1649 (1982).
- Stosic et al. (2017) D. Stosic, T. B. Ludermir, and M. V. Milošević, Phys. Rev. B 96, 214403 (2017).
- Müller and Rosch (2015) J. Müller and A. Rosch, Phys. Rev. B 91, 054410 (2015).
- Vansteenkiste et al. (2008) A. Vansteenkiste, J. D. Baerdemaeker, K. W. Chou, H. Stoll, M. Curcic, T. Tyliszczak, G. Woltersdorf, C. H. Back, G. Schütz, and B. V. Waeyenberge, Phys. Rev. B 77, 144420 (2008).
- Chen et al. (2012) T. Y. Chen, M. J. Erickson, P. A. Crowell, and C. Leighton, Phys. Rev. Lett. 109, 097202 (2012).
- Shinjo (2000) T. Shinjo, Science 289, 930 (2000).
- Wachowiak et al. (2002) A. Wachowiak, J. Wiebe, M. Bode, O. Pietzsch, M. Morgenstern, and R. Wiesendanger, Science 298, 577 (2002).
- Bode et al. (2004) M. Bode, A. Wachowiak, J. Wiebe, A. Kubetzka, M. Morgenstern, and R. Wiesendanger, Appl. Phys. Lett. 84, 948 (2004).
- Bassi et al. (2007) A. L. Bassi, C. S. Casari, D. Cattaneo, F. Donati, S. Foglio, M. Passoni, C. E. Bottani, P. Biagioni, A. Brambilla, M. Finazzi, F. Ciccacci, and L. Duò, Appl. Phys. Lett. 91, 173120 (2007).
- Bode (2003) M. Bode, Rep. Prog. Phys. 66, 523 (2003).
- Mashoff et al. (2009) T. Mashoff, M. Pratzer, and M. Morgenstern, Rev. Sci. Instr. 80, 053702 (2009).
- Guslienko et al. (2001) K. Y. Guslienko, V. Novosad, Y. Otani, H. Shima, and K. Fukamichi, Phys. Rev. B 65, 024414 (2001).
- Romming et al. (2013) N. Romming, C. Hanneken, M. Menzel, J. E. Bickel, B. Wolter, K. von Bergmann, A. Kubetzka, and R. Wiesendanger, Science 341, 636 (2013).
- Romming et al. (2015) N. Romming, A. Kubetzka, C. Hanneken, K. von Bergmann, and R. Wiesendanger, Phys. Rev. Lett. 114, 177203 (2015).
- Ono (1999) T. Ono, Science 284, 468 (1999).
- Sampaio et al. (2013) J. Sampaio, V. Cros, S. Rohart, A. Thiaville, and A. Fert, Nat. Nanotechnol. 8, 839 (2013).
- Lin et al. (2013) S.-Z. Lin, C. Reichhardt, C. D. Batista, and A. Saxena, Phys. Rev. B 87, 214419 (2013).
- Vansteenkiste et al. (2014) A. Vansteenkiste, J. Leliaert, M. Dvornik, M. Helsen, F. Garcia-Sanchez, and B. V. Waeyenberge, AIP Adv. 4, 107133 (2014).
- Hubert and Schäfer (2008) A. Hubert and R. Schäfer, Magnetic Domains: The Analysis of Magnetic Microstructures (Springer, 2008).
- Holl (2018) C. Holl, High frequency STM and spin polarized STM on magnetic vortices, Ph.D. thesis, RWTH Aachen University (2018).
- Papanikolaou et al. (2002) N. Papanikolaou, R. Zeller, and P. H. Dederichs, J. Phys.: Cond. Mat. 14, 2799 (2002).
- Bauer (2014) D. Bauer, Development of a relativistic full-potential first-principles multiple scattering Green function method applied to complex magnetic textures of nano structures at surfaces, Ph.D. thesis, RWTH Aachen University (2014).
- Vosko et al. (1980) S. H. Vosko, L. Wilk, and M. Nusair, Can. J. Phys. 58, 1200 (1980).
- Ossowski and Kiejna (2015) T. Ossowski and A. Kiejna, Surf. Sci. 637-638, 35 (2015).
- Miyano et al. (1986) T. Miyano, Y. Sakisaka, T. Komeda, and M. Onchi, Surf. Sci. 169, 197 (1986).
- Getzlaff et al. (1999) M. Getzlaff, J. Bansmann, and G. Schönhense, J. Magn. Magn. Mater. 192, 458 (1999).
- Eder et al. (2001) M. Eder, K. Terakura, and J. Hafner, Phys. Rev. B 64 (2001), 10.1103/physrevb.64.115426.
- Liechtenstein et al. (1984) A. I. Liechtenstein, M. I. Katsnelson, and V. A. Gubanov, J. Phys. F: Met. Phys. 14, L125 (1984).
- Liechtenstein et al. (1987) A. Liechtenstein, M. Katsnelson, V. Antropov, and V. Gubanov, J. Magn. Magn. Mater. 67, 65 (1987).