A Virgo Environmental Survey Tracing Ionised Gas Emission (VESTIGE).VI. Environmental quenching on HII region scales ††thanks: Based on observations obtained with MegaPrime/MegaCam, a joint project of CFHT and CEA/DAPNIA, at the Canada-French-Hawaii Telescope (CFHT) which is operated by the National Research Council (NRC) of Canada, the Institut National des Sciences de l’Univers of the Centre National de la Recherche Scientifique (CNRS) of France and the University of Hawaii.
Abstract
Context. The Virgo Environmental Survey Tracing Ionised Gas Emission (VESTIGE) is a blind narrow-band H+[NII] imaging survey of the Virgo cluster carried out with MegaCam at the Canada-French-Hawaii telescope (CFHT). We use a new set of data extracted from VESTIGE to study the impact of the hostile cluster environment on the star formation process down to the scale of HII regions ( 50 pc). HII regions are identified and their parameters measured using the HIIphot code on a sample of 114 late-type galaxies spanning a wide range in morphological type (Sa-Sd, Im, BCD), stellar mass (106.5 1011 M⊙), and star formation activity (10-3 10 M⊙ yr-1). Owing to the exquisite average resolution of the VESTIGE data (0.65 arcsec), we detect 11302 HII regions with an H luminosity 1037 erg s-1. We show that the typical number of HII regions in gas-stripped objects is significantly lower than in healthy late-types of similar stellar mass. We also show that in these gas-stripped galaxies the number of HII regions significantly drops outside the effective radius, suggesting that the quenching process occurs outside-in, in agreement with other multifrequency observations. These new results consistently confirm that the main mechanism responsible for the decrease of the star formation activity observed in cluster galaxies is ram pressure, allowing us to discard other milder processes such as starvation or strangulation unable to reproduce the observed radially truncated profiles.
Aims.
Methods.
Results.
Key Words.:
Galaxies: clusters: general; Galaxies: clusters: individual: Virgo; Galaxies: star formation; Galaxies: star cluster: general; ISM: HII regions1 Introduction
Environment plays a major role in shaping galaxy evolution. Clusters of galaxies are mainly composed of early-type systems, while the field is dominated by star forming spirals and irregulars (Dressler 1980). It is also well established that late-type galaxies in clusters are characterised by a lower atomic gas (Cayatte et al. 1990; Solanes et al. 2001; Gavazzi et al. 2005; Chung et al. 2009), molecular gas (Fumagalli et al. 2009, Boselli et al. 2014a), and dust content (Cortese et al. 2010, 2012a) than similar objects in the field. Because they lack gas in its different phases, cluster galaxies also have reduced star formation activity (Lewis et al. 2002; Gomez et al. 2003; Gavazzi et al. 2006; Boselli et al. 2015, 2016). Different mechanisms have been proposed to explain the relative differences in evolution between cluster members and isolated galaxies, as reviewed in Boselli & Gavazzi (2006, 2014). These can be divided into two main families: the gravitational perturbations induced on a galaxy during its interaction with other cluster members or with the potential well of the cluster (tidal interactions, harassment - Merritt 1983, Byrd & Valtonen 1990, Moore et al. 1998), and the dynamical interaction of the galactic ISM with the hot and dense intracluster medium trapped within the potential well of the cluster (ram pressure stripping, thermal evaporation, starvation - Gunn & Gott 1972, Cowie & Songaila 1977, Larson et al. 1980). The identification of the dominant mechanism in high density regions, like clusters and groups, at different epochs is still under debate (Dressler et al. 1997, Poggianti et al. 1999, 2017, Dressler 2004, De Lucia et al. 2012, Muzzin et al. 2014, Boselli et al. 2019a).
These perturbing mechanisms have different effects on the star formation activity and on the quenching process in perturbed galaxies. For example, gravitational perturbations generally induce gas infall in the nuclear regions, thus are expected to increase the activity of star formation toward the nucleus and in the turbulent regions formed during the interaction (Keel et al. 1985, Sun et al. 2007, Patton et al. 2011). On the contrary, milder processes such as the reduced infall of freshly accreted gas all over the disc would uniformly decrease the star formation activity at all galactocentric distances on long time-scales ( 5 Gyr, starvation; Boselli et al. 2006). Finally, ram-pressure stripping, responsible for an outside-in removal of the gas, would produce truncated gaseous and star forming discs on shorter time-scales ( 500 Myr; Vollmer et al. 2004, 2006; Boselli et al. 2006, 2016; Crowl & Kenney 2008; Gullieuszik et al. 2017; Fossati et al. 2018). The effect of these different mechanisms on smaller scales, those of the collapsing giant molecular clouds and of the HII regions where stars are formed, is however totally unknown. A few nearby perturbed galaxies have been studied in detail at high angular resolution with HST. These works have produced some notable results such as the discovery of compact ( 20 pc), young star clusters formed in the perturbed regions of the Antennae (Whitmore et al. 1995), or the presence of filamentary dust structures with associated star forming regions of size 100 pc produced during the stripping of the ISM in the Coma cluster spirals NGC 4921 (Kenney et al. 2015) and D100 (Cramer et al. 2019). The major limitation of these works, however, is that they are limited to a few peculiar objects. There is, indeed, an objective difficulty in observing with a sufficient angular resolution and sensitivity a statistically significant sample of cluster galaxies. For instance, the Virgo cluster, which is the closest massive cluster of galaxies ( 4 1014 M⊙, McLaughlin 1999), is located at 16.5 Mpc (Gavazzi et al. 1999, Mei et al. 2007, Blakeslee et al. 2009); thus for the typical seeing of 2 arcsec of narrow-band H imaging data available on the net (e.g. GOLDmine, Gavazzi et al. 2003), the linear resolution is limited to 150 pc, insufficient to resolve individual HII regions in crowded regions such as spiral arms.
The Virgo Environmental Survey Tracing Ionised Gas Emission (VESTIGE, Boselli et al. 2018) is a new deep blind H narrow-band (NB) imaging survey of the Virgo cluster carried out at the CFHT with MegaCam. Designed to cover the whole Virgo cluster up to its virial radius (104 deg2), this survey is perfectly suited to study the effects of the environment on the star formation process in perturbed galaxies down to scales of 100 pc. Indeed, its blind nature secures the observation of galaxies under the effect of any kind of perturbation, and the use of a NB filter centred on the H emission line, whose emission in star forming galaxies is largely dominated by the radiation of the HII regions surrounding young ( 10 Myr) massive ( 8 M⊙) stars, is an ideal tracer of star formation (e.g. Kennicutt 1998, Boselli et al. 2009). The depth of the survey and the extraordinary high imaging quality make VESTIGE a unique instrument for this purpose. Although the survey is ongoing, the analysis done so far on a representative subsample of objects allows us to make the first statistical study of the environmental quenching process down to the scale of individual HII regions. This letter is aimed at presenting these spectacular results. A complete analysis of the full sample, including the study of the typical scaling relations of HII regions in perturbed and unperturbed galaxies, will be published once the survey will be completed. IFU spectroscopic observations, now mainly limited to unresolved star forming complexes in the tails of stripped material (Fossati et al. 2016, Poggianti et al. 2019), will provide a complementary information for understanding the star formation process in perturbed systems.
2 Observations and data reduction
2.1 Narrow-band imaging data
The VESTIGE observations are carried out using the NB filter MP9603 ( = 6590 Å; = 104 Å) which is optimised for the Virgo cluster galaxies with a typical recessional velocity of -200 3000 km s-1. At this redshift the filter includes the H line and the [NII] doublet.111Hereafter we refer to the H+[NII] band simply as H, unless otherwise stated. The NB filter has a very flat transmissivity profile ( 92%). A detailed description of the observing strategy and of the data reduction procedure is given in Boselli et al. (2018). At present, the survey is 36% complete, with the full depth (where the sensitivity is 4 10-17 erg s-1 cm -2 for point sources (5 )) reached in the central 16 deg2 around M87, and in four independent outer regions 1 deg2 each mapped during pilot observations. Shallower exposures are also available in an annulus of 20 deg2 located around the central region. This low completion rate is due to very poor weather conditions at Mauna Kea in 2018 and 2019. The median seeing is 0.65 arcsec. NB imaging data are at present available for 171 spectroscopically confirmed late-type Virgo cluster members catalogued in the Virgo Cluster Catalogue (VCC, Binggeli et al. 1985).
2.2 HII regions identification
HII regions are identified using the HIIphot data reduction pipeline (Thilker et al. 2000), a code specifically designed to measure the photometric properties of HII regions from NB imaging data. Owing to its quality this code became the reference in the literature for this kind of studies (e.g. Scoville et al. 2001; Helmbolt et al. 2005; Azimul et al. 2011; Lee et al. 2011; Liu et al. 2013). The code runs on the H continuum subtracted, on the H NB, and on the stellar-continuum images and uses a recognition technique through an iterative growing procedure to identify single HII regions and measure their parameters. The stellar continuum image is derived as in Boselli et al. (2019b) from the -band image using a colour correction to take into account the dependence on the spectra shape of the emitting sources (Spector et al. 2012). As extensively described in previous works (e.g. Pleuss et al. 2000; Bradley et al. 2006), the major limitation of HIIphot is that of deriving accurate parameters in crowded regions whenever the seeing is poor and the sensitivity limited. Thanks to the excellent quality of the VESTIGE data we can measure the photometric parameters of HII regions down to 1036 erg s-1 and effective radii222 are the radii of the circles of surface equivalent to the area of the HII regions detected by HIIphot. of 25 pc at the typical distance of the Virgo cluster (16.5 Mpc). To avoid possible systematic effects at these low emission levels, where incompleteness could be important, we limit the present analysis to the HII regions with an H luminosity 1037 erg s-1. For these regions, the typical signal-to-noise is 100 with no dependence on the position of the source with respect to the galactocentric distance. Incompleteness should thus be marginal. We recall, however, that this work is only based on a comparative analysis of gas-rich and HI-stripped cluster galaxies, for which the same limiting H luminosity in the identification of the HII regions is applied, further minimising systematic effects.
We run the HIIphot code on all the late-type galaxies covered during the VESTIGE survey and showing a clumpy emission in the continuum-subtracted H frame witnessing the presence of star forming regions. To limit possible selection biases, however, we restrict the present analysis to objects with sufficiently deep imaging data, i.e. with at least four independent exposures (40 minutes of integration in the NB). We also avoid highly inclined galaxies (axis ratio 0.35) where projection effects or a strong attenuation could induce systematic effects in the determination of the physical parameters of the HII regions. These galaxies span a wide range in morphological type (Sa-Sd, Im, BCD), stellar mass (106.5 1011 M⊙), with a dominance of dwarf systems (62% with 109 M⊙, 10% with 1010 M⊙), and star formation rate (10-3 10 M⊙ yr-1). To avoid any possible contamination from background line emitters ([OII], [OIII], H), the extraction of HII regions is limited within the optical disc of the galaxy.
To identify objects which have been stripped of their gas in the hostile cluster environment we use the HI-deficiency parameter, defined as the difference in logarithmic scale between the expected and the observed HI mass of a galaxy of a given angular size and morphological type (Haynes & Giovanelli 1984). Being the baryonic component least bound to the gravitational potential well of the galaxy, the atomic gas is easily removed in any kind of interaction (Boselli & Gavazzi 2006). As defined, the HI-deficiency parameter is a normalised entity and can be used to quantify the degree of stripping that a galaxy is suffering in the hostile cluster environment. Indeed, the mean HI-deficiency of Virgo cluster members is known to increase towards the inner regions of the cluster (Cayatte et al. 1990, Solanes et al. 2001, Chung et al. 2009, Gavazzi et al. 2013, Boselli et al. 2014b). Consistently with Boselli et al. (2014b), the HI-deficiency of these VCC galaxies has been derived using the HI data available in the GOLDmine database (Gavazzi et al. 2003) using the morphology-dependent calibrations of Boselli & Gavazzi (2009). To have a similar number of normal (gas-rich) and stripped (gas-poor) objects we adopt =0.5 as threshold in the HI-deficiency parameter. This relatively high threshold is indicative of galaxies with a quite low gas content given that the typical dispersion of the HI-deficiency parameter in isolated galaxies is just 0.3. According to these criteria, the total number of galaxies analysed in this work is 114 with 11302 HII regions, divided into 49 gas-rich and 65 gas-deficient objects with 7644 and 3658 HII regions each. Consistent with Boselli et al. (2014b), stellar masses are derived using the Zibetti et al. (2009) colour-dependent relation and a Chabrier IMF, with and magnitudes and -band effective radii taken from Cortese et al. (2012b) when available, otherwise from the EVCC (Kim et al. 2014). Distances for galaxies belonging to the different Virgo cluster subgroups are all taken from Gavazzi et al. (1999), but Virgo cluster A which is assumed at 16.5 Mpc. NB imaging fluxes are corrected for [NII] contamination using the mean values derived from drift scan spectroscopy whenever available (Boselli et al. 2015, Gavazzi et al. 2004, in order of priority), otherwise estimated from the mean [NII]/H vs. scaling relation given in Boselli et al. (2009).
3 Analysis
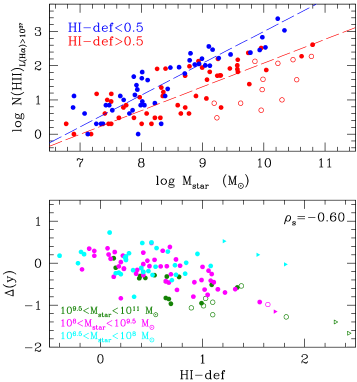
Figure 1 shows the relationship between the number of HII regions of luminosity 1037 erg s-1 and the stellar mass of galaxies. Galaxies are divided into gas-rich objects (blue symbols) and gas-poor, stripped systems (red symbols) according to their HI-deficiency parameter. Figure 1 shows that, in systems with a normal gas content ( 0.5), the number of HII regions of luminosity 1037 erg s-1 increases from 10 in galaxies of stellar mass 107 M⊙ to 103 in spirals of 1010 M⊙. A flatter relation is followed by HI-poor galaxies, which have a similar number of HII regions compared to gas-rich systems at low stellar masses but a significantly lower number of star forming regions at 1010 M⊙ ( 102). The difference in the number of HII regions is even more pronounced in bulge-dominated Sa-Sab systems333These morphological types are lacking in the HI-rich sample. We do not expect that this selection effect can bias the previous conclusion since the calibration of the HI-deficiency parameter has been done separately for each morphological class.. The lower panel of Fig. 1 clearly shows that the residual of this relation ( ) is tightly correlated with the HI-deficiency parameter in particular in massive and intermediate mass systems ( 108 M⊙), thus suggesting that for a given stellar mass the number of star forming regions decreases with the decrease of the atomic gas content.
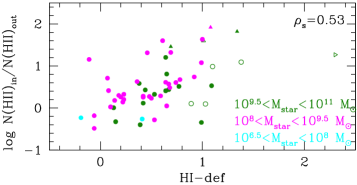
Figure 2 shows the relationship between the ratio of the number of HII regions of luminosity 1037 erg s-1 located within and outside the -band effective radius but over the stellar disc of the galaxy, and the HI-deficiency parameter. To reduce the effects of the low number statistics, this plot is limited to those galaxies having at least 20 HII regions brighter than 1037 erg s-1 (56 objects). Again there is a statistically significant trend between the two variables (Spearman correlation coefficient = 0.60, corresponding to a -value of 1.3 10-5 for the alternative hypothesis of no correlation) indicating that in HI-deficient galaxies the number of HII regions is significantly reduced in the outer galaxy disc with respect to unperturbed systems. The trend is even clearer if bulge-dominated galaxies (Sa-Sab), where the star formation activity might be reduced in the inner regions by the presence of the bulge, are removed. Figure 2 being in logarithmic scale, in HI-deficient objects the number of HII regions in the outer disc drops by a factor of 10 with respect to that in the inner disc.
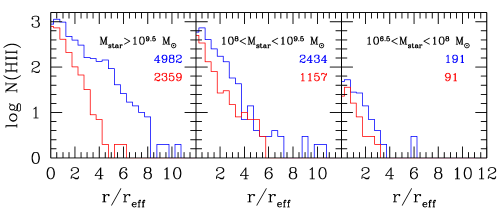
Figure 3 shows the radial distribution of the number of HII regions in units of effective radii for galaxies in different bins of stellar mass. Figure 3 again indicates that the total number of HII regions is systematically lower in HI-stripped than in HI-normal galaxies, in particular in high-mass systems ( 109.5 M⊙), and this despite the number of HI-deficient objects (20) is significantly higher than that of HI-normal galaxies (6). It also shows that, in massive objects, the radial distribution of HII regions decreases more rapidly in HI-deficient than in HI-normal systems. A milder trend is also seen in the intermediate mass range, where several HII regions are present at galactocentric distances 6 only in HI-normal galaxies, while nothing clear is seen in the low-mass range.
4 Discussion
The present set of data allows us to measure for the first time ever the properties of HII regions located within the stellar disc of a statistically significant sample of cluster galaxies. The analysis of this unique set of data shows that the number of HII regions is significantly reduced (more than a factor of ten) in gas-stripped galaxies, and that this occurs preferentially in the outer disc thus indicating an outside-in quenching of the star formation activity of cluster objects. This decrease can hardly be due to the growing importance of the bulge or the presence of bars, which might affect only the star formation activity in the inner regions (Kennicutt et al. 1994, Gavazzi et al. 2015, Consolandi et al. 2017). If overall this result is expected given the physical link between gas content and star formation, it is worth noticing that a tight relation between star formation and gas column density (Schmidt law) is observed mainly when the molecular gas phase is considered (e.g. Bigiel et al. 2008). Furthermore, the HI-deficiency parameter is tightly related to the size of the HI and H2 discs (Vollmer et al. 2001, Boselli et al. 2014a). This global indicator is thus very sensitive to the presence of gas in the outer disc where star formation does not necessarily occur. In other words, the column density of the molecular gas in the inner regions, where star formation takes place, must be somehow related to the total amount of atomic gas available on the HI disc (e.g. Boselli et al. 2001), which in field galaxies generally extends up to 1.8 times the stellar disc (Cayatte et al. 1994).
This new result is consistent with what is observed using integrated quantities (e.g. HI-deficient galaxies located below the main sequence relation, Boselli et al. 2015; HI-deficient galaxies mainly located in the green valley, Boselli et al. 2014a,b; decrease of the specific star formation rate in HI-deficient galaxies, Gavazzi et al. 2013) and with the morphological analysis of the star forming discs of Virgo cluster galaxies (presence of truncated H and UV discs in HI-deficient galaxies, Koopmann & Kenney 1998, Koopmann et al. 2001, Fossati et al. 2012, Boselli et al. 2015, Cortese et al. 2012b; outside-in quenching of the star formation activity, Boselli et al. 2006, Fossati et al. 2018). Compared to these previous studies, the present analysis clearly demonstrates that the reduced star formation activity is related to a reduced number of HII regions in gas-stripped objects, and thus that the perturbing mechanism acts down to scales 100 pc, which is the typical scale of giant molecular clouds. The reduced number of HII regions in HI-deficient galaxies primarily occurring in their outer disc is a further indication that the main quenching process is ram pressure stripping. This mechanism removes the gas necessary to feed star formation outside-in, producing truncated gas discs. Truncated discs are indeed observed in the different components of the ISM that are well resolved at all frequencies in many Virgo cluster galaxies (HI: Cayatte et al. 1990; Chung et al. 2009; H2: Fumagalli et al. 2009, Boselli et al. 2014a; dust: Cortese et al. 2010). The lack of gas in the outer regions thus prevents the formation of new stars. It also rules out milder mechanisms such as starvation or strangulation, where the cessation of gas infall would induce a similar quenching of the star formation activity at all galactocentric distances (Boselli et al. 2006).
The different behaviour in Fig. 3 of dwarfs ( 108 M⊙) vs. massive systems might be ascribed to a joint effect of poor number statistics (30/32 galaxies in this mass range have less than 20 HII regions) and to an inaccurate calibration of the HI-deficiency parameter in the undersampled dwarf galaxy population with HI data in the field (Boselli & Gavazzi 2009) and where the very irregular nature of the galaxies define highly scattered scaling relations. It could also result, however, from the fact that the typical time-scale for gas stripping and quenching of the star formation activity ( 100 Myr), is significantly longer than the life of individual HII regions ( 10 Myr) only in massive systems, while it is comparable in dwarfs where the gas loosely bound to the shallow potential well of the galaxy is rapidly stripped transforming star-forming systems into quiescent dwarf ellipticals (Boselli et al. 2008).
5 Conclusions
The exceptional quality of the VESTIGE survey in terms of angular resolution and sensitivity allow us to attempt the first statistical study on the effects of the environment on the star formation process on cluster galaxies down to the scale of individual HII regions. Using the HIIphot code we detect 11302 HII regions of luminosity 1037 erg s-1 on a sample of 114 late-type galaxies observed so far in the Virgo cluster. We derive the typical scaling relation between the number of HII regions and the stellar mass of the sample galaxies, and we show that those objects stripped of their gas during the interaction with the hostile cluster environment have on average a lower number of HII regions than gas rich systems of similar stellar mass. We also show that in HI-stripped galaxies the number of HII regions is mainly reduced with respect to that of HI-rich systems in the outer discs. These results, consistently with previous results based on the multifrequency analysis of large samples of galaxies or dedicated studies of representative objects, indicate that in a cluster as massive as Virgo the dominant perturbing mechanism responsible for the quenching of the star formation activity is ram pressure stripping. This promising result once again stresses the uniqueness of complete deep surveys of nearby targets for the study of the different mechanisms shaping galaxy evolution.
Acknowledgements.
We thank D. Thilker for providing us with the HIIphot data reduction pipeline and M. Balogh, F. Combes, J. Roediger, J. Taylor, S. Tonnesen, and the referee for constructive comments and suggestions. We are grateful to the CFHT team who assisted us in the observations: T. Burdullis, D. Devost, B. Mahoney, N. Manset, A. Petric, S. Prunet, K. Withington. We acknowledge financial support from ”Programme National de Cosmologie and Galaxies” (PNCG) and from ”Projet International de Coopération Scientifique” (PICS) with Canada. MF has received funding from the European Research Council (ERC) (grant agreement No 757535), AL from the French Centre National d’Etudes Spatiales (CNES).References
- Azimlu et al. (2011) Azimlu, M., Marciniak, R., & Barmby, P. 2011, AJ, 142, 139
- Bigiel et al. (2008) Bigiel, F., Leroy, A., Walter, F., et al. 2008, AJ, 136, 2846
- Binggeli et al. (1985) Binggeli, B., Sandage, A., & Tammann, G. A. 1985, AJ, 90, 1681
- Blakeslee et al. (2009) Blakeslee, J. P., Jordán, A., Mei, S., et al. 2009, ApJ, 694, 556
- (5) Boselli, A., & Gavazzi, G. 2006, PASP, 118, 517
- Boselli, & Gavazzi (2009) Boselli, A., & Gavazzi, G. 2009, A&A, 508, 201
- Boselli & Gavazzi (2014) Boselli, A., & Gavazzi, G. 2014, A&A Rev., 22, 74
- Boselli et al. (2001) Boselli, A., Gavazzi, G., Donas, J., & Scodeggio, M. 2001, AJ, 121, 753
- (9) Boselli, A., Boissier, S., Cortese, L., et al. 2006, ApJ, 651, 811
- (10) Boselli, A., Boissier, S., Cortese, L., & Gavazzi, G. 2008, ApJ, 674, 742
- Boselli et al. (2009) Boselli, A., Boissier, S., Cortese, L., et al. 2009, ApJ, 706, 1527
- Boselli et al. (2014) Boselli, A., Cortese, L., Boquien, M., et al. 2014a, A&A, 564, A67
- Boselli et al. (2014) Boselli, A., Voyer, E., Boissier, S., et al. 2014b, A&A, 570, AA69
- Boselli et al. (2015) Boselli, A., Fossati, M., Gavazzi, G., et al. 2015, A&A, 579, A102
- Boselli et al. (2016) Boselli, A., Roehlly, Y., Fossati, M., et al. 2016, A&A, 596, A11
- Boselli et al. (2018) Boselli, A., Fossati, M., Ferrarese, L., et al. 2018, A&A, 614, A56
- Boselli et al. (2019) Boselli, A., Epinat, B., Contini, T., et al. 2019a, A&A, 631, A114
- Boselli et al. (2019) Boselli, A., Fossati, M., Longobardi, A., et al. 2019b, A&A, 623, A52
- Bradley et al. (2006) Bradley, T. R., Knapen, J. H., Beckman, J. E., & Folkes, S. L. 2006, A&A, 459, L13
- Byrd & Valtonen (1990) Byrd, G., & Valtonen, M. 1990, ApJ, 350, 89
- Cayatte et al. (1990) Cayatte, V., van Gorkom, J. H., Balkowski, C., & Kotanyi, C. 1990, AJ, 100, 604
- Cayatte et al. (1994) Cayatte, V., Kotanyi, C., Balkowski, C., et al. 1994, AJ, 107, 1003
- Chung et al. (2009) Chung, A., van Gorkom, J. H., Kenney, J. D. P., Crowl, H., & Vollmer, B. 2009a, AJ, 138, 1741
- Consolandi et al. (2017) Consolandi, G., Dotti, M., Boselli, A., Gavazzi, G., & Gargiulo, F. 2017, A&A, 598, A114
- Cortese et al. (2010) Cortese, L., Davies, J. I., Pohlen, M., et al. 2010a, A&A, 518, L49
- Cortese et al. (2012) Cortese, L., Ciesla, L., Boselli, A., et al. 2012a, A&A, 540, A52
- Cortese et al. (2012) Cortese, L., Boissier, S., Boselli, A., et al. 2012b, A&A, 544, A101
- Cowie & Songaila (1977) Cowie, L. L., & Songaila, A. 1977, Nature, 266, 501
- Cramer et al. (2019) Cramer, W. J., Kenney, J. D. P., Sun, M., et al. 2019, ApJ, 870, 63
- Crowl & Kenney (2008) Crowl, H. H., & Kenney, J. D. P. 2008, AJ, 136, 1623
- De Lucia et al. (2012) De Lucia, G., Weinmann, S., Poggianti, B. M., et al. 2012, MNRAS, 423, 1277
- Dressler (1980) Dressler, A. 1980, ApJ, 236, 351
- Dressler (2004) Dressler, A. 2004, Clusters of Galaxies: Probes of Cosmological Structure and Galaxy Evolution, 206
- Dressler et al. (1997) Dressler, A., Oemler, A., Jr., Couch, W. J., et al. 1997, ApJ, 490, 577
- Fossati et al. (2012) Fossati, M., Gavazzi, G., Boselli, A., & Fumagalli, M. 2012, A&A, 544, A128
- Fossati et al. (2016) Fossati, M., Fumagalli, M., Boselli, A., et al. 2016, MNRAS, 455, 2028
- Fossati et al. (2018) Fossati, M., Mendel, J. T., Boselli, A., et al. 2018, A&A, 614, A57
- Fumagalli et al. (2009) Fumagalli, M., Krumholz, M. R., Prochaska, J. X., et al. 2009, ApJ, 697, 1811
- Gavazzi et al. (1999) Gavazzi, G., Boselli, A., Scodeggio, M., Pierini, D., & Belsole, E. 1999, MNRAS, 304, 595
- Gavazzi et al. (2003) Gavazzi, G., Boselli, A., Donati, A., Franzetti, P., & Scodeggio, M. 2003, A&A, 400, 451
- Gavazzi et al. (2004) Gavazzi, G., Zaccardo, A., Sanvito, G., Boselli, A., & Bonfanti, C. 2004, A&A, 417, 499
- Gavazzi et al. (2005) Gavazzi, G., Boselli, A., van Driel, W., & O’Neil, K. 2005, A&A, 429, 439
- Gavazzi et al. (2006) Gavazzi, G., Boselli, A., Cortese, L., et al. 2006, A&A, 446, 839
- Gavazzi et al. (2013) Gavazzi, G., Fumagalli, M., Fossati, M., et al. 2013, A&A, 553, A89
- Gavazzi et al. (2015) Gavazzi, G., Consolandi, G., Dotti, M., et al. 2015, A&A, 580, A116
- Gómez et al. (2003) Gómez, P. L., Nichol, R. C., Miller, C. J., et al. 2003, ApJ, 584, 210
- Gullieuszik et al. (2017) Gullieuszik, M., Poggianti, B. M., Moretti, A., et al. 2017, ApJ, 846, 27
- Gunn & Gott (1972) Gunn, J. E., & Gott, J. R., III 1972, ApJ, 176, 1
- Haynes, & Giovanelli (1984) Haynes, M. P., & Giovanelli, R. 1984, AJ, 89, 758
- Helmboldt et al. (2005) Helmboldt, J. F., Walterbos, R. A. M., Bothun, G. D., et al. 2005, ApJ, 630, 824
- Keel et al. (1985) Keel, W. C., Kennicutt, R. C., Hummel, E., et al. 1985, AJ, 90, 708
- Kenney et al. (2015) Kenney, J. D. P., Abramson, A., & Bravo-Alfaro, H. 2015, AJ, 150, 59
- Kennicutt (1998) Kennicutt, R. C., Jr. 1998, ARA&A, 36, 189
- Kennicutt et al. (1994) Kennicutt, R. C., Tamblyn, P., & Congdon, C. E. 1994, ApJ, 435, 22
- Kim et al. (2014) Kim, S., Rey, S.-C., Jerjen, H., et al. 2014, ApJS, 215, 22
- Koopmann, & Kenney (1998) Koopmann, R. A., & Kenney, J. D. P. 1998, ApJ, 497, L75
- Koopmann et al. (2001) Koopmann, R. A., Kenney, J. D. P., & Young, J. 2001, ApJS, 135, 125
- Larson et al. (1980) Larson, R. B., Tinsley, B. M., & Caldwell, C. N. 1980, ApJ, 237, 692
- Lee et al. (2011) Lee, J. H., Hwang, N., & Lee, M. G. 2011, ApJ, 735, 75
- Lewis et al. (2002) Lewis, I., Balogh, M., De Propris, R., et al. 2002, MNRAS, 334, 673
- Liu et al. (2013) Liu, G., Calzetti, D., Kennicutt, R. C., Jr., et al. 2013, ApJ, 772, 27
- McLaughlin (1999) McLaughlin, D. E. 1999, ApJ, 512, L9
- Mei et al. (2007) Mei, S., Blakeslee, J. P., Côté, P., et al. 2007, ApJ, 655, 144
- Merritt (1983) Merritt, D. 1983, ApJ, 264, 24
- Moore et al. (1998) Moore, B., Lake, G., & Katz, N. 1998, ApJ, 495, 139
- Muzzin et al. (2014) Muzzin, A., van der Burg, R. F. J., McGee, S. L., et al. 2014, ApJ, 796, 65
- Patton et al. (2011) Patton, D. R., Ellison, S. L., Simard, L., McConnachie, A. W., & Mendel, J. T. 2011, MNRAS, 412, 591
- Pleuss et al. (2000) Pleuss, P. O., Heller, C. H., & Fricke, K. J. 2000, A&A, 361, 913
- Poggianti et al. (1999) Poggianti, B. M., Smail, I., Dressler, A., et al. 1999, ApJ, 518, 576
- Poggianti et al. (2017) Poggianti, B. M., Moretti, A., Gullieuszik, M., et al. 2017, ApJ, 844, 48
- Poggianti et al. (2019) Poggianti, B. M., Gullieuszik, M., Tonnesen, S., et al. 2019, MNRAS, 482, 4466
- Scoville et al. (2001) Scoville, N. Z., Polletta, M., Ewald, S., et al. 2001, AJ, 122, 3017
- Solanes et al. (2001) Solanes, J. M., Manrique, A., García-Gómez, C., et al. 2001, ApJ, 548, 97
- Spector et al. (2012) Spector, O., Finkelman, I., & Brosch, N. 2012, MNRAS, 419, 2156
- Sun et al. (2007) Sun, M., Donahue, M., & Voit, G. M. 2007, ApJ, 671, 190
- Thilker et al. (2000) Thilker, D. A., Braun, R., & Walterbos, R. A. M. 2000, AJ, 120, 3070
- Vollmer et al. (2001) Vollmer, B., Cayatte, V., Balkowski, C., & Duschl, W. J. 2001, ApJ, 561, 708
- Vollmer et al. (2004) Vollmer, B., Balkowski, C., Cayatte, V., van Driel, W., & Huchtmeier, W. 2004, A&A, 419, 35
- Vollmer et al. (2006) Vollmer, B., Soida, M., Otmianowska-Mazur, K., et al. 2006, A&A, 453, 883
- Zibetti et al. (2009) Zibetti, S., Charlot, S., & Rix, H.-W. 2009, MNRAS, 400, 1181