Simple regularities in the dynamics of online news impact
Abstract
Online news can quickly reach and affect millions of people, yet we do not know yet whether there exist potential dynamical regularities that govern their impact on the public. We use data from two major news outlets, BBC and New York Times, where the number of user comments can be used as a proxy of news impact. We find that the impact dynamics of online news articles does not exhibit popularity patterns found in many other social and information systems. In particular, we find that a simple exponential distribution yields a better fit to the empirical news impact distributions than a power-law distribution. This observation is explained by the lack or limited influence of the otherwise omnipresent rich-get-richer mechanism in the analyzed data. The temporal dynamics of the news impact exhibits a universal exponential decay which allows us to collapse individual news trajectories into an elementary single curve. We also show how daily variations of user activity directly influence the dynamics of the article impact. Our findings challenge the universal applicability of popularity dynamics patterns found in other social contexts.
Introduction
Consider a major news, like the results of the presidential elections or the onset of a global epidemic outbreak. In the 80s, we would have discovered it through traditional print and broadcast media. Today, new media and online platforms have disrupted not only the way we discover and consume information, but also the way we form our opinions and attitudes about critical topics for our society like politics Epstein and Robertson (2015); Aral and Eckles (2019), science Brossard (2013); Iyengar and Massey (2019), and public health Kata (2012); Johnson et al. (2020). Online newspapers and social media platforms are now the majour sources of information about events in the world Stocking (2017) and provide us with rich data for the study of human attention Lazer (2020); Yang et al. (2020). Despite the rise of social media, traditional newspapers and mainstream media are still important information sources with large audiences. The importance of mainstrean news sources can be illustrated by, for example, Facebook temporarily increasing their weight in the internal news ranking system in an attempt to respond to misinformation spreading following the U. S. presidential election.111https://www.theverge.com/2020/11/24/21612728/facebook-news-feed-us-election-change-mainstream-news-misinformation
Most online newspapers allow users to directly comment on news articles Ksiazek (2018), creating a “digital public sphere” where participation is free, recent events are publicly discussed, and comments are visible to everyone Schäfer (2015). In such a complex information ecosystem, some news articles impact thousands of users who actively discuss and share them in online platforms222https://www.nytimes.com/2017/12/20/insider/our-most-commented-on-articles-of-2017.html, whereas many others remain little noticed. Therefore, understanding the dynamics of the impact of online news articles is vital not only because it deepens our understanding of how information spreads throughout modern societies, but also because it can potentially help to counteract negative side effects of new media like the spreading of misinformation Del Vicario et al. (2016); Vosoughi et al. (2018) and the amplification of ideological segregation Flaxman et al. (2016).
The unprecedented availability of big data on human online activity has allowed us to uncover and model patterns of human behavior and cultural products’ popularity in diverse contexts Lazer et al. (2009); Hofman et al. (2017), revealing universal regularities in the dynamics of cultural products as diverse as scientific papers Wang et al. (2013), books Yucesoy et al. (2018), and songs Candia et al. (2019), among others. As for online news articles, previous research has unveiled factors that make an online news article more likely to become popular, including story topic Canter (2013), content emotion Berger and Milkman (2012), perceived objectivity Ksiazek et al. (2016), and format Liu et al. (2015). Yet, we do not know yet whether there exist universal regularities that govern the dynamics of online news articles’ impact. Does the impact of online news articles follow similar patterns as the impact of other types of information items? Is article impact broadly distributed? Are there universal impact patterns for online news articles? How predictable is the dynamics of attention decay for online news articles? To address these questions, we analyze a novel dataset that contains commenting sections of 3,087 articles from the British Broadcasting Corporation (BBC) and a dataset that contains commenting sections of 2,801 articles from the New York Times (NYT).
Previous works have generated insights that generalize well across domains: popularity and impact typically follow heavy-tailed distributions, leading to the emergence of a small number of “hits” Thompson (2018); Barabási (2018) with disproportionate popularity. These successful outliers emerge from a combination of quality (often referred to as fitness) and social amplification mechanisms such as the rich-get-richer phenomenon Medo et al. (2011). These regularities in popularity dynamics have been found to govern the popularity and impact dynamics of cultural items as diverse as scientific papers Medo et al. (2011); Wang et al. (2013), websites Kong et al. (2008), books Yucesoy et al. (2018), and patents Higham et al. (2017, 2019), among others.
Surprisingly, we find none of these regularities in the impact of online news. Differently from the widespread heavy-tailed distributions of popularity and impact in social systems, news impact in terms of the number of received comments) is exponentially distributed. Different categories of news have widely different average comment counts, yet their distributions can be collapsed onto a universal exponential distribution. The exponential impact distribution results from the absence or saturation of the widely-studied preferential attachment mechanism. In line with recent findings on the attention decay in science and technology Higham et al. (2017); Candia et al. (2019), the decay of individual news articles follows a universal exponential form. The impact dynamics of online news articles can be reproduced by a parsimonious model with article-level fitness and exponential aging Golosovsky (2018). Building on this model, we can predict the articles’ long-term impact based on early activity. We study the impact of natural daily variations of user activity on the dynamics of the article impact and formulate a generalized dynamical model which includes the overall level of user activity as an additional factor along with article fitness and an aging term.
Our findings contribute to the literature on popularity dynamics Kong et al. (2008); Medo et al. (2011); Wang et al. (2013); Hofman et al. (2017); Fortunato et al. (2018); Yucesoy et al. (2018) by demonstrating that there is a limit to the generality of widely-observed patterns and mechanisms (such as preferential attachment). While previous studies have emphasized the generality of observed patterns of popularity and impact Candia et al. (2019), future research might put more emphasis on identifying violations of pervasive patterns and the causes behind the observed violations. Besides, as managing and influencing the spreading of online information is vital for online newspapers and social platforms, our models and methods can be used to inform decisions by newspaper editors and content creators.
Results
News impact is exponentially distributed
By writing comments, the users demonstrate a higher level of engagement compared to only reading the article Ksiazek et al. (2016); Ksiazek (2018). Importantly, comments are read also by users who do not actively comment, indicating that they play an important role in how a news article is perceived by the public Barnes (2015). The number of comments can be thus considered as a useful proxy for the article impact Tsagkias et al. (2010). To study the distribution of article impact, we discard potential multiple comments from a single user on a given news, thus counting the number of unique users commenting on each article. When all comments are used instead, the results do not change qualitatively (see Supplementary Information, SI, for the results). We further benefit from the additional category information provided directly by the news outlets for all news; the most populated categories are football (BBC) and national (NYT); see Tab. S1 in SI for details. Since comment counts strongly depend on the category of the news, we analyze news impact individually for each category.
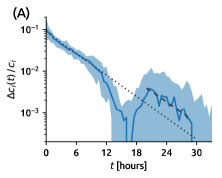
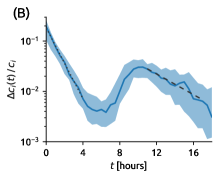
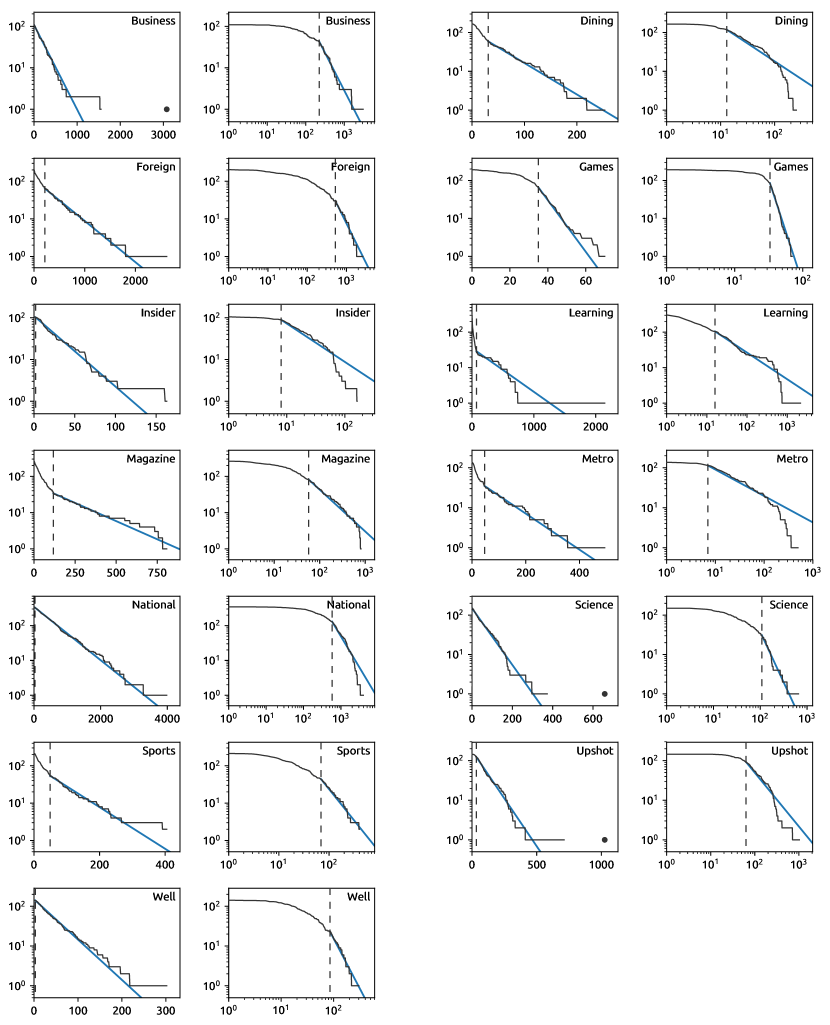
How is the article impact distributed? Impact distributions for creative works are typically found to be heavy-tailed: this is the case for scientific papers Medo et al. (2011), patents Valverde et al. (2007), and books Yucesoy et al. (2018), among others. Broad popularity distributions are also typically found for user-generated content in online systems Cheng et al. (2014). Based on these findings, one might expect that the article impact too follows a heavy-tailed distribution. Surprisingly, we find instead that the distributions exhibit exponential tails for both BBC and NYT data. Using the exponential distribution333Strictly speaking, should be referred to as a geometric distribution as is a discrete variable. for and following the methodology introduced in Clauset et al. (2009), we obtain estimates for the lower bound and the scaling parameter , together with the -value obtained through the Kolmogorov-Smirnov test (see Methods for details).

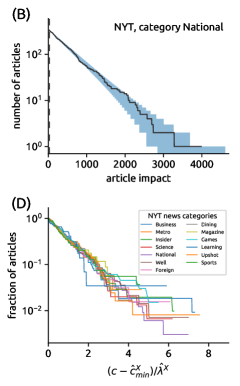
For football BBC news, we find that the exponential tail of the distribution begins at and comprises 284 articles (18% of all football articles). Ignoring a single outler with 3538 comments (see Sec. S2 in SI for information on outlier detection), the estimated scaling parameter is and the high -value of indicates that the exponential distribution cannot be ruled out. The good fit can be visually appreciated by observing that the empirical distribution lies within the 5th–95th percentile range of synthetic exponentially distributed data generated with the estimated parameters (Fig. 1A). For national NYT news, the estimated lower bound is even lower, , and the -value is (Fig. 1C) which again means that an exponential distribution is plausible. Detailed fitting results for all 20 news categories with at least 100 news are shown in SI, Sec. S2. Importantly, the identified exponential tails are substantial, comprising more than 90% of news for 10 out of 20 analyzed news categories. The log-likelihood test Clauset et al. (2009) shows that an exponential distribution fits the data better than a power-law distribution for all categories but one (Learning in the NYT data, see Sec. S2.1 in SI for additional information).
Inspired by the universality of scientific impact distributions Radicchi et al. (2008); Fortunato et al. (2018), we explore an intriguing possibility: By leveraging the estimated parameters, can we collapse the article impact distributions for different categories on top of each other? We find that this is the case: impact distributions in different categories collapse on top of each other after the comment counts are transformed as , where and are the estimated lower bound and the scaling parameter for category .
In summary, we find the impact distributions in individual news categories to be far from being power laws. Simple exponential fits work well in several categories where they describe the impact of a majority of news with remarkable veracity.
The relation between article impact and user degree
The observed article impact distributions, albeit narrower than in many other technosocial systems, still comprise articles that have much greater audience than most other articles. This gives us the possibility to study the relation between impact of an article and degree of the users who have commented on this article. Such a relation can exist if, for example, little active users are mostly idle and comment only on high-impact articles; such a connection would in turn contribute to the high impact of those articles. To assess the level of degree assortativity in the bipartite article-user network, we divide both articles and users in five groups by their degree in such a way that the total degree in each group is approximately the same; groups 1 and 5 have the lowest and the highest degree users/articles, respectively. We then count the numbers of links between respective user and article groups and divide them with the average numbers of links observed in randomized networks. The resulting link propensity quantifies how much more likely (if propensity is above one) or less likely (if propensity is below one) are links between a given user and item group compared to a randomized network. For network randomization, we use the recently introduced Dynamic Configuration Model (DCM, Ren et al. (2018)) which is a version of the classical configuration model for networks that grow in time. The DCM internally divides the network in layers and is a parameter of the model. Due to the quick aging that we observe in the analyzed datasets (see the following sections), we chose the number of layers to be the same as the number of days in each respective dataset (the results are robust with respect to the choice of ). See Medo et al. (2019) for a principled way to determine in a monopartite growing network.
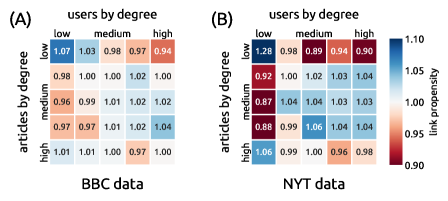
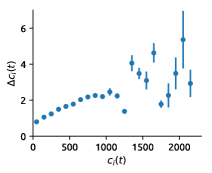
Figure 2 shows that the relative link propensity is close to one for most pairs of user- and article-groups. One emerging pattern shared by the BBC and NYT data concerns the least popular articles which are commented by the least active users more than expected and by the most active users less than expected. By contrast, the original hypothesis of the most popular articles owing their popularity to little active users is ruled out by the results. For the BBC data, the relative link propensity between the most popular articles and the least active users does not differ significantly from one. For the NYT data, it is only 1.06 which means that the most popular articles do not receive 20% of their comments from the group of least active users who write 20% of all comments but which is a negligible increase. We can conclude that the most popular articles receive comments from users of all degree values approximately in line with expectations.
Preferential attachment plays a minor role in the dynamics of impact
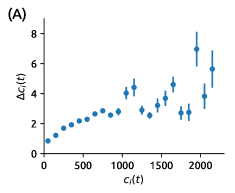
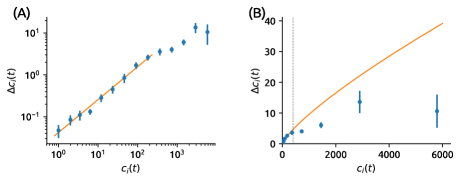
The empirical exponential distributions of article impact inevitably lead us to investigate possible mechanisms behind their emergence. Motivated by existing results on the dynamics of impact for cultural products as diverse as scientific papers Medo et al. (2011); Wang et al. (2013), patents Higham et al. (2017), and bestseller books Yucesoy et al. (2018), one expects two main forces shaping the dynamics of news impact Candia et al. (2019): preferential attachment and temporal decay. We start by addressing preferential attachment which implies that the rate at which article receives new comments, where , is a power-law function (most commonly, a linear function) of the number of already-received comments, .
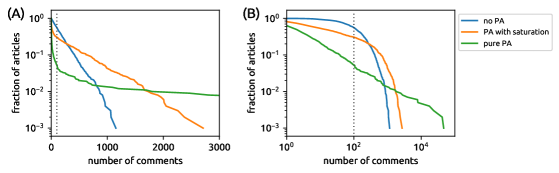
In contrast with pervasive findings in the popularity dynamics literature, we find that preferential attachment is negligible in the BBC data (Fig. 3A) and exhibits clear sub-linearity and saturation for the NYT data (Fig. 3B). More specifically, in the BBC data, more than 200 comments are needed for an article to double its commenting rate with respect to a comment-free article. Furthermore, the observed weak growth of with can be explained in terms of a dynamic model where no preferential attachment is present (see Fig. S9 in SI). In the NYT data, first grows as a power of with an exponent below one (sub-linear preferential attachment Krapivsky et al. (2000), see Fig. S10 in SI) and becomes independent of for . The lack of/saturation of preferential attachment has important consequences as it prevents a power-law degree distribution from emerging (see Section on modeling the article impact dynamics and Sec. S4 in SI). In summary, we find that despite the articles’ comment counts explicitly reported by both BBC and NYT (see Fig. S1 in SI), the impact of preferential attachment on the dynamics of news article impact is limited.
The dynamics of article impact follows an exponential decay
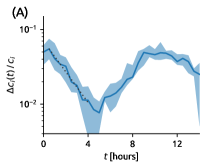
Existing studies have found various functional forms for the decay of the impact of cultural items, including power-law Crane and Sornette (2008), log-normal Wang et al. (2013); Yucesoy et al. (2018), exponential Parolo et al. (2015); Higham et al. (2017), stretched exponential Wu and Huberman (2007), and biexponential Candia et al. (2019). To quantify the temporal decay of article impact, for each news , we measure the news’ number of new comments relative to the article’s final comment count, , as a function of the article age, . The normalization by the article’s final comment count makes the dynamics of articles of different ultimate impact directly comparable.444This normalization is also motivated by the observation that under negligible preferential attachment, is expected to accurately capture the aging function of the articles, as shown in the next section. For each age, , we compute the median of over all considered articles, obtaining the representative decay function, . We restrict the analysis to hit articles which, for the purpose of this work, are defined as the articles whose number of comments is above the 90th percentile (679 and 428 comments in BBC and NYT, respectively). To suppress the time-of-day effects, we include only the BBC articles that appeared in the morning between 9am and noon—the 10 hour range shown in Fig. 4A is thus a period when user activity is rather uniform at the BBC website. User activity is substantially lower in the night, which directly effects the evolution of (see Sec. S3 in SI for more details). For the same reasons, we focus on the NYT articles that appeared between 2pm and 5pm GMT.
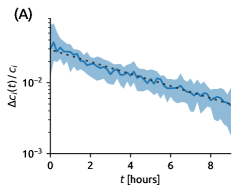
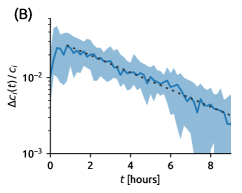
We find that the articles’ temporal decay follows a universal exponential form (Figs. 4). In particular, the average decay function can be accurately fitted by an exponential function: where for BBC and for NYT. While decreases exponentially in the BBC data during the whole observed range, it shows a short period (approximately 1 hour) of increase in the NYT data. This is a direct consequence of the preferential attachment that applies for low comment counts—as the number of comments grows, the rate of commenting initially accelerates before aging in combination with sublinear/saturated preferential attachment eventually cause the rate of commenting to decrease.
Our finding of a regular exponential decay of article impact agrees with the report of real news on Twitter differing from rumors by exhibiting a regular pattern of a monotonous decrease of attention Kwon et al. (2013). The observed exponential aging can be explained by a simple model where each article is of interest to a fixed pool of readers (the pool’s size is determined by the article’s attractiveness to the readers) and every reader has a fixed probability to write their comment (most readers comment in a discussion only once) per time unit Ishii et al. (2012). The observed exponential decay can be also interpreted as a limit scenario of the bi-exponential impact decay predicted by a recent work based on a model with communication memory and cultural memory Candia et al. (2019). The reason why such a limit scenario holds for online news needs to be clarified by future research. A plausible hypothesis is that as the comments to online news articles unfold over a narrow time period following a news, we cannot use them to observe the process whereby the communication memory associated with an article is converted into cultural memory. If this is the case, the model in Candia et al. (2019) predicts an exponential decay of collective attention, in line with our observed decay functions.
Exponentially-distributed fitness and exponential aging shape the dynamics of article impact
The impact dynamics for scientific papers Medo et al. (2011); Wang et al. (2013) and bestseller books Yucesoy et al. (2018) is typically modeled in terms of preferential attachment, fitness and aging. Building on these studies, a potential model for the commenting dynamics would assume that the expected rate at which article receives new comments at time is
| (1) |
where is the preferential attachment factor, is the fitness factor, denotes an article-dependent aging function, and is the appearance time of article . In line with previous studies Medo et al. (2011); Wang et al. (2013), article fitness is a hidden intrinsic parameter that quantifies, other factors being equal, how a given article is attractive to the website’s audience. We refer to this model as the PFA model because it includes Preferential attachment, Fitness and Aging. In this model, a narrow exponential distribution of article fitness, , leads to the emergence of a power-law distribution of the comment count Medo et al. (2011). In other words, small differences in items’ fitness are amplified by preferential attachment and produce wide impact inequalities.

The observed weak preferential attachment and exponential temporal decay suggest a simpler model of the dynamics of article impact where only article fitness and exponential aging play a role. We thus assume that the rate at which article receives new comments at time is
| (2) |
which we refer as the FA (Fitness-Aging) model Golosovsky (2018). To accurately represent the commenting dynamics, we introduce individual aging timescales and the aging factor in the form . The aging timescales are estimated from the empirical data by minimizing the Kolmogorov-Smirnov statistic between the comment count dynamics in the model and in the empirical data (see Sec. S6 in SI). If , the expected final comment count under the FA model is directly proportional to the product of the article fitness and the aging timescale, (see Sec. S5 in SI). The model further implies that
| (3) |
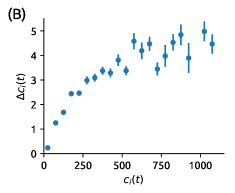
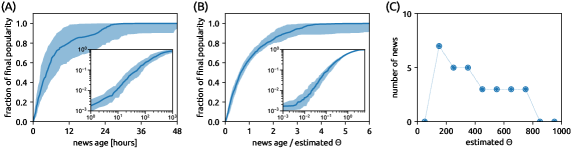
Motivated by this result, we measure the dynamics of the comment count normalized by the final comment count. We find that Eq. (3) captures the empirical dynamics remarkably well (Fig. 5) and allows us to collapse all article trajectories onto a universal curve (Figure 5). This result demonstrates that the fitness-aging model captures the two essential factors that govern the dynamics of news article impact, and it further confirms that preferential attachment plays a negligible role in the emergence of hit articles.
Since , exponentially distributed leads to the emergence of an exponential comment count distribution in line with the empirical data. When the aging timescales vary relatively little among the articles, as is the case here, the distribution of article fitness alone is approximately exponential. Interestingly, an exponential distribution of (referred to as total relevance therein) was reported in Medo et al. (2011) for scientific papers and an exponential distribution of (in a model without aging) was reported in Kong et al. (2008) for pages of the World Wide Web. To identify theoretical mechanisms behind this widespread emergence of exponentially distributed fitness of items remains an important future challenge.
Early activity can be used to predict article impact
The regular dynamics demonstrated by Fig. 5 suggests that the early commenting activity and the final article impact are highly correlated. To verify this conjecture, we study a classification problem where we aim to predict whether an article will become a hit (i.e., if it will belong to the 90th percentile by the final impact). We classify an article as positive if it belongs to the 90th percentile by the number of comments that it has attracted over the first minutes, and negative otherwise. We evaluate the classifier using precision and AUC which are both classical information retrieval metrics Manning et al. (2008) that range from zero (the worst result) to one (the best result). We find that the proposed simple classifier exhibits high values of precision and AUC even when is short: precision exceeds 0.6 after five minutes, for example (see Table 1 for full results).
The observed predictability is unsurprising given previous results on the correlation between early and late popularity of online content Szabo and Huberman (2010); Cheng et al. (2014); Shulman et al. (2016). However, previous studies interpreted the early-stage predictability of the virality of online cascades as a possible manifestation of cumulative advantage Shulman et al. (2016). This cannot be the case here for online news where we demonstrated that preferential attachment has a negligible effect. Taken together, our findings suggest a somewhat simpler scenario: the news that are highly attractive for the public tend to receive more connections throughout their whole lifetime than less attractive news. In this sense, the impact of online news might be seen as more “meritocratic” than that of content in systems with preferential attachment: The news with truly high fitness are those that eventually succeed, regardless of cumulative advantage effects.
| BBC data | NYT data | |||
|---|---|---|---|---|
| 1 | 0.33 | 0.69 | 0.31 | 0.62 |
| 2 | 0.51 | 0.81 | 0.51 | 0.75 |
| 5 | 0.60 | 0.87 | 0.64 | 0.89 |
| 10 | 0.63 | 0.89 | 0.73 | 0.92 |
| 60 | 0.69 | 0.92 | 0.81 | 0.96 |
| 240 | 0.77 | 0.94 | 0.83 | 0.98 |
| 1200 | 0.93 | 0.99 | 0.95 | 0.99 |
Circadian patterns of user activity patterns shape the dynamics of news impact
To study the impact dynamics, we have until now focused specifically on “morning” articles that benefit from high and approximately constant user activity for more than ten hours after their publication. We now turn our attention to the effect of overall user activity, which naturally decreases in the night (see Fig. S7 in SI), on the dynamics of article impact. Figure 6A shows the evolution of the median number of new comments for the same set of morning articles over a longer period. This allows us to observe a decrease of commenting activity in the night (age 12–18 hours) and renewed exponential decay on the second day (age 20–29 hours) with the timescale of 312 minutes. The two fitted exponential decay timescales, 302 minutes for article age 0–10 hours555The minor difference with respect to Figure 4 where the fitted timescale is 305 minutes is due to the use of wider bins in Figure 6A in order to improve the statistics for high article age. and 312 minutes for article age 20–29 hours are remarkably close to each other. We see that after user activity recommences after a night, article aging continues in the same speed than before the night.
Figure 6B shows the evolution of the median number of new comments for evening hit articles (articles published between 9 pm and midnight). We see again two phases of exponential decay: an early phase during the night (age up to 4 hours) with the timescale of 74 minutes and a late phase during the day (age 11–17 hours) with the timescale 254 minutes. Albeit having a somewhat shorter timescale, the late phase is a direct equivalent of the previously observed aging of morning articles. We thus see that morning and evening articles exhibit similar aging during the day.
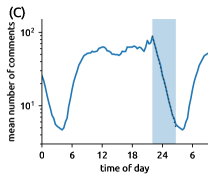
On the other hand, the early night aging of evening articles has a timescale which is significantly shorter than the aging timescle observed during the day. To better understand this fast aging, Figure 6C shows the average overall activity on the BBC Sport website. We see that after an approximately constant activity during the day (from 8 am until 8 pm) and a small peak in the evening (from 8 pm until 10 pm) when many sport events take place, user activity dramatically decreases after 10 pm. Moreover, the user activity decay during the first five hours of the decrease (from 10 pm until 3 am) is a nearly perfect exponential with the fitted timescale of 97 minutes. Varying user activity can be included in the previously introduced FA model described by Eq. (2) by introducing it as an additional multiplicative factor, thus obtaining an FAA (Fitness-Aging-Activity) model. The rate at which article receives new comments at time then reads
| (4) |
where and are the appearance time and fitness of article , respectively, and is the overall activity factor which is common to all articles at the platform. If we now assume that article appears when user activity, , decreases exponentially, we obtain
where and are the article and user exponential decay timescales, respectively. The two exponential terms can be combined in one as
where the joint exponential timescale, , has the form
| (5) |
Using the fitted values and , we obtain which is in an excellent agreement with the fitted aging timescale 74 minutes of evening articles during the night. Results are qualitatively similar for the NYT data (see Sec. S7 in SI). We can thus conclude that the FAA model given by Eq. (4) presents an effective way of combining article dynamics with circadian and other patterns of varying user activity.
Discussion
By analyzing data on the comments to online news articles in two major nationwide newspapers, we were able to uncover surprising empirical regularities that characterize the distribution of the impact of online news articles and the impact dynamics. In particular, we revealed two universal patterns: (1) For both newspapers, the distribution of the number of comments received by articles from various categories collapse onto a universal exponential curve and (2) the dynamics of the comment count of different news articles collapse onto a universal curve once appropriate rescaling is applied. The exponential impact distribution emerges from impact dynamics where preferential attachment plays a negligible role. This indicates that differently from other social systems Salganik et al. (2006); Wu and Huberman (2007), popularity signals in online newspapers are not prominent enough to play a significant role. Main empirical dynamical patterns of article impact can be reproduced with a minimal model which combines article fitness, an aging term (which in our case has an exponential form), and overall user activity. When user activity is approximately constant, only article impact and aging remain and the resulting dynamics is particularly simple.
Our findings contrast with the previous literature on success and popularity that has emphasized that success and popularity are usually characterized by heavy-tailed distributions Kong et al. (2008); Radicchi et al. (2008); Cheng et al. (2014); Broido and Clauset (2019), and that preferential attachment plays a key role in shaping the emergence of hits Kong et al. (2008); Medo et al. (2011); Wang et al. (2013); Yucesoy et al. (2018). Additional research is needed to quantify the relative importance of different factors that trigger user engagement in a news article (i.e., which article attributes contribute to its fitness Berger and Milkman (2012); Bandari et al. (2012)), and how our findings generalize to different cultures and platforms in languages other than English.
We quantified the impact of a news article through the number of comments it received from the online newspaper’s readers. Other metrics of impact might be also relevant to news outlets. For example, the overall impact of a news can be quantified as a combination of the impact on the readers of the newspaper and the impact on users who shared or commented the news in different social media and news aggregation platforms. Uncovering the regularities of the news articles’ dynamics by incorporating data from social media and news aggregators is an important direction for future research, given the critical role of these platforms for news dissemination Hermida et al. (2012); Dellarocas et al. (2015).
Although our study focused on news outlets that only include verified news (BBC and NYT), our findings can inspire future studies related to the spreading of misinformation in online systems Del Vicario et al. (2016); Vosoughi et al. (2018). Our results could serve as baselines in future studies that consider the commenting dynamics of both verified and false news. Do false news trigger different patterns of impact compared to true news? Is the diffusion of false and true news governed by different fundamental mechanisms? Understanding which mechanisms play a major role in engaging users and triggering their comments might suggest intervention strategies to prevent their impact.
The collected BBC data contain several other characteristics that have not been included in the present study: comment length, comment text, as well as the number of up-votes and down-votes for each comment. Their analysis can yield further patterns in article commenting. Of particular interest is the interplay between comment sentiment and the discussion activity is of particular interest. Do positive or controversial comments help fuel the discussion? Do early emotionally loaded comments influence the long-term tone of the discussion? Which factors contribute to users approval or disapproval of a comment? Such studies can help us understand how we discuss online and how to make these discussions more construcitve.
Methods
Empirical datatasets
We regularly crawled the sport section of the BBC website (its front page and the pages dedicated to individual sports) and collected the found news articles with commenting sections. From October 1, 2018 to June 30, 2019, we collected 3,087 articles that received 852,400 comments from 67,527 readers. Each article is assigned to a sport category. The most populated categories are Football (1590 articles), Rugby Union (439 articles), Cricket (240 articles), Tennis (162 articles), Formula 1 (139 articles), Golf (123 articles) and Boxing (103 articles). Each comment is time-stamped with the time resolution of one minute. BBC typically closes commenting on the second midnight after the article has been published; most of them are therefore open for 24–48 hours.
We complement the unique BBC dataset with a dataset containing articles with commenting sections from the New York Times (NYT).666Data obtained from https://www.kaggle.com/aashita/nyt-comments. From January 1, 2017 to May 30, 2017, there are 2,801 articles that received 649,794 comments from 75,118 readers. Also here, each article is assigned to a category. Unlike for BBC, sport articles are a minority in the NYT data: The most populated categories are National (348 articles), Learning (306 articles), Magazine (262 articles), Sports (213 articles) and Foreign (204 articles). Each comment is time-stamped with the time resolution of one minute. While some comments arrive long after the articles are published, the median time after which the hit articles (90th percentile by the comment count) receive 99% of their comments is less than 26 hours. To study the article impact dynamics, we thus focus on the first 26 hours of article age (the final article impact is nevertheless determined using all data). See Supplementary Information, Section S1, for detailed information about the datasets.
Fitting the comment count distributions
The maximum likelihood estimate (MLE) of the scaling parameter of the exponential distribution is known to be the sample mean, . As can be seen from Figure 1, the comment count distribution follows an exponential form starting from some lower bound . The MLE estimate then changes to where the summation is over for which and is the number of comment counts that match or exceed the lower bound. We assess the estimate uncertainty using non-parametric bootstrap—standard deviation of the MLE estimates is evaluated for 10,000 bootstrap realizations of the comment count data.
To determine , we follow the approach suggested by Clauset et al. (2009): We choose that minimizes the difference between the comment count distribution and the fitted exponential distribution as measured by the standard Kolmogorov-Smirnov statistic which has the form
| (6) |
where and are the cumulative distributions for the comment counts and the fitted exponential distribution, respectively. When the weighted Kolmogorov-Smirnov statistic Clauset et al. (2009) is used, which puts more weight on tails of the distributions, results do not change qualitatively. This further suggests that our fitting procedure and the conclusions drawn from the results are robust.
The next step is to test the hypothesis that the observed comment counts indeed follow an exponential distribution. We follow again Clauset et al. (2009) where the authors suggest to use the fitted parameters to generate synthetic exponentially distributed datasets, fit each of those datasets as described above, and finally calculate the -value as the fraction of synthetic datasets whose resulting exceeds that obtained for the real data.
To finally compare the statistical evidence for an exponential distribution with that for a power-law distribution, we do the same analysis for fitting a power-law distribution. Since the input data are discrete, the MLE cannot be given in a closed form Clauset et al. (2009), we numerically maximize the log-likelihood
| (7) |
A detailed comparison between fitting exponential and power-law distribution to the commenting data, including the log-likelihood test which directly compares the likelihood that the analyzed data has been drawn from the exponential or the power-law distribution, is presented in Sec. S2 in SI.
Abbreviations
BBC: British Broadcasting Corporation
NYT: New York Times
SI: Supplementary Information
DCM: Dynamic Configuration Model
PFA: Preferential Attachment-Fitness-Aging (model)
FA: Fitness-Aging (model)
AUC: Area Under the receiver operating Characteristic
FAA: Fitness-Aging-Activity (model)
MLE: Maximum Likelihood Estimate
Availability of data and materials
Upon publication of the manuscript, the BBC commenting data and scripts to reproduce the results presented here will be made available at https://github.com/8medom/Article-Impact.
Acknowledgements.
This work is supported by the National Natural Science Foundation of China (Grant Nos. 11622538, 61673150, 11850410444). MSM acknowledges financial support from the URPP Social Networks at the University of Zurich, the Swiss National Science Foundation (Grant No. 200021-182659), and the UESTC professor research start-up (Grant No. ZYGX2018KYQD215). LL acknowledges the Science Strength Promotion Programme of UESTC. We thank Patrick Park for stimulating discussions.References
- Epstein and Robertson (2015) R. Epstein and R. E. Robertson, Proceedings of the National Academy of Sciences 112, E4512 (2015).
- Aral and Eckles (2019) S. Aral and D. Eckles, Science 365, 858 (2019).
- Brossard (2013) D. Brossard, Proceedings of the National Academy of Sciences 110, 14096 (2013).
- Iyengar and Massey (2019) S. Iyengar and D. S. Massey, Proceedings of the National Academy of Sciences 116, 7656 (2019).
- Kata (2012) A. Kata, Vaccine 30, 3778 (2012).
- Johnson et al. (2020) N. F. Johnson, N. Velásquez, N. J. Restrepo, R. Leahy, N. Gabriel, S. El Oud, M. Zheng, P. Manrique, S. Wuchty, and Y. Lupu, Nature 582, 230 (2020).
- Stocking (2017) G. Stocking, Pew Research Center, August 7 (2017).
- Lazer (2020) D. Lazer, Proceedings of the National Academy of Sciences 117, 21 (2020).
- Yang et al. (2020) T. Yang, S. Majo-Vazquez, R. K. Nielsen, and S. González-Bailón, Available at SSRN 3564826 (2020).
- Ksiazek (2018) T. B. Ksiazek, Journalism Studies 19, 650 (2018).
- Schäfer (2015) M. S. Schäfer, in The International Encyclopedia of Political Communication, edited by G. Mazzoleni (Wiley Online Library, 2015) pp. 1–7.
- Del Vicario et al. (2016) M. Del Vicario, A. Bessi, F. Zollo, F. Petroni, A. Scala, G. Caldarelli, H. E. Stanley, and W. Quattrociocchi, Proceedings of the National Academy of Sciences 113, 554 (2016).
- Vosoughi et al. (2018) S. Vosoughi, D. Roy, and S. Aral, Science 359, 1146 (2018).
- Flaxman et al. (2016) S. Flaxman, S. Goel, and J. M. Rao, Public Opinion Quarterly 80, 298 (2016).
- Lazer et al. (2009) D. Lazer, A. Pentland, L. Adamic, S. Aral, A.-L. Barabási, D. Brewer, N. Christakis, N. Contractor, J. Fowler, M. Gutmann, et al., Science 323, 721 (2009).
- Hofman et al. (2017) J. M. Hofman, A. Sharma, and D. J. Watts, Science 355, 486 (2017).
- Wang et al. (2013) D. Wang, C. Song, and A.-L. Barabási, Science 342, 127 (2013).
- Yucesoy et al. (2018) B. Yucesoy, X. Wang, J. Huang, and A.-L. Barabási, EPJ Data Science 7, 7 (2018).
- Candia et al. (2019) C. Candia, C. Jara-Figueroa, C. Rodriguez-Sickert, A.-L. Barabási, and C. A. Hidalgo, Nature Human Behaviour 3, 82 (2019).
- Canter (2013) L. Canter, Journalism Practice 7, 604 (2013).
- Berger and Milkman (2012) J. Berger and K. L. Milkman, Journal of Marketing Research 49, 192 (2012).
- Ksiazek et al. (2016) T. B. Ksiazek, L. Peer, and K. Lessard, New Media & Society 18, 502 (2016).
- Liu et al. (2015) Q. Liu, M. Zhou, and X. Zhao, Information & Management 52, 764 (2015).
- Thompson (2018) D. Thompson, Hit Makers (HarperCollins Brasil, 2018).
- Barabási (2018) A.-L. Barabási, The Formula: The Universal Laws of Success (Hachette UK, 2018).
- Medo et al. (2011) M. Medo, G. Cimini, and S. Gualdi, Physical Review Letters 107, 238701 (2011).
- Kong et al. (2008) J. S. Kong, N. Sarshar, and V. P. Roychowdhury, Proceedings of the National Academy of Sciences 105, 13724 (2008).
- Higham et al. (2017) K. W. Higham, M. Governale, A. Jaffe, and U. Zülicke, Physical Review E 95, 042309 (2017).
- Higham et al. (2019) K. W. Higham, M. Governale, A. Jaffe, and U. Zülicke, Physical Review E 99, 060301 (2019).
- Golosovsky (2018) M. Golosovsky, Physical Review E 97, 062310 (2018).
- Fortunato et al. (2018) S. Fortunato, C. T. Bergstrom, K. Börner, J. A. Evans, D. Helbing, S. Milojević, A. M. Petersen, F. Radicchi, R. Sinatra, B. Uzzi, et al., Science 359, eaao0185 (2018).
- Barnes (2015) R. Barnes, New Media & Society 17, 810 (2015).
- Tsagkias et al. (2010) M. Tsagkias, W. Weerkamp, and M. De Rijke, in European Conference on Information Retrieval (Springer, 2010) pp. 191–203.
- Valverde et al. (2007) S. Valverde, R. V. Solé, M. A. Bedau, and N. Packard, Physical Review E 76, 056118 (2007).
- Cheng et al. (2014) J. Cheng, L. Adamic, P. A. Dow, J. M. Kleinberg, and J. Leskovec, in Proceedings of the 23rd International Conference on World Wide Web (ACM, 2014) pp. 925–936.
- Clauset et al. (2009) A. Clauset, C. R. Shalizi, and M. E. Newman, SIAM Review 51, 661 (2009).
- Radicchi et al. (2008) F. Radicchi, S. Fortunato, and C. Castellano, Proceedings of the National Academy of Sciences 105, 17268 (2008).
- Ren et al. (2018) Z.-M. Ren, M. S. Mariani, Y.-C. Zhang, and M. Medo, Physical Review E 97, 052311 (2018).
- Medo et al. (2019) M. Medo, A. Zeng, Y.-C. Zhang, and M. S. Mariani, New Journal of Physics 21, 093066 (2019).
- Krapivsky et al. (2000) P. L. Krapivsky, S. Redner, and F. Leyvraz, Physical Review Letters 85, 4629 (2000).
- Crane and Sornette (2008) R. Crane and D. Sornette, Proceedings of the National Academy of Sciences 105, 15649 (2008).
- Parolo et al. (2015) P. D. B. Parolo, R. K. Pan, R. Ghosh, B. A. Huberman, K. Kaski, and S. Fortunato, Journal of Informetrics 9, 734 (2015).
- Wu and Huberman (2007) F. Wu and B. A. Huberman, Proceedings of the National Academy of Sciences 104, 17599 (2007).
- Kwon et al. (2013) S. Kwon, M. Cha, K. Jung, W. Chen, and Y. Wang, in 2013 IEEE 13th International Conference on Data Mining (IEEE, 2013) pp. 1103–1108.
- Ishii et al. (2012) A. Ishii, H. Arakaki, N. Matsuda, S. Umemura, T. Urushidani, N. Yamagata, and N. Yoshida, New Journal of Physics 14, 063018 (2012).
- Manning et al. (2008) C. Manning, P. Raghavan, and H. Schütze, Introduction to information retrieval (Cambridge University Press, 2008).
- Szabo and Huberman (2010) G. Szabo and B. A. Huberman, Communications of the ACM 53, 80 (2010).
- Shulman et al. (2016) B. Shulman, A. Sharma, and D. Cosley, in Tenth International AAAI Conference on Web and Social Media (2016).
- Salganik et al. (2006) M. J. Salganik, P. S. Dodds, and D. J. Watts, Science 311, 854 (2006).
- Broido and Clauset (2019) A. D. Broido and A. Clauset, Nature Communications 10, 1017 (2019).
- Bandari et al. (2012) R. Bandari, S. Asur, and B. A. Huberman, in Sixth International AAAI Conference on Weblogs and Social Media (2012).
- Hermida et al. (2012) A. Hermida, F. Fletcher, D. Korell, and D. Logan, Journalism Studies 13, 815 (2012).
- Dellarocas et al. (2015) C. Dellarocas, J. Sutanto, M. Calin, and E. Palme, Management Science 62, 2543 (2015).
- Vuong (1989) Q. H. Vuong, Econometrica: Journal of the Econometric Society , 307 (1989).
Supporting Information
S1 Data description
S1.1 The BBC article discussion data
We collected a comprehensive dataset of sport news articles with discussions by periodically crawling the BBC Sport website (its front page and the pages dedicated to individual sports). In the time period from October 1, 2018 until June 30, 2019 (273 days), there were 3,087 article discussions open that received 852,400 comments from 67,527 users. The user median and mean number of comments are 2 and 12.6, respectively. The median and mean number of comments of a news article are 155 and 276, respectively. We measure the news article impact by the number of unique users who left a comment in its discussion. The median and mean article impact are 108 and 180, respectively.
Each comment is time-stamped with the time resolution of one minute. BBC typically closes discussions on the second midnight after the corresponding news article has been published; most of them are therefore open for 24–48 hours. There are two exceptions in the dataset: one discussion that has been open marginally longer than 48 hours and another discussion that was open for 13 days; it attracted only a few comments after day two, though.
S1.2 The NYT article discussion data
We further support our findings using the New York Times (NYT) commenting data obtained from https://www.kaggle.com/aashita/nyt-comments. Our NYT dataset comprises articles published in January–May 2017. At the NYT, it is possible to comment on a previously written comment (in fact, several levels of response are possible). To measure the article impact, we consider only the top-level comments; responses to comments are neglected as they are driven by the comments to which the responses are made. There are 2,801 articles and 649,794 comments from 75,118 users. The user median and mean number of comments are 1 and 6.0, respectively. The median and mean number of comments of a news article are 38 and 165, respectively. We measure the news article impact by the number of unique users who left a comment in its a discussion. The median and mean article impact are 37 and 143, respectively.
Each comment is time-stamped with the time resolution of one minute. Unlike the BBC data, article discussions at the NYT remain open for long time. Despite this, the article commenting activity decays quickly and the median time to reach 99% of the final comment count is approximately 26 hours (taking into account the hit articles whose comment count is above the 90th percentile).
| Category | Articles | Mean comment count | Mean number of unique users (impact) |
|---|---|---|---|
| Football | 1590 | 361 | 236 |
| Rugby Union | 439 | 219 | 130 |
| Cricket | 240 | 213 | 133 |
| Tennis | 162 | 157 | 108 |
| Formula 1 | 139 | 338 | 209 |
| Golf | 123 | 117 | 85 |
| Boxing | 103 | 195 | 152 |
| National | 348 | 678 | 563 |
| Learning | 306 | 59 | 52 |
| Magazine | 262 | 77 | 72 |
| Sports | 213 | 48 | 45 |
| Foreign | 204 | 277 | 241 |
| Games | 192 | 31 | 29 |
| Dining | 166 | 40 | 39 |
| Science | 151 | 68 | 64 |
| Upshot | 146 | 124 | 115 |
| Well | 142 | 47 | 45 |
| Metro | 137 | 53 | 48 |
| Business | 109 | 269 | 239 |
| Insider | 105 | 28 | 27 |
| Rank | Impact | Category | News title |
|---|---|---|---|
| 1 | 3538 | football | Jose Mourinho: Manchester United sack manager |
| 2 | 2241 | football | Liverpool 4-0 Barcelona (4-3 agg): Jurgen Klopp’s side complete extraordinary comeback |
| 3 | 1931 | football | Chris Hughton: Brighton sack manager after 17th-placed finish in Premier League |
| 4 | 1874 | football | Ajax 2-3 Tottenham (3-3 on aggregate - Spurs win on away goals): Lucas Moura scores dramatic winner |
| 5 | 1697 | football | Champions League: PSG 1-3 Man Utd (agg: 3-3) |
| 6 | 1659 | football | Manchester City 4-3 Tottenham Hotspur (4-4 agg): Spurs stun City on away goals in modern classic |
| 7 | 1575 | football | Liverpool, Tottenham, Chelsea and Arsenal fans criticise Uefa for final ticket numbers |
| 8 | 1417 | football | Ole Gunnar Solskjaer was the wrong choice as Man Utd manager - Jenas |
| 9 | 1342 | tennis | Andy Murray: Australian Open could be last tournament |
| 10 | 1291 | football | Liverpool beat Spurs 2-0 to win Champions League final in Madrid |
| 1 | 3983 | national | Trump Intensifies Criticism of F.B.I. and Journalists |
| 2 | 3277 | national | Trump Fires Comey Amid Russia Inquiry |
| 3 | 3077 | business | Man Is Dragged From a Full Jet, Stirring a Furor |
| 4 | 2731 | national | G.O.P. Revolt Sinks Bid to Void Health Law |
| 5 | 2692 | national | Judge Blocks Trump Order On Refugees |
| 6 | 2618 | foreign | Trump Is Said to Expose Ally’s Secrets to Russians |
| 7 | 2572 | national | Britain Furious as Trump Pushes Claim of Spying |
| 8 | 2388 | national | Trump Was Told of Claims Russia Has Damaging Details on Him |
| 9 | 2327 | national | Trump Appealed to Comey to Halt Inquiry Into Aide |
| 10 | 2304 | national | Trump Fires Justice Chief Who Defied Him |
BBC:

NYT:
S2 Fitting exponential distributions to article impact data
The primary fitting results for the BBC data are shown in Table 4 where article impact is measured by the number of unique users who comment on a news article. Since a minority of comments are discarded in this way, the fitting results are qualitatively similar when the total number of comments is used instead. Our fitting procedure follows the steps described in Clauset et al. (2009): We choose the lower bound, , that minimizes the standard Kolmogorov-Smirnov statistic. The scaling parameter is then obtained by maximizing the data likelihood for the exponential model. The standard error of this estimate is then obtained by taking the standard deviation of scaling parameters estimated in bootstrap samples of the original data. Finally, the -values characterizing the goodness-of-fit are obtained by comparing the corresponding Kolmogorov-Smirnov statistic measured on the real data with the Kolmogorov-Smirnov statistic measured on data drawn from the exponential distribution with the previously determined lower bound (which directly influences the sample size represented by the number of article discussions that match or exceed ) and the scaling parameter . Upon generating a large number of exponentially distributed samples, the -value is the fraction of the samples that have a higher Kolmogorov-Smirnov statistic than the value found in the real data. A low -value is thus an indication that the artificial exponentially-distributed samples match the fitted exponential distribution better then the real data. -values above 0.10 are conventionally understood as an indication that the fit is good. Needless to say, the -values are jointly influenced by the quality of fit and the sample size. As the sample size grows, the same deviation from the exponential distribution results in progressively lower -values.
| Category | -value | ||||||
|---|---|---|---|---|---|---|---|
| Boxing | 103 | 0 | 6 | 0.98 | 0.041 | 0.97 | |
| Cricket | 240 | 0 | 38 | 0.90 | 0.043 | 0.58 | |
| Football | 1,590 | 1 | 381 | 0.18 | 0.026 | 0.96 | |
| Formula 1 | 139 | 0 | 42 | 0.94 | 0.052 | 0.69 | |
| Golf | 123 | 0 | 1 | 1.00 | 0.082 | 0.13 | |
| Rugby-union | 439 | 0 | 13 | 0.97 | 0.033 | 0.49 | |
| Tennis | 162 | 1 | 97 | 0.32 | 0.044 | 1.00 |
A single outlier—a news article with 3538 unique users contributing to the discussion—has been identified for the football category in the BBC data. When this news is included in the fitting procedure described above, we obtain and . The probability that the value of at least 3538 is observed in a single draw from the exponential distribution with these parameters is . With 1577 independent draws from the distribution, corresponding to 1577 news that pass the impact threshold , the probability that at least one of them has impact 3538 or more is . In other words, this single observation is very unlikely given the fitted exponential distribution which indicates that it is an outlier. The situation is similar in the tennis category where a single news with impact 1342 has probability to emerge for the fitted parameters and (unlike Table 4, these results correspond to fitting all data including the outlier). In all other categories, the largest impact value has probability more than to be observed.
Interestingly, the two identified outliers transcendent the sport boundaries which could help them reach the outstanding impact. The football category outlier is the news “Jose Mourinho: Manchester United sack manager” concerning a successful yet controversial coach and the tennis category outlier is the news “Andy Murray: Australian Open could be last tournament” concerning the potential end of career of the British most successful tennis player in the modern history.

The same fitting analysis using power-law distributions shows that they yield worse fit of the data than exponential distributions. This can be visually appreciated in Figure S2 which shows the dependence of estimated parameters on the fitting lower bound, . While the estimated scaling parameter of the exponential distribution, , varies in the narrow range , estimated exponent of the power-law distribution, , continually grows with from an extremely low value of 1.2 to more than five and shows no plateau. The higher stability of as compared to is a sign that the exponential fits are more robust (less sensitive to the choice of , in particular). Finally, the smallest Kolmogorov-Smirnov statistic for a power-law fit of the most populated football category news yields , so the power-law spans over less than one order of magnitude unlike other broadly distributed datasets Clauset et al. (2009).
| Power-law fit | Likelihood ratio test | |||||
|---|---|---|---|---|---|---|
| Category | -value | |||||
| Boxing | 233 | 0.24 | 0.054 | 3.75 | 13.5 | |
| Cricket | 147 | 0.32 | 0.057 | 3.11 | 38.2 | |
| Football | 638 | 0.07 | 0.068 | 4.18 | 64.2 | |
| Formula1 | 141 | 0.58 | 0.081 | 2.54 | 29.4 | |
| Golf | 83 | 0.33 | 0.059 | 2.64 | 11.3 | |
| Rugby union | 279 | 0.12 | 0.065 | 4.03 | 36.4 | |
| Tennis | 189 | 0.17 | 0.076 | 3.15 | 14.1 | |
Table 5 further reports detailed results of fitting with power-law distributions. We see that the lower bounds obtained for power-law fits are substantially higher than the corresponding values for exponential fits, which shows that exponential distributions fit greater portions of respective datasets. The Kolmogorov-Smirnov statistic values obtained with exponential fits are lower than those obtained with power-law fits, indicating better match between the data and the fitted distributions. We conclude the assessment of power-law and exponential fits by a direct comparison between the exponential and power-law distribution in terms of how well they fit the data (to allow for a fair comparison, we do not exclude any outliers here as that would put the power-law hypothesis in a disadvantage). This can be done using the log-likelihood test described in Clauset et al. (2009). As can be seen in Table , the normalized log likelihood ratio Vuong (1989), , favors the exponential distribution for all analyzed news categories and the corresponding -values show that the obtained values are highly significant (-values and less).
Finally, Figure S3 visually compares exponential and power-law fit for all news categories. While two categories—Golf and Rugby Union—display an excess of high-impact news, those high-impact news are fewer than ten in both cases, so they do not suffice to turn around the likelihood ratio test. The piece-wise linear shape of the distributions for Football and Tennis suggests that their fits could be improved by using a combination of two exponentials with different scale parameters, corresponding to two different classes of news mixed in the same category. Interestingly, the same pattern can be seen also for some NYT news categories in Figure S5 (categories Dining and Foreign, for example). This suggests the hypothesis that while a homogeneous news category is well fitted with a single exponential, a mixture of two exponential distributions may be more appropriate for a heterogeneous news category. Further work is needed to explore such possible fine structure of news categories.
| Category | -value | ||||||
|---|---|---|---|---|---|---|---|
| Business | 109 | 1 | 0 | 0.99 | 0.064 | 0.52 | |
| Dining | 166 | 0 | 31 | 0.36 | 0.068 | 0.80 | |
| Foreign | 204 | 0 | 214 | 0.31 | 0.060 | 0.91 | |
| Games | 192 | 0 | 35 | 0.34 | 0.056 | 0.95 | |
| Insider | 105 | 0 | 2 | 0.97 | 0.081 | 0.22 | |
| Learning | 306 | 0 | 72 | 0.09 | 0.148 | 0.27 | |
| Magazine | 262 | 0 | 118 | 0.13 | 0.071 | 0.97 | |
| Metro | 137 | 0 | 47 | 0.26 | 0.083 | 0.86 | |
| National | 348 | 0 | 28 | 0.97 | 0.037 | 0.53 | |
| Science | 151 | 1 | 0 | 0.99 | 0.049 | 0.63 | |
| Sports | 213 | 0 | 49 | 0.25 | 0.081 | 0.65 | |
| Upshot | 146 | 1 | 34 | 0.84 | 0.062 | 0.47 | |
| Well | 142 | 0 | 3 | 0.99 | 0.050 | 0.65 |
We applied the same steps to the NYT data where the article impact is measured by the number of unique commenting users at the top commenting level (see Section S1 for details), focusing on the 13 news categories with at least 100 news. Table 6 summarizes the results of exponential fitting, showing that the exponential distribution again cannot be ruled out for any news category, albeit now there are two categories—Learning and Magazine—where only a small fraction of news belong to the exponential tail and the best Kolmogorov-Smirnov statistic for Learning news is high (0.148). Figure S4 illustrates the stability of the scaling parameter estimate over a broad range of the lower fitting bound, , whereas the estimated power-law exponents substantially grows with . Finally, Table 7 summarizes results of power-law fits and likelihood ratio tests for individual article categories. Category Learning is confirmed here as the only one for which the exponential fit is worse than the power-law fit (normalized log likelihood ratio, , is significantly negative; see Sec. S2.1 for more information on this category). For the remaining 12 categories, exponential fits are much more apt than power-law fits. Figure S5 visually compares exponential and power-law fit for all news categories.

| Power-law fit | Likelihood ratio test | |||||
|---|---|---|---|---|---|---|
| Category | -value | |||||
| Business | 224 | 0.39 | 0.086 | 2.82 | 9.7 | 0 |
| Dining | 13 | 0.71 | 0.095 | 1.92 | 13.2 | 0 |
| Foreign | 521 | 0.15 | 0.100 | 3.11 | 6.2 | 0 |
| Games | 33 | 0.44 | 0.063 | 6.48 | 31.5 | 0 |
| Insider | 8 | 0.85 | 0.101 | 1.92 | 10.5 | 0 |
| Learning | 16 | 0.34 | 0.074 | 1.75 | 0 | |
| Magazine | 57 | 0.31 | 0.070 | 2.15 | 4.8 | 0 |
| Metro | 7 | 0.83 | 0.095 | 1.66 | 4.9 | 0 |
| National | 580 | 0.37 | 0.081 | 2.80 | 24.4 | 0 |
| Science | 108 | 0.21 | 0.115 | 3.56 | 12.0 | 0 |
| Sports | 69 | 0.21 | 0.069 | 2.68 | 8.1 | 0 |
| Upshot | 63 | 0.64 | 0.084 | 2.36 | 22.2 | 0 |
| Well | 85 | 0.16 | 0.087 | 3.52 | 14.3 | 0 |
S2.1 Specifics of the category “Learning” in the NYT data
The Learning category has a particularly uneven impact distribution: While the median impact over its 306 news is only 7, there are 23 news with impact above 100 and the top impact is 2,344. Nevertheless, it turns out that the Learning category actually does not contain news but a mixed bag of content. Among the 23 news with impact above 100, there are 17 contest articles “What’s Going On in This Picture?” (published on a weekly basis) with the median impact of 505 and the top impact article is yet another contest.777https://www.nytimes.com/2017/04/05/learning/our-eighth-annual-found-poem-student-contest.html By contrast, little impact Learning articles are “teaching and learning resources based on New York Times journalism” made available under the name “Learning Network”.888See https://www.nytimes.com/2017/04/18/learning/what-does-a-presidents-choice-of-pet-or-choice-not-to-have-a-pet-at-all-say-about-him.html for an example.
S3 Elementary analysis of the system’s dynamics
We present here basic characteristics of the commenting dynamics in the BBC and the NYT data: the daily and hourly profiles of user activity and the distributions of user activity (Figures S6–S8).
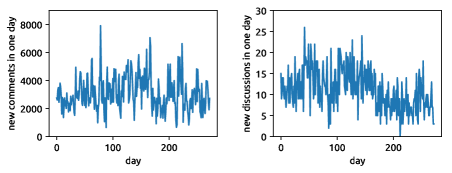

(Top row, BBC data) There are 3,109 new comments a day on average, the standard deviation is 1,215. There are 11.3 new article discussions a day on average, the standard deviation is 4.8.
(Bottom row, NYT data) There are 3,007 new comments a day on average, the standard deviation is 1,347. There are 18.4 new article discussions a day on average, the standard deviation is 8.2.

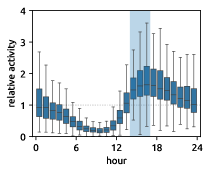
(Left, BBC data) The activity is low from 1am to 6am and relatively constant between 8am and midnight. The shaded area shows the time of day that we use for the analysis of the commenting dynamics: These articles have a long period of approximately uniform website activity before the night arrives and the activity drops.
(Right, NYT data) Due to the time difference, the commenting activity is lower between 5am and noon. The shaded area again shows the “morning articles” that are used for the analysis of new dynamics.

(Top, BBC data) The indicative dashed lines have the slopes of and , respectively.
(Bottom, NYT data) The indicative dashed lines have the slopes of and , respectively.
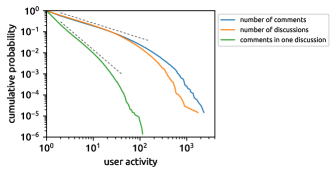
All three distributions have an initial power-law part with a cut-off at higher activity values.
S4 Preferential attachment in measurements and models
Figure 2A in the main text shows that preferential attachment is extremely weak in the BBC data with the linear fit for in the form followed by saturation for higher values. We add that a similar weak dependence of on can be observed in synthetic data where preferential attachment is absent. To demonstrate this, we use the model described in Section S5 which produces a synthetic dataset whose basic properties are similar to those of the BBC dataset. The measurement of preferential attachmed identical with the one used in the main text yields similar results as those in Figure 3A (see Figure S9) and a similar fit . The observed weak growth of with is thus an artifact of the commenting dynamics produced by the model. In particular, articles with high final degree (comment count) initially increase their fast, so their high values contribute to the initial low bins for a short time. By contrast, articles with low final degree remain during their whole lifetime in low bins where they contribute with their low values and hence cause the average values to be lower in low bins that they are in high bins.
We claim in the main text that preferential attachment with saturation fails to produce a power-law degree distribution from exponentially distributed fitness values. This can be illustrated using the synthetic data model from Section S5 where the rate at which an article receives new comments (number of new comments per minute) at time is assumed to be
| (S1) |
where is the fitness of article , is the degree-dependence term depending on the current number of comments, , and is an aging term. We assume that article fitness is exponentially distributed, for . The distribution’s scale, , determines the resulting average comment count. Motivated by Figure 4 in the main text, we assume exponential aging, where is the appearance time of article and is the aging timescale. For the degree-dependence term, we use three different choices. Firstly, degree-independent growth given by . As shown in Sec. S5 and confirmed in Figure S11, the degree distribution is then exponential. Secondly, standard preferential attachment given by (the addition of one is necessary as the initial comment count of all articles is zero). As shown in Medo et al. (2011) and confirmed by the results in Figure S11, exponentially distributed fitness combined with preferential attachment produces a power-law degree distribution. Finally, preferential attachment with saturation given by for and for . As shown in Figure S11, the degree distribution then appears to be a power law (straight in the log-log scale) until and then follows a clear exponential course for larger . The importance of the saturation threshold is natural as the emergence of a power-law degree distribution is a direct consequence of the interplay between the exponential fitness distribution and preferential attachment. Since preferential attachment is absent above the saturation threshold, an exponential degree distribution emerges for large comment counts in the same way as it emerges for all comment counts when preferential attachment is absent entirely [i.e., when ].
S5 Modeling the dynamics of news impact
Based on the results presented in the main text, we see that the article commenting dynamics is influenced by two principal factors:
-
1.
Absence of preferential attachment,
-
2.
Exponential aging,
-
3.
Overall user activity at the website.
We assume for the moment that the overall user activity remains stable during the modeling period. A generalized model which accounts for varying user activity, as discussed in the last section of the main text, is presented in Eq. (4) in the main text. We further assume that exogeneous factors such as the article position on the BBC Sport website (on the front page or not, at the top of a page or not, and so forth—see Figure S1 or https://www.bbc.com/sport for examples). While article position might seem like an important factor, Figure S12 shows that commenting dynamics of high-impact articles does not display abrupt changes that could correspond to changes of each article’s position. We thus neglect article position at the website which, in any case, is not contained in the collected data.

The factors 1 and 2 in the list above correspond to the expected number of new comments in the form
| (S2) |
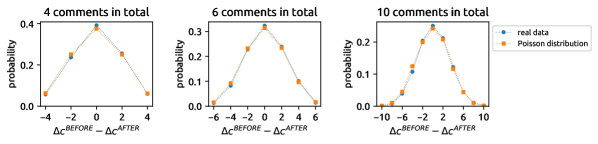
where is the number of comments of article at time , is the fitness of article which reflects how attractive it is to the users, is the time when the news article was published (and its discussion opened, ), and finally is the article’s aging timescale. The actual number of new comments is drawn from the Poisson distribution with mean given by Eq. (S2). This choice is motivated by independent actions of the users. In Figure S13, we illustrate that the Poisson distribution is indeed a good approximation by studying the number of new comments that article discussions receive in two consecutive time windows. The results are grouped by the total number of comments an article discussion receives in the two time windows and we plot the difference of the number of comments between the two time windows. This distribution is then compared with the distribution of differences observed when the comments counts are drawn from a Poisson distribution. As can be seen in the figure, the empirical distributions are indeed similar with the distributions produced by Poisson-distributed comment counts.
The discrete model given by Eq. (S2) combined with draws from the Poisson distribution can be replaced with the continuous modeling using the differential equation
| (S3) |
with the initial condition . This is referred to as the Fitness-Aging (FA) model in the main text. A similar model was proposed in Golosovsky (2018) which explores the relation between fitness and preferential attachment. Eq. (S3) is easy to solve and yields
| (S4) |
with the limit value . In the absence of preferential attachment, the final impact of an article is directly proportional to its fitness and aging timescale. Although we found sub-linear preferential attachment in the NYT data, Figure 5B in the main text shows that Eq. (S4) mathces the impact dynamics in the NYT data well despite being derived assuming that preferential attachment is absent.
The generalized form of Eq. (S3) is
| (S5) |
where is a preferential attachment term. Standard preferential attachment is represented with where is an additive term which is necessary as all articles have initially . Non-linear preferential attachment is represented with, for example, . Preferential attachment with saturation is represented with a piece-wise function of . The resulting distribution of article impact for various choices of is studied in Section S4 where we show that when the preferential attachment dependence in has a cut-off, the tail of the impact distribution has the same distribution as . This contrasts with the results presented in Medo et al. (2011) where the authors show that exponentially distributed fitness combined with preferential attachment gives rise to a power-law degree distribution.
S6 Estimating individual aging timescales
Note that we assume an individual aging timescale, , for each article. One can ask whether this generalization is really necessary, if universal aging timescale would not yield a similar level of agreement between the model and the empirical data. We illustrate this in Figures S14 and S15 below where the left panels use real time on the axes and the middle panels use rescaled time on the axes. The aging timescales are estimated by minimizing the Kolmogorov-Smirnov statistic between the real course of and the theoretically expected curve given by Eq. (S4). For the BBC data, the lowest mean KS is achieved with the universal timescale of 300 minutes which agrees with the timescale obtained by fitting the aging curve in Figure 4A in the main text; the mean KS static is then 0.18 and 9 articles (out of the 39 used to obtain the figure) have the KS statistic below 0.1. With individually estimated timescales, the mean Kolmogorov-Smirnov statistic reduces by the factor of two to 0.08 and 34 articles have the KS statistic below 0.1. For the NYT data, the lowest mean KS is achieved with the universal timescale of 330 minutes; the mean KS is then 0.27 and 5 article discussions out of 46 have the KS statistic below 0.1 (the values are 0.29 and 4 for the timescale 230 obtained by fitting the aging curve in Figure 4B in the main text). With individually estimated timescales, the mean KS reduces to 0.12 and 30 articles have the KS statistic below 0.1. The improvement achieved by using Eq. (S5) which includes preferential attachment is minor both in terms of the mean KS as well as the number of articles with KS below 0.1. To summarize, the commenting dynamics described by Eq. (S4) fits the empirical data well even when some limited effects of preferential attachment can be observed in the NYT data (as shown in Figure 3B in the main text).

S7 Interplay between exponential aging and circadian user activity patterns for the NYT data
Since the overall user activity varies in the NYT data in a similar way as it does in the BBC data, its impact on article impact dynamics can be studied analogously to the section “Interplay between exponential aging and circadian user activity patterns” in the main text where results for the BBC data are presented. While the aging timescale of morning articles in the NYT data is (see Figure 4B in the main text), Figure S16A shows that the aging timescale is significantly shorter, 126 minutes, for evening articles. Figure S16B shows that the overall user activity decays in the with the fitted timescale of . Using Eq. (5) from the main text, the corresponding joint timescale is
which is close to the actual fitted aging time scale of evening articles, 126 minutes.
Note that the NYT data are less suitable for this analysis than the BBC data for two main reasons. Firstly, evening user activity decay is piece-wise with the first slower part between 11 pm and 4 am and the second faster part between 4 am and 9 am (we use GMT). This is probably due to the large geographical size of USA which mainly covers four time zones (from the east coast to the west coast). In our analysis, we use the more pronounced second part when, however, the overall user activity is low which makes our statistical estimates more noisy. Secondly, as many articles appear on BBC Sport in the evening, Figure 6B in the main text is built on data from 56 evening hit articles. By contrast, the analogous Figure S16A uses only 13 NYT hit articles that appear in the evening which makes statistical estimates less precise. Thirdly, daily variations are greater in the BBC data (as measured by the ratio between the maximal and minimal user activity during the day, for example) which makes this dataset more suitable for analyzing the impact of daily variations on the dynamics of article impact.