NuSTAR and Parkes observations of the transitional millisecond pulsar binary XSS J12270-4859 in the rotation-powered state
Abstract
We report on the first NuSTAR observation of the transitional millisecond pulsar binary XSS J12270-4859 during its current rotation-powered state, complemented with a 2.5 yr-long radio monitoring at Parkes telescope and archival XMM-Newton and Swift X-ray and optical data. The radio pulsar is mainly detected at 1.4 GHz displaying eclipses over of the 6.91 h orbital cycle. We derive a new updated radio ephemeris to study the 3-79 keV light curve that displays a significant orbital modulation with fractional amplitude of 28, a structured maximum centred at the inferior conjunction of the pulsar and no cycle-to-cycle or low-high-flaring mode variabilities. The average X-ray spectrum, extending up to 70 keV without a spectral break, is well described by a simple power-law with photon index giving a 3-79 keV luminosity of , for a distance of 1.37 kpc. Energy resolved orbital light curves reveal that the modulation is not energy dependent from 3 keV to 25 keV and is undetected with an upper limit of 10 above 25 keV. Comparison with previous X-ray XMM-Newton observations in common energy ranges confirms that the modulation amplitudes vary on timescales of a few months, indicative of a non-stationary contribution of the intrabinary shock formed by the colliding winds of the pulsar and the companion. A more detailed inspection of energy resolved modulations than previously reported gives hints of a mild softening at superior conjunction of the pulsar below 3 keV, likely due to the contribution of the thermal emission from the neutron star. The intrabinary shock emission, if extending into the MeV range, would be energetically capable alone to irradiate the donor star.
keywords:
Binaries: close – Stars: individual: XSS J12270-4859 (aka 1FGL J1227.9-4852, 2FGL J1227.7-4853, 3FGL J1227.9-4854, PSR J1227-4853) – gamma-rays: stars- X-rays: binaries - Stars: pulsars1 Introduction
Millisecond pulsars (MSPs) are old neutron stars (NSs) in close binary systems which were spun-up to very short periods during a previous Gyr-long phase of mass accretion from an evolved companion. According to the recycling scenario (Alpar et al., 1982; Backer et al., 1982) during the accretion phase, MSP binaries were Low-Mass X-ray Binaries (LMXBs) and turned into radio and Gamma-ray pulsars when mass accretion ceased. The first evidence of a transition between the two states was discovered in the radio MSP binary PSR J1023+0038 that was found in an accretion disc-state between 2001-2004 (Archibald et al., 2009) and entered again in a LMXB state in 2013 (Stappers et al., 2014; Patruno et al., 2014; Bogdanov et al., 2015). Similar transitions were also observed in IGR J1825-2452, in the M28 globular cluster (Papitto et al., 2013) and in the galactic field X-ray source XSS J12270-4859 (henceforth J1227) (Bassa et al., 2014; Bogdanov et al., 2014; de Martino et al., 2014). The transitions occured on timescales much shorter than secular evolution, likely controlled by variations in the mass transfer rate from the late-type companion. These three systems, dubbed transitional MSPs (tMSPs), harbour non-degenerate companions in tight (5-12 h) orbits and fall in the increasing class of redbacks (RB) (14 confirmed so far with ) as opposed to those dubbed black widows (BW) containing degenerate companions with (Roberts et al., 2015; Strader et al., 2019).
Transitional systems are enigmatic and complex binaries. During the LMXB state they display peculiar behaviour from radio, optical up to X-ray and Gamma-rays (de Martino et al., 2010, 2013; Archibald et al., 2015; Papitto et al., 2015; Ambrosino et al., 2017; Bogdanov et al., 2018; Papitto et al., 2019). Only IGR J1825-2452 displayed an outburst (Papitto et al., 2013), while the other two were never recorded in such state. When in the disc-state, tMSPs are characterised by a subluminous X-ray emission () with high, low and flare “modes” (Linares, 2014). In IGR J1825-2452 and PSR J1023+0038, the X-ray low-modes were found to be accompained by radio flares in quasi-simultaneous observations (Ferrigno et al., 2014; Bogdanov et al., 2018), possibly due to outflowing material. Additionally, the presence of X-ray pulses during high X-ray modes in PSRJ1023+0038 (Archibald et al., 2015) and J1227 (Papitto et al., 2015) was interpreted as signature of accretion onto the NS. This interpretation is challenged by the detection of optical pulsations (Ambrosino et al., 2017) that cannot be ascribed to accretion. The optical and X-ray pulsations were recently detected simultaneously during the X-ray high modes (Papitto et al., 2019). Instead, during flares lower amplitude optical pulses were also detected but not in the X-rays.
A variety of interpretation have been proposed for the complex behaviour during the LMXB state: an enshrouded pulsar (Coti Zelati et al., 2014; Takata et al., 2014), a pulsar in a propeller state (Papitto et al., 2014; Papitto & Torres, 2015), an intermittent propellering radio pulsar (Ertan, 2017) or a low accretion rate pulsar from a trapped disc near corotation (D’Angelo & Spruit, 2012) (see also Campana & Di Salvo (2018), for a review). Whether the disc shocks with a striped pulsar wind at a few light cylinder radii away from the pulsar, giving rise synchrotron emission producing the optical and X-ray pulses, is a challenging intepretion put forward by Papitto et al. (2019) (see also Veledina et al., 2019; Campana et al., 2019).
In the rotation-powered (RMSP) state transitional systems behave as all other RB binaries (Roberts et al., 2015; Roberts et al., 2018), displaying long radio eclipses, up to 60 of the orbit, due to the passage of the NS through ionised material surrounding the companion, likely in the form of an intrabinary shock (IBS) produced by the interaction of the pulsar wind with that of the late-type star. The shock is also expected to emit a non-thermal spectrum and to produce a large X-ray orbital modulation (Arons & Tavani, 1993). Such modulations are indeed observed in both RBs and BWs, with the difference that the X-ray orbital maximum occurs at the inferior conjunction of the NS in the former group and viceversa in the latter. To explain the opposite phasing of the X-ray maxima and since RBs are expected to possess stronger winds than the BWs, the shock would be oriented towards the pulsar in the RBs but towards the companion star in BWs (Roberts et al., 2015; Romani & Sanchez, 2016; Wadiasingh et al., 2017).
When in RMSP state, X-ray msec pulses were observed in PSRJ1023+0038 at a few percent (, rms) level (Archibald et al., 2010) and remain still undetected in J1227 (Papitto et al., 2015). Instead Gamma-ray pulsations were detected with Fermi-LAT in J1227 at level nearly in phase with the high-frequency (1.4 GHz) radio pulses, indicating an origin in the pulsar magnetosphere, (Venter et al., 2012; Johnson et al., 2014, 2015). In PSR J1023+0038 only a weak evidence of Gamma-ray pulses was found at 3.7 level (Archibald et al., 2013). We also note here that the Gamma-ray and X-ray fluxes changed by a few, 3-10 times, between the LMXB and RMSP states in J1227 and PSRJ1023+0038, respectively (Torres et al., 2017).
How transitions occur and whether all RBs could be tMSPs is a key issue to be investigated yet. The study of the long-term behaviour, especially in the X-ray band where the IBS is expected to dominate, may be a powerful means to infer changes in the shock geometry and in turn the mass accretion rate. Also, the level of irradiation of the donor star is a key ingredient in understanding whether RBs could be prone to perform transitions. In fact, orbital modulations in the optical range (e.g Thorstensen & Armstrong, 2005; Romani et al., 2015; Hui et al., 2015; de Martino et al., 2015; Bellm et al., 2016; Al Noori et al., 2018) reveal in some systems, such as PSR J1023+0038, J1227, PSR J2215+51 and PSR J2339-0533, strong heating of the companion, while others, despite displaying significant X-ray orbital modulations, such as PSR J2129-0429, have companions suffering little irradiation.
Of the two known tMSPs in the field, PSR J1023+0038 is currently in a LMXB state (see Papitto et al., 2019, for latest results), while J1227 is in a radio-pulsar state (Bassa et al., 2014; Roy et al., 2015). Both systems have NS spinning at similar periods (1.69 ms). After the transition to the RMSP state occurred in late 2012-early 2013, the soft (0.3-10 keV) X-ray emission of J1227 was studied by Bogdanov et al. (2014) and de Martino et al. (2015). The spectrum was found to be non-thermal with a power law photon index , harder than that (1.7) observed during the LMXB state (de Martino et al., 2010, 2013). The X-ray emission was variable at the 6.91 h orbital period. Comparison of the two observations peformed in Dec. 2013 and June 2014, showed that the amplitude of the orbital modulation changed by a factor of 2 (de Martino et al., 2015). This variability was surprisingly anti-correlated with the simultaneous optical U-band light curve, where instead the modulation decreased by a factor of two. This suggested a variability in the intrabinary shock over a timescale of a few months. The hard spectral shape in the soft range is similar to other RBs, with a few also observed above 10 keV and detected up to 40-70 keV without displaying a spectral break (Tendulkar et al., 2014; Kong et al., 2017; Al Noori et al., 2018; Kandel et al., 2019).
We here present the first hard X-ray study of J1227 during its current rotation-powered state based on an observation performed with the NuSTAR satellite. We complement the analysis using previous XMM-Newton and archival Neil Gehrels Swift (henceforth Swift) data for a comparison among different epochs. We also report on the radio monitoring programme conducted at the Parkes telescope over 2.5 yrs that also gives a contemporaneous coverage with the NuSTAR observation. In Sect. 2 we report the radio observations and analysis. In Sect. 3 the X-ray observation are described and the timing and spectrscopic analyses are reported in Sect. 4 and 5, respectively. The results are discussed in Sect. 6.
2 The radio monitoring
J1227 was observed monthly at the Parkes 64-m radio telescope from June 2014 to February 2017, as part of the project P880. Data were acquired mainly around 1.4 GHz with the central beam of the 20-cm multibeam receiver (Staveley-Smith et al., 1996) or, when unavailable, with the H-OH receiver111 https://www.parkes.atnf.csiro.au/observing/documentation/ . A small number of data were obtained simultaneously around 3.1 GHz (10-cm) and 0.7 GHz (50-cm) using the coaxial 1050 cm receiver. Most observations were carried out in search mode (with folding of the data being done off-line to correct for possible orbital period variations) using either the BPSR digital signal processor (Keith et al., 2010) or the DFB4222 http://www.jb.man.ac.uk/pulsar/observing/DFB.pdf and, in parallel, CASPSR, the CASPER Parkes Swinburne Recorder333http://astronomy.swin.edu.au/pulsar/?topic=caspsr in folding mode and applying coherently dedispersion. Table 1 summarises the main parameters.
| Backend | Bandwith | Nchan | /Nbin | |
|---|---|---|---|---|
| (MHz) | (MHz) | |||
| BPSR | 1352 | 340 | 870 | 64 s |
| DFB4 | 1369 | 256 | 1024 | 100 s |
| 1369 | 256 | 512/1024 | 256/512 | |
| 3100 | 1024 | 512 | 128 s | |
| 3100 | 1024 | 1024 | 256 | |
| CASPSR | 1352 | 340 | 435 | 128 |
| 728 | 64 | 82 | 128 |
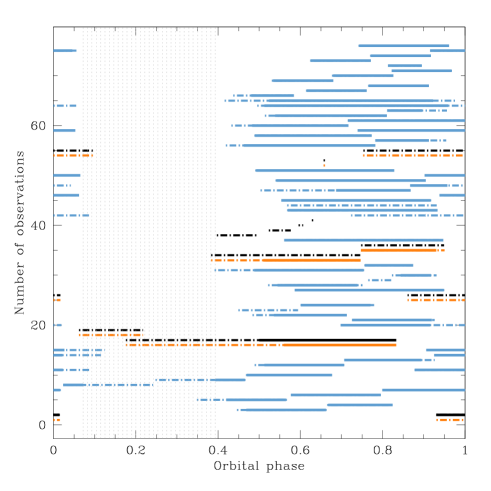
The observations were planned in such a way as to avoid those orbital phases in which the pulsar was likely to be completely eclipsed, but also to start or finish close eclipse ingress or egress, to monitor the possible variability of the eclipse extent. The orbital phases were predicted on the basis of orbital ephemeris constantly updated during the observing project. Figure 1 shows the observations (dashed lines) and detections (solid lines) at the three observed frequencies. The test pulsar was clearly detected, excluding a malfunctioning of the acquisition system. The eclipse extends at least between phases 0.07 and 0.39, but shows a large variability in time, with the pulsar being sometimes undetectable for the entire orbit. The pulsar was seen only seldom at frequencies different from 1.4 GHz: at 0.7 GHz, radio frequency interferences and absorption of the signal from the surrounding medium likely play a major role in the non detections; at 3.1 GHz it is barely detectable possibly due to the intrinsic spectrum of the source. A measurement of the spectral index of J1227 with our data set is, however, not possible since most of the data are uncalibrated and because the source is highly variabile also far from eclipses, with a signal-to-noise ratio varying by a factor up to 5 at 1.4 GHz. Because of this, the measurement of the flux density is very uncertain, preventing us to give meaningful constraints on the spectral index. We also here recall that previous observations at frequencies above 1.4 GHz only provided upper limits to the flux (Bassa et al., 2014).
2.1 The radio ephemeris
Timing analysis was carried out on the 20-cm data using only the data with orbital phases outside the range between 0.05 and 0.4, in order to exclude points affected by extra dispersive delays due to the eclipsing material. A profile template was created by adding in phase several observations together (for a total of about 40 hours). One or more times of arrival (ToAs) were then created by cross-correlation of the standard profile with each observing epoch. Usually a ToA was computed for every 15-minutes of observation, but in some cases, depending on the intensity of the signal, we used data segments from 5 to 60 minutes in length. The above steps were carried out using the software psrchive444http://psrchive.sourceforge.net/. The timing analysis was done with tempo2 (Hobbs et al., 2006). Table 2 reports the radio ephemeris obtained with the from the full 20-cm Parkes data set spanning 2.5 yrs. The inclusion of two orbital frequency derivatives was necessary to flatten the timing residuals and thus we adopted the binary model555Binary models are described at http://tempo.sourceforge.net/ref_man_sections/binary.txt The planetary ephemeris DE405 (Standish, 1998) and the TT(TAI) time standard (e.g. Lorimer & Kramer 2005) were used. This ephemeris is in accord within errors with those reported by Roy et al. (2015) who instead adopted the binary model over a timespan of 270 days. The model, including just the first derivative of the orbital period, was used on data-spans up to 300 days. After that, orbital trends clearly affected the timing residuals. The model, however, resulted in an rms comparable to that reported in Table 2, for data spans as long as 600 days, after which higher order derivatives were needed to phase connect further data points.
| Parameter | Valuea |
|---|---|
| R.A. (J2000) (h:m:s) | 12:27:58.7186(4) |
| DEC. (J2000) (d:m:s) | -48:53:42.707(5) |
| Pulsar frequency (Hz) | 592.98777342489(14) |
| Frequency derivative (Hz s-1) | -4.619(11) |
| Period epoch (MJD) | 57180 |
| Dispersion measure (pc cm-3) | 43.423(3) |
| Binary model | BTX |
| Orbital period (d) | 0.287887802(5) |
| Orbital frequency (Hz) | 4.02034315(11) |
| Orbital frequency derivative (s-2) | 3.74(6) |
| Orbital frequency second derivative (s-3) | -7.77(11) |
| Epoch of NS ascending node Tasc (MJD) | 56700.907021(4) |
| Projected semimajor axis (lt-s) | 0.668492(14) |
| Span of timing data (MJD) | 56824.257-57685.210 |
| Nuber of TOAs | 593 |
| Post-fit residuals rms (s) | 49.858 |
a errors on the last quoted digit(s)
In order to properly fold the X-ray data presented here, we also created a more local timing solution using approximately 170 days of Parkes data around the NuSTAR observation. Only one orbital period derivative was needed to properly phase connect the data on this shorter time-span and therefore we used binary model BT. The related ephemeris are shown in Table 3.
| Parameter | Value |
|---|---|
| R.A. (J2000) (h:m:s) | 12:27:58.7194(14) |
| DEC. (J2000) (d:m:s) | -48:53:42.712(19) |
| Pulsar frequency (Hz) | 592.9877734395(9) |
| Frequency derivative (Hz s-1) | -4.3(3) |
| Period epoch (MJD) | 57139 |
| Dispersion measure (pc cm-3) | 43.423(3) |
| Binary model | BT |
| Orbital period (d) | 0.287887065(5) |
| Orbital period derivative | -2.5(14) |
| Epoch of NS ascending node Tasc (MJD) | 57139.0715595(6) |
| Projected semimajor axis (lt-s) | 0.668482(16) |
| Span of timing data (MJD) | 57063.530-57233.225 |
| Nuber of TOAs | 189 |
| Post-fit residuals rms (s) | 23.097 |
2.2 Distance estimates
The dispersion measure (DM) has been evaluated using a few measures at 50-cm
avoiding eclipses resulting in DM= 43.423(3) , where here
uncertainty is at 2 level. It has then been kept fixed in the analysis
of the other data sets at 20-cm. This determination, although at lower accuracy,
is in agreement with that previously derived (43.4235(7)) (Roy et al., 2015).
The DM value, when adopting Cordes &
Lazio (2002) model of the Galactic
electron
density distribution, gives a distance of 1.4 kpc (Roy et al., 2015). However
as noted by Jennings et al. (2018) the DM-based distances calculated using
either Cordes &
Lazio (2002) or Yao
et al. (2017) models are on average slightly
underestimated. For J1227 there is no parallax measurement from radio
observations yet. However,
the recent release of Gaia DR2 parallaxes
(Gaia
Collaboration et al., 2018) allows to obtain first direct distance measures for MSP binaries
with relatively bright optical companions.
J1227 has a parallax measure =0.6240.168 mas which,
accounting
for the DR2 parallax average zero-point offset of -0.029 mas
(see Lindegren
et al., 2018), translates into
a distance =1.530.39 kpc. However reliable distance
estimates
should account for the space density distribution of the objects. Adopting
a weak distance prior that varies as a function of Galactc longitude and latitude
according to the Galactic model described in (Bailer-Jones et al., 2018)666http://gaia.ari.uni-heidelberg.de/tap.html, we estimate a distance of
kpc, taking into account the average
zero-point
offset. On the other hand adopting a distance prior based on the
Galactic pulsar population of Lorimer
et al. (2006) and also accounting for
the average zero-point offset, Jennings et al. (2018) derive
=1.37 kpc. The two estimates agree within their
1 uncertainties. We then adopt the latter distance
for J1227.
We also estimate the intrinsic spin-down power, , where P and are the spin period and its derivative and , is the momentum of inertia of the NS. We use the refined pulsar spin frequency and first derivative (Table 2) that are more accurate than those derived by Roy et al. (2015), which were based on a shorter, 270 d, timespan. With the accurate Gaia DR2 proper motion (), we correct the observed for the Shklovskii effect: , where is the transverse velocity. For a distance of 1.37 kpc we derive . Correspondingly, adopting a NS with 1.4 and 10 km radius, we derive . As a comparison, Roy et al. (2015) derived . However, allowing the full range of uncertainties in the distance , we obtain .
3 The NuSTAR Observation
J1227 was observed by NuSTAR (Harrison et al., 2013) from Apr. 26 to 28, 2015 with both telescope modules FPMA and FPMB, covering 171.8 ks, for a total effective exposure time of 96.4 ks (OBSID: 30101033002).
The processing and filtering of the NuSTAR photon event data was performed with the standard NuSTAR pipeline (NUSTARDAS) version v1.8.0 with calibration data CALDB 20190503. The source photon events were extracted from circular regions of 25 pixels (61) radius and the background from a region of 50 pixels in a source-free region. Photon event arrival times from both FPMA and FPMB were corrected to the Solar System Baricentre using the JPL DE405 ephemeris using the radio position reported in Table 2. Combined net light curves were constructed by subtracting the source light curves for the corresponding background in each FPMA and FPMB module and averaged together. The source was detected at an average net count rate of 0.037 in the 3-79 keV range. Spectra from the two telescope modules were extracted using the nuproducts and then binned to achieve a minimum of 35 photons per bin. All photons below 3 keV (channel 35) and above 79 keV (channel 1935) were flagged as bad.

4 Timing analysis
4.1 The X-ray variability
The combined (FPMA and FPMB) net X-ray light curve in the 3-79 keV range (Fig. 2) shows variations in the count rate over the 47 h-long observation on timescale of 7 h, consistent with the 6.91 h orbital period. Neither flaring activity nor sudden drops in the count rate are observed throughout the observation. A search for orbital modulation was carried out by performing Fourier analysis on the barycentred corrected light curve in the 3-79 keV range adopting a time bin of 340 s. A strong peak at 25000 s as well as minor peaks at the beat frequency of the NuSTAR spacecraft are detected. A sinusoidal fit to the light curve gives a period of 25060235s (1 confidence level) (=1.08, d.o.f.=319). An epoch-folding method (Leahy, 1987) was also applied, adopting 8 orbital phase bins using various trial periods around the radio nominal period of 24873 s with a period resolution of 50s. The distribution shows a peak at 9 level at a period of 25232 90 s as evaluated from a Gaussian fit. These determinations of the period are however consistent within their 1 and 3 uncertainties with the accurate radio orbital period reported in Tables 2 and 3, respectively. No cycle to cycle variation is observed in the average count rate level over the 6.9 orbital cycles covered by the NuSTAR observation (see Fig. 2).
The FPMA and FPMB background subtracted light curves in different energy ranges were then merged and folded at the binary orbital period =24873.4424 s, adopting as phase =0.0 the time of passage of the pulsar at the ascending node = 57139.0715595 (MJD), reported in Table 3. The folded light curve in the 3-79 keV band, evalutated over 16 phase bins, (see inset in Fig. 2) shows a structured broad maximum at orbital phase 0.8 and a minimum at 0.25, close to the inferior and superior conjunction of the pulsar, respectively. The fractional amplitude, defined as ), where and are the maximum and minimum count rates detected in the light curve, respectively, is . The rise to the maximum is slower than the subsequent decay, reaching a peak at =0.9. Also the minimum is not smooth or flat-bottom but rather structured towards the rise to the maximum. A well defined double-peaked maximum, as observed in June 2014 by XMM-Newton (de Martino et al., 2015), is not present. The modulation also appears different from those observed in Dec. 2013 and Jan. 2014 by XMM-Newton and Chandra, respectively, that instead are similar to each other (see Bogdanov et al., 2014; de Martino et al., 2015)777The short Chandra observation is not used here.
A close comparison of the NuSTAR data with the two XMM-Newton EPIC-MOS888Details of the reduction and extraction of the EPIC-MOS1,2 (Turner et al., 2001) cameras are published in de Martino et al. (2015) observations is made by folding background subtracted light curves in a common 3-12 keV energy range using and reported in Table 2. These are shown in Fig. 3. The orbital modulation is clearly structured in all data sets but shows differences especially in the broad maximum. The fractional amplitude of the orbital modulation increases from in Dec. 2013, to in June 2014 and decreases again to in Apr.2015. Here we note that the flux at minimum is about the same at all epochs, . While the variability in amplitudes between the first two observations was already reported in de Martino et al. (2015), the NuSTAR observation confirms that modulation amplitudes have not stabilized after the transition from a disc to a rotation-powered state, hinting to a non-stationary IBS emission. Noteworthy is the change in the shape of the maximum among the three epochs, displaying a local peak at 0.7 in 2013, a double peaked maximum in 2014 centred at 0.75 and a local peak at 0.9 in 2015. Since a simple sinusoid at the orbital frequency does not satisfactory fit the light curves in the 3-12keV range, a fit was performed using a composite function consisting of two or three sinusoids at the fundamental frequency, , and its two higher harmonics, 2 and 3 (see Table LABEL:sinu_fits). Only for the 2014 data set three components are required, while for the other two epochs two sinusoids at and 2 well describe the orbital modulation, although the improvement over a single sinusoid is significant only at 90 and level for the 2013 and 2015 epochs, respectively. The amplitudes of the sine components at and 2 are similar in 2013 and 2015 within their uncertainties. An offset by 0.13 in phase is derived in the 2 component between these two epochs but not in the fundamental, that remains stable within errors. Different is the case observed in 2014 where and 2 increase in amplitude by a factor of 1.7 and of 3, respectively. The 3 component has a fractional amplitude of and contributes at the minimum of the modulation.

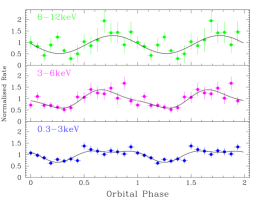
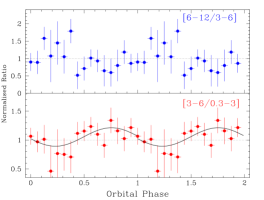
A further comparison is carried out using common selected energy ranges between the XMM-Newton and NuSTAR data, namely 3-6 keV, 6-12 keV for the three epochs. Folded light curves in the soft 0.3-3 keV bands were also produced for the two XMM-Newton data sets to inspect the energy dependence of the orbital variability. Table LABEL:sinu_fits reports the results of the fits by using up to three components. In Fig. 4 the energy resolved light curves in the three energy ranges are shown for the two earlier epochs. Two sine components better describe the orbital modulation in the softer 0.3-3 keV and 3-6 keV bands in Dec. 2013, although the improvement over a single sinusoid is signficant only at and at , respectively. At higher (6-12 keV) energies the variability is badly defined in 2013, though consistent with that observed by NuSTAR in 2015.
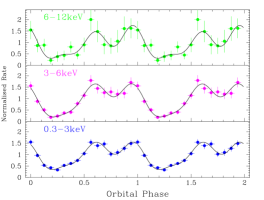
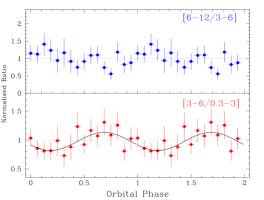
As for Jun. 2014, three sinusoids are required in all bands. As before, the amplitudes of the fundamental frequency change by a factor of about two while that of 2 increases by 3 in all bands with respect to the 2013 and 2015 observations. The modulation is stronger in the 3-6 keV range, while in the 6-12 keV band, it is badly defined and consistent with the softer ranges within uncertainties. This produces a mild hardening between 0.3-3 keV and 3-6 keV ranges at , i.e. at the inferior conjunction of the NS. This behaviour is seen in the hardness ratios (HR), defined as the the ratio of count rates in the 3-6 keV and 0.3-3 keV bands and 6-12 keV and 3-6 keV ranges. At higher energies the HR are instead dominated by noise (see Fig. 5). The significance of the orbital variability of the hardness ratios (HR), defined as the ratio of count rates in the 3-6 keV and 0.3-3 keV bands and 6-12 keV and 3-6 keV ranges, was inspected by modelling the orbital HR curves with a constant and a sinusoidal function. For the June 2014 observation, and for the softer HR between 3-6 keV and 0.3-3 keV we obtained =10.7, d.o.f.=15 in case of a constant and =6.5, d.o.f.=13 for a sinusoidal fit with fractional amplitude of 17(6). The improvement of the modelling with respect to a constant was however at only 2 level. For the Dec. 2013 observations and for the same soft HR we obtained in the case of a costant =12.95, d.o.f.=15 and =6.3, d.o.f.=13 for a fit with a sinusoid with fractional amplitude of . The variability is significant at only 2.6 level. The HR at higher energies between 3-6 keV and 6-12 keV are instead consistent with a constant in both 2013 and 2014 observations (see Fig. 5). This refines the results found by de Martino et al. (2015), where hardness ratios were inspected in 0.3-2 keV and 2-10 keV.
The NuSTAR orbital light curves of Apr. 2015 were also produced in the 12-25 keV, 25-40 keV, 40-79 keV and 25-79 keV ranges (see Fig. 6). A weaker modulation than that observed in Jun.2014, but of similar amplitude as in Dec. 2013 (), is detected below 12 keV. The modulation extends up to 25 keV with similar fractional amplitudes. It is however undetected at higher energies with an upper limit to the modulation amplitude of 10 (3 confidence level). Two harmonics account for the asymmetric shape in the 3-6 keV and 12-25 keV range although significant at and confidence levels, respectively. In the 6-12 keV range only the fundamental frequency is required (see Table LABEL:sinu_fits). The hardness ratios in the four selected bands reveal no spectral variations except at higher energies due to the lack of detectable modulation above 25 keV (right panel in Fig. 6).
We also performed a Fourier search for coherent periodicities in the 3-79 keV time-series recorded by both NuSTAR modules, after preliminarily correcting the photons times of arrival for the orbital motion of the pulsar using the orbital parameters listed in Table 3. The NuSTAR onboard clock suffers of timing jumps introducing spurious derivatives of the order of Hz s-1 of the frequency of a Hz coherent signal (see Sanna et al., 2017). Therefore a search was done over a frequency range of Hz around the spin frequency of J1227. The maximum value of the Fourier power density observed corresponds to an upper limit on the rms pulse amplitude of (3 confidence level; (see Vaughan et al., 1994)). This value is comparable with the upper limit set from the analysis of XMM-Newton observation performed in 2014 (7.1%; (Papitto et al., 2015) and slightly smaller than the amplitude of of the pulses detected in the 0.25-2.5 keV band during the radio pulsar state of PSR J1023+0038 (Archibald et al., 2010).


4.2 The optical variability
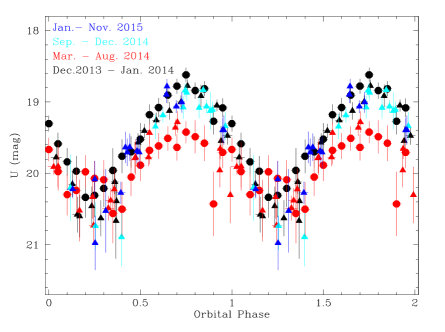
The optical long-term behaviour of J1227 was also inspected by extending the comparison of the orbital modulations between the X-ray and optical ranges at the epoch of the NuSTAR observation. In particular, the optical U-band modulation decreased by a factor of 2 between the XMM-Newton pointings in Dec. 2013 and Jun. 2014 and accompained by an anti-correlation in the X-ray band (de Martino et al., 2015). Therefore U-band photometry was extracted using Swift UVOT (Roming et al., 2005) observations acquired between Jan. and Nov. 2015.This larger time-span was dictated by the occasional coverage with the U filter. As an additional comparison U-band measures were also extracted for several epochs, namely Dec. 2013-Jan. 2014, Mar.-Aug. 2014 and Sept.-Nov. 2014 to trace potential changes in the optical light curve over different epochs. For this purpose, we used the tool uvotmaghist in ftools v.6.22, accounting for sensitivity UVOT patches999Small scale sensitivity patches in the UVOT detector are described at https://swift.gsfc.nasa.gov/analysis/uvot_digest/sss_check.html, to extract the photometry and applied the correction to the Solar System barycentre. The folded light curves were then compared with those observed in 2013 and 2014 by the Optical Monitor (OM) on-board XMM-Newton. The modulation observed during the Jan.-Nov. 2015 has a peak-to-peak amplitude of 1.47(8) mag, similar to that observed in Dec. 2013 by the OM (1.43(4) mag) and to those observed by UVOT in the same period (Dec. 2013-Jan. 2014) and in Sept.-Nov.2014. It is thus larger by a factor of 2 than that observed in Jun. 2014 by the OM (0.72(9) mag)) and by UVOT in the Mar.-Aug. 2014 (see Fig. 7). This indicates that the smaller orbital U-band modulation amplitude was only reached during the Mar.-Aug. 2014 period, whilst before and after that epoch the variability was larger. Here we also confirm that J1227 shows within uncertainties of the photometry the same minimum optical flux at all epochs (). The decrease and the subsequent increase in amplitude in 2014 thus occurred over a timescale of 2 and 1 month, respectively. Comparing the optical and X-ray behaviour in the 2013, 2014 and 2015 epochs, we can firmly confirm the the orbital modulation is anti-correlated in the two energy regimes, i.e. when the X-ray modulation is larger, the optical U-band orbital variability is smaller.
5 Spectral analysis
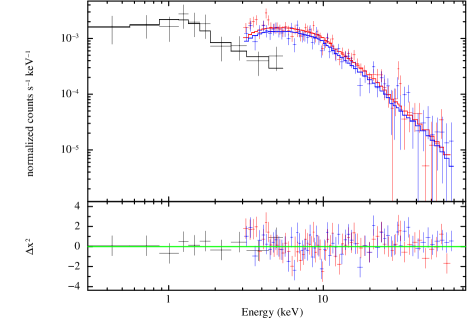
The average 3-79 keV spectra from the NuSTAR FPMA and FPMB modules over the whole observation are featureless and of similar shape as those previously observed in the softer 0.3-10 keV range by Bogdanov et al. (2014); de Martino et al. (2015). The spectrum extends up to 70 keV without any apparent spectral break. An absorbed power law model was adopted to fit the spectra with a multiplicative normalization constant to account for the differences of the FPMA and FPMB detectors, namely const*tbabs*powerlaw in xspec101010Details on xspec models available at https://heasarc.gsfc.nasa.gov/xanadu/xspec/manual/Models.html. However, since the the hydrogen column density found from the XMM-Newton spectra in 2013 and 2014 (Bogdanov et al., 2014; de Martino et al., 2015) were both agreeing with an upper limit of , and due to the lack of sensitivity of the NuSTAR data to such low values, the hydrogen column density was fixed to zero. We then find a power law photon index (90 confidence level) and an unabsorbed flux of in the 3-79 keV range (see Table 5). The -index is fully consistent with that we derived in the XMM-Newton data of Dec. 2013 (1.070.08) and Jun. 2014 (1.20.1). If a power law with an exponential cutoff is instead used, a worse fit is obtained (=1.13, d.o.f.=136) with a power law photon index essentially the same, , and a cutoff energy 170 keV. The average flux in the 3-12 keV band is , similar to that observed in Dec. 2013 but lower than in Jun. 2014. With the above spectral parameters the X-ray luminosity in the 3-79 keV is , for the adopted distance of 1.37 kpc, accounting for the distance uncertainties.
To extend the spectral analysis into the soft energy range, Swift XRT (Burrows et al., 2005) data were then used. The monitoring of J1227 over the years encompasses observations performed in 2015, including April 25 (ObsId:81457001, 1.97 ks), but the short coverage results in a 0.3-10 keV spectrum with poor statistics. We then extracted XRT PC mode observations performed over a period of 4 months and with exposures longer than 1 ks, namely March 11, 2015 (ObsId:35101021, 2.78 ks), April 25, May 3, 2015 (ObsId:81457002 - 1.93 ks), June 22, 2015 (ObsId: 35101024, 2.22 ks) and July 3, 2015 (ObsId: 35101025), totalling 9.9 ks. The XRT PC mode data were extracted using the automatic analysis software (Evans et al., 2009) from the UK Swift Science Centre. During this period J1227 was found at an average count rate level (PC mode) of cts s-1. The XRT 0.3-10 keV background subtracted light curve folded at the 6.91 h orbital period although with small gaps displays a minimum and a maximum at consistent phases as those observed in XMM-Newton and NuSTAR data but the fractional amplitude of the variability is poorly constrained (4623), preventing a meaningful comparison. The accumulated XRT 0.3-10 keV spectrum grouped to have 5 counts per bin, was fitted with an absorbed power law, giving a photon index =1.1, an upper limit to the column density and an unabsorbed flux of . When evaluated in the 3-6 keV range, the fluxes between NuSTAR and Swift agree within errors despite the uneven orbital coverage of the XRT instrument.
We then combined Swift and NuSTAR average spectra to perform a broad-band spectral fit (Fig. 8). Using the same model as before, leaving free the hydrogen column density of the absorber we obtain (=1.0, d.o.f.=126) and all other parameters consistent with those without the addition of the Swift spectrum (Table 5). We then adopted a fixed hydrogen column density to the value found with the XMM-Newton data. The total 0.3-79 keV unabsorbed flux is . This gives a luminosity of in the same energy range for D=1.37 kpc.
| Parameter | Average | Orbital phase | |||
|---|---|---|---|---|---|
| 0.17-0.45 | 0.69-0.99 | 0.45-0.69 | 0.00-0.17 | ||
| 0.920.07 | 0.88 | 0.95 | 0.80 | 0.94 | |
| 1.170.08 | 1.13 | 1.150.13 | 1.26 | 1.23 | |
| Flux∗∗ | 3.400.10 | 1.96 | 5.05 | 3.62 | 2.94 |
| /d.o.f. | 1.05/119 | 1.48/19 | 1.17/33 | 0.76/20 | 0.76/20 |
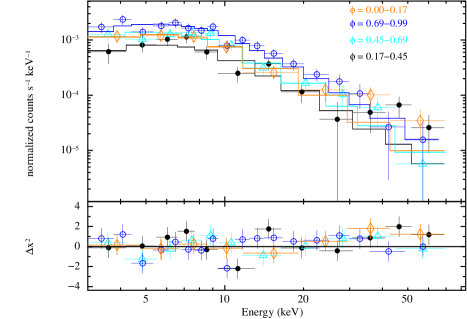
Hints of changes in the spectral shape in the XMM-Newton data of Dec. 2013 and Jun. 2014 were found between the orbital maximum and minimum, with a tendency of a harder power-law index at maximum (=1.10.1) with respect to that at minimum (=1.30) (see de Martino et al., 2015). As seen in the hardness ratios in the selected energy ranges (Fig. 5) a tendency of a lower amplitude in the softer 0.3-3 keV band was found, but not at higher energies (see Sect. 4.1). This could produce a hardening of the spectrum at orbital maximum. The energy resolved NuSTAR orbital light curves also confirm the lack of energy dependence of the amplitudes above 3 keV and that the modulation is undetected above 25 keV. We however inspected the NuSTAR spectra along the orbital period by selecting four orbital phase ranges, namely the maximum (=0.69-0.99), the minimum (=0.17-0.45), the rise to maximum (=0.45-0.69) and the decay to the minimum (=0.0-0.17) (see Table. 5). The variations essentially occur in the normalization with a power law photon index being constant within uncertainties, although there is a tendency of a softer spectrum in the rise to and in the decay from maximum. The lack of orbital modulation above 25 keV is also apparent in the phase-resolved spectra (Fig. 9).
6 Discussion
We here discuss the first X-ray data above 10 keV obtained with NuSTAR of the tMSP J1227 during the rotation-powered state complemented with a 2.5 yr-long radio coverage at Parkes telescope.
6.1 The radio monitoring
The radio monitoring spanning from June 2014 to February 2017 and carried mainly at 20-cm (1.4 GHz) provided us with a pulsar spin frequency at higher accuracy than previously reported (Roy et al., 2015) and a new orbital ephemeris, which is refined close to the April 2015 NuSTAR observation. The radio eclipses at 20-cm extend at least from 0.06 to 0.39, although at some epochs the pulsar was not detected for a full orbital cycle. This gives a lower limit to the eclipse extent . However at lower frequencies (e.g. 50-cm), the eclipse length could be as long as 0.52-0.56 (Figure 1). As a comparison, Roy et al. (2015) derive an eclipse length of at 607 MHz. Long eclipses up to of the orbital cycle are typical of RBs rather than BWs that instead have shorter eclipses (). In both types of systems the eclipses are a signature of intrabinary material, produced by the interaction of the pulsar and companion star winds, likely in the form of a shock.
Using the thin-shell approximation for the collision of two isotropic winds (Canto et al., 1996) and, for simplicity, that the shock axis of symmetry lies in the orbital plane (Romani & Sanchez, 2016; Wadiasingh et al., 2017), the maximum shock opening angle as measured from the pulsar is related to the binary inclination and eclipse length through a simple trigonometric relation: . For J1227, assuming a very conservative lower limit to the radio eclipse length 0.4 and a binary inclination (de Martino et al., 2015; Rivera Sandoval et al., 2018), the maximum shock opening angle would correspond to or . Following Canto et al. (1996), the asymptotic shock angle is given by: , where is the ratio of the secondary star to the pulsar wind momentum. The latter is related to the shock stagnation point radius, here from the MSP, as: , where is the binary separation (Canto et al., 1996). The estimated maximum shock opening angle would then give a maximum distance of the shock from the pulsar and . Adopting the projected semi-major axis of the pulsar, = 0.668492 lt-s (Table 2), the above binary inclination range and a mass ratio 0.194 (Roy et al., 2015), we obtain an orbital separation cm. Consequently we estimate , which is about the NS Roche Lobe radius. However, in order to have the IBS formed around the pulsar, as indicated by the phasing of the X-ray light curves (see below), the condition should be satisfied. The eclipse fraction observed at high frequencies then cannot provide a reliable estimate, but only a very loose lower limit to the eclipse fraction. In fact, RBs have longer eclipses at lower frequencies, with a dependence as (Broderick et al., 2016). As a comparison, for PSR J1023+0038 Wadiasingh et al. (2017) estimate for an eclipse fraction at 350 MHz (Archibald et al., 2013). Our monitoring at Parkes encompasses only a few observations at 728 MHz and the previous measures by Roy et al. (2015) also had a few at 322 MHz. Scaling the eclipse length from 607 MHz to 322 MHz, we derive . Using instead this more likely value for the eclipse fraction, we obtain and . As noted by Wadiasingh et al. (2017) caution should be taken in the direct interpretation of in terms of wind ram pressure due to the gravitational influence of the pulsar. Additionally, the pulsar wind is likely to be more concentrated equatorially and an additional dependence of the MSP wind momentum as with , or even 4 for an oblique rotator, introduces changes in the shape of the IBS narrowing it at the poles (Romani & Sanchez, 2016; Kandel et al., 2019).
6.2 The X-ray emission
The X-ray spectral shape is a power law with index of 1.2 with no spectral break up to 70 keV, indicative of synchrotron cooling. The large orbital variability observed in J1227 and in other RBs, suggests that the IBS dominates the X-ray emission. This emission depends on the post-shock magnetic field strength () and on the ratio of magnetic to particle energy density (see Kennel & Coroniti, 1984). In the case of weakly magnetised winds, could be as low as as in the Crab, while in strongly magnetised winds . The post-shock magnetic field is related to the upstream magnetic field as and in these extreme cases, respectively (Kennel & Coroniti, 1984). At large distances from the light cylinder, that is for shock locations , where is the radius of the light cylinder, the upstream magnetic field is given as: , where is the pulsar isotropic factor and is the pulsar spin-down power (Arons & Tavani, 1993). J1227 has a powerful pulsar with and for and for an isotropic wind, =1, we obtain 1.4 G for and G for high- wind conditions. Consequently, for , whilst it is 4 G for low- regimes. In both cases the magnetic field is large and higher than those in PWNe (Kennel & Coroniti, 1984). These values are slightly larger than those derived by de Martino et al. (2015), who instead assumed the shock at the NS Roche lobe radius. The Lorentz factor of accelerated electrons is related to the maximum energy of synchrotron photons and post-shock magnetic field. The NuSTAR spectrum does not show a break up to 70 keV and thus we conservatively assume at this energy. Thus for high and low magnetizations, respectively (Rybicki & Lightman, 1979). The electron population has a power law energy spectrum with index related to the X-ray power-law index as 1.3 below the maximum energy, extending at least down to 0.1-0.3 keV. Observations at lower energies only encompass FUV and UV bands with the shortest wavelength coverage at 2216 (Rivera Sandoval et al., 2018). At these wavelengths an excess of flux over the companion star emission has been detected primarly at orbital maximum and ascribed to the possible contribution of the IBS in the UV (Rivera Sandoval et al., 2018). However the extrapolation of the synchroton spectrum, using the derived power-law index, gives a flux 2-orders of magnitude lower than that observed at 2216 Å. Here we note that an additional bremsstrahlung component from an ADAF-like wind inflow contributing to the unmodulated flux has been recently suggested at soft X-ray energies, extending to UV and optical wavelengths Wadiasingh et al. (2018), that could be possibly related to the observed UV excess. Hence, we can only set an upper limit of 0.1 keV to the synchrotron energy of the minimum Lorentz factor , giving . This range of high- values implies a population of non-thermal emitting electrons from the shock in the X-ray domain. The hard p-index appears to contradict simple Fermi-type acceleration (diffusive shock acceleration) that predicts p2.1-2.2 and could be in favour of magnetic dissipation (shock-driven magnetic reconnection) in the striped pulsar wind that predicts p1-2 in high- regimes (see Sironi & Spitkovsky, 2011a, b; Sironi et al., 2015).
The X-ray light curves of J1227 observed at different epochs all show a maximum at inferior conjunction of the pulsar . This phasing is observed in all RBs and it is opposite to what observed in BWs, that instead have a maximum at superior conjunction of the pulsar. The different behaviour is explained with a shock that wraps the pulsar in the RBs while the opposite occurs in BWs (Romani & Sanchez, 2016; Wadiasingh et al., 2017). The light curves show different shapes over the years, with a broad asymmetric maximum in 2013 and 2015 centred at but peaking around 0.7 and 0.9, respectively, with similar amplitudes. Instead, the modulation increases by a factor 2.2 in 2014 and has a well defined double-peaked maximum, with peak separation and a dip reaching with respect to the maximum. If the shocked pulsar wind retains a moderately relativistic bulk motion, the synchrotron emission is expected to be Doppler boosted at inferior conjunction and de-boosted at superior conjunction of the NS, thus producing an X-ray orbital modulation (Arons & Tavani, 1993; Dubus et al., 2010, 2015). The bulk Lorentz factor and bulk velocity , drive the Doppler boosting as where is the viewing angle of the observer (Dubus et al., 2010). The synchroton flux is expected to be enhanced by a factor , along the orbit (Dubus et al., 2015) with a maximum to minimum flux ratio simplified as (Dubus et al., 2010). The observed modulation amplitudes in 2013 and 2015, assuming and binary inclination in the range , would then give and while in 2014 and , indicating moderately relativistic bulk flow. A maximum flux enhancement of at the surface cap of the shock is predicted by the semi-analytical model of Wadiasingh et al. (2017) implying 1.1 and 1.3 and 0.4 and in the observations of 2013/2015 and 2014, respectively. For moderately low binary inclinations as in J1227, broad maxima and weak amplitudes are predicted for low values and small shock radii, while distinct double-peaked maxima and large amplitudes are expected for high bulk velocities and larger shock distances from the pulsar (Wadiasingh et al., 2017). The dip between the double-peaked maxima will have fractional intensities increasing at higher and/or larger shock distances. Hence the broad maximum observed in 2013 and 2015 indicates lower bulk velocities and smaller shock radii than those in 2014. Then, if the changes in the shape of the X-ray modulation are signatures of changes in the shock location, this may suggest that in 2013 and 2015 the donor star wind momentum was larger (smaller shock distance from the pulsar). Since optical modulation was stronger in 2013 and 2015 than in 2014 and anti-correlated with X-rays, it may be possible, as proposed in de Martino et al. (2015), that the shock had moved farther from the donor star at those two epochs, leaving more visible area of the heated face. The possibility that the companion Roche-lobe filling factor could have changed, while appearing a viable explanation, would also imply a change in the optical flux at the orbital minimum, where the un-heated face of the secondary contributes. The U-band flux is however similar in all observations within uncertainties at this phase.
In addition, the light curves from soft to hard X-rays show a minimum skewed towards the rise to maximum. This is more evident in 2014 when the modulation is stronger and where the multi-sinusoidal fits require up to three harmonics. Although these are purely phenomenological descriptions, they may indicate that the structure of the IBS is asymmetric either due to Coriolis effects near the stagnation point (Wadiasingh et al., 2017) or at the shock boundaries (Wadiasingh et al., 2018). Consequently also the irradiation of the secondary star is expected to be asymmetric (Romani & Sanchez, 2016; Kandel et al., 2019). The optical multi-color photometry of J1227 obtained in early 2015 indeed showed strong asymmetries in the portion of the light curves rising to the maximum (de Martino et al., 2015), supporting the possibility that an asymmetric shock may provide at least some of the heating.
Whether the shock is stable over years-timescale is still an unsolved
matter since quasi-spherical radial infall on a pulsar is unstable on dynamical timescales
for distances outside the light cyclinder (see Burderi
et al., 2001).
Recently (Wadiasingh et al., 2018) have investigated two possible mechanisms
that could provide stability of a configuration where the shock is curved around the pulsar.
One where the secondary star has a large dipole magnetic field of several kilogauss
and low mass loss rates () and the other where
instead the secondary mass loss rate is large ()
with the flow in an ADAF-like configuration. However, both mechanism have their
shortcomings (see details in Wadiasingh et al., 2018).
The lack of a detectable orbital modulation above 25 keV is unexpected result, not reported before for any of the other four RBs observed with NuSTAR, namely PSR J1023+0038 (Tendulkar et al., 2014), PSR J2129-0429 (Al Noori et al., 2018), PSR J1723-2837 (Kong et al., 2017) and PSR J2339-0533 (Kandel et al., 2019), although this could well depend on the choice of the energy bands used to study the X-ray modulations. Indeed, a more detailed study of the energy resolved X-ray orbital modulation in PSR J1023+0038 as observed with NuSTAR during its previous rotation-powered state reveals that above 25 keV the modulation has a fractional amplitude , lower than that below 25 keV, (1 uncertainty) (Coti Zelati et al., in prep.). This smaller amplitude is consistent with the 3 upper limit of found in J1227. Small changes in the spectral shape between the minimum and maximum of the orbital modulation, although here undetected, could produce energy dependent modulation amplitudes. For PSR J2339-0533 Kandel et al. (2019) find subtle changes in the phase-resolved X-ray spectra and a double-peaked light curve only below 15 keV, while between 15-40 keV it is single peaked. We here note that also for J1227, if studied over this wider energy range (e.g. 15-40 keV) the orbital modulation has about similar amplitude as in the softer NuSTAR bands. Indications of spectral changes along the double-peaked orbital modulation were also found in the XMM-Newton and NuSTAR data of PSR J2129-0429 (Al Noori et al., 2018). These would be the signature of different populations of cooling electrons whose spectrum is sensitive to the shape of the shock geometry and on the downstream magnetic field along the shock (Wadiasingh et al., 2017; Kandel et al., 2019). If the orbital modulation has a lower amplitude at high energies this may indicate that the electron population contributing to the shock emission at these energies has a different p-index or that a spectral break is hidden by the underlying magnetospheric pulsar emission. The latter has been successfully described by a magnetospheric synchrocurvature radiation model for the non-thermal and X-ray spectra of pulsars (Torres, 2018; Torres et al., 2019) and would be dominant at minimum of the orbital modulation. The lack of detectable phase-resolved spectral variations above 3 keV (see Table. 5). cannot help in discriminating the spectral shapes of the magnetospheric and IBS emissions. In fact even including two power-law components in the spectral fits and fixing the parameters of one to those found for the minimum we derive similar power-law indexes within errors and larger normalizations at the maximum, at the rise/decay to/from maximum.
For what concerns the softer X-ray band, i.e. 0.3-3 keV, as observed by XMM-Newton the modulation amplitude is lower than that at 3-6 keV by a factor of 1.4 in 2013 and 2014 (see Table LABEL:sinu_fits). This would produce an overall hardening at orbital maximum or, viceversa a softer emission at orbital minimum and, indeed, a marginal change of the power-law index from 1.1 to 1.3 between maximum and minimum was found (de Martino et al., 2015). Also in this case, an energy dependence of the X-ray light curve could be a signature of a spatial dependence along the shock of the electron p-index and thus less efficient (de-boosting) acceleration (Wadiasingh et al., 2017, 2018). However the lack of spectral change and thus of energy dependent modulation above 3 keV makes this hypothesis less viable. Alternatively, the softening at orbital minimum, i.e. at superior conjunction of the pulsar, below 3 keV could be explained by the additional contribution of the thermal emission of the NS where it is expected to be best visible. In de Martino et al. (2015) an upper limit of of the NS contribution to the average 0.3-10 keV flux was found, while at orbital minimum it is . Although this does not allow a firm conclusion, it appears a viable interpretation. A future much longer exposure in the soft X-ray band may allow to put more stringent constraints on the NS thermal emission.
A strong irradiation (from 5500 K to 6500 K) of the companion star in J1227 was found from optical spectroscopy and photometry, persistent in both rotation-powered and disc-states (de Martino et al., 2014, 2015). Whether the late-type secondary is heated by the pulsar wind, by the X-ray emission from the IBS o both, could not be assessed due to the limited energy coverage of previous XMM-Newton observations. With the NuSTAR observation presented here, we derived a X-ray luminosity , implying an efficiency . The expected heating power impinging onto the companion star in the case of an isotropic pulsar wind is where is the geometric factor with , neglecting albedo. From optical photometry (de Martino et al., 2015), the secondary is found to fill its Roche lobe and thus , giving for q=0.194. We then derive . Similarly, if we consider the X-ray IBS emission located at from the MSP, we obtain , which is only the expected heating from the pulsar spin-down power, and is only the luminosity of the irradiated face of the companion, for 6500 K (de Martino et al., 2015)111111The effect of irradiation is to suppress the temperature gradient in the outer stellar envelope, blocking the outwards transport of energy through the face. A detailed rigorous treatment of irradiation can be found in Ritter et al. (2000). Then the total irradiating luminosity, , is just about what necessary to heat the companion star. Different is the case where the shock power-law extends into the MeV range (10 MeV), in which case the IBS alone would be energetically able to irradiate the secondary star. Alternatively the shock is located much closer (at) the companion but this would contrast with the geometry of the IBS wrapping the pulsar for the correct phasing of the orbital modulation.
We also note that additional heating could originate from shock particles that thread the companion magnetic field lines and are ducted to its surface (Sanchez & Romani, 2017). Such possibility would require kilogauss magnetic field strengths for the secondary, hence a very active magnetic late-type star (large star-spots and/or flares) (Wadiasingh et al., 2018; Kandel et al., 2019). So far large star-spots are not identified in the optical light curves of RBs, although a few systems have been found to display flares (Romani et al., 2015; Deneva et al., 2016; Cho et al., 2018). This additional heating has been invoked to explain asymmetries in the light curves of many RBs (Romani et al., 2015; Sanchez & Romani, 2017). J1227 could also be affected by this mechanism.
7 Conclusions
We have presented the first NuSTAR hard X-ray data of the tMSP J1227 during its rotational-power state complemented with coordinated a 2.5 yr-long radio monitoring at Parkes telescope and with archival XMM-Newton and Swift data. Here we summarise the main results:
-
•
The Parkes monitoring gives us a refined orbital radio ephemeris around the NuSTAR observation, which we used to study the orbital dependent X-ray emission. The radio observations, mainly conducted at 1.4 GHz confirm the presence of long eclipses lasting of the orbit. The distance to J1227 derived from the DM is consistent with that obtained from Gaia DR2 parallax, D= kpc.
-
•
The X-ray spectrum is non-thermal extending up to 70 keV withouth a spectral break and is consistent with a power-law, with photon index 0.08. The X-ray emission is ascribed to an intrabinary shock formed between the pulsar and companion winds. We derive a luminosity in the 3-79 keV range of , using the Gaia distance.
-
•
The X-ray emission in the 3-79 keV range displays significant modulation at the 6.91 h orbital period with an amplitude of 28. Energy resolved orbital light curves show that the modulation is significantly detected below 25 keV with no energy dependence. Comparison with previous soft X-ray observations in the 0.3-12 keV with XMM-Newton reveals a mild softening only below 3 keV at superior conjunction of the NS. This suggests the possible contribution of the NS atmosphere to be confirmed with deeper soft X-ray observations than acquired so far.
-
•
We derive a 3 upper limit to the modulation fraction above 25 keV of , which suggests that the electron population contributing to the shock emission at these energies is subject to different acceleration.
-
•
The folded orbital light curves in common energy ranges as observed over three epochs by NuSTAR and XMM-Newton reveal changes in the amplitude over the years, indicating that the shock is not stationary and varies with time since J1227 transitioned into a rotation-powered state. We confirm previous finding of an anti-correlated variability between X-ray and optical ranges in the orbital modulation amplitudes.
-
•
We estimate for the shock luminosity in the 0.3-79 keV range , that is not enough alone to power the irradiation of the companion star unless the emission extends to the MeV range or the shock does not wrap the pulsar.
-
•
A search for X-ray pulses in the 3-79 keV range provides us with an upper limit to the rms pulse amplitude of , compatible with the upper limit derived in the 0.3-10 keV band from previous XMM-Newton data.
Acknowledgments
This work is based on observations obtained with the NASA science mission NuSTAR, with XMM-Newton, an ESA science mission with instruments and contributions directly funded by ESA Member States, with Swift, a NASA science mission with Italian participation, with Parkes telescope and with Gaia, an ESA mission. Gaia data are processed by the Data Processing and Analysis Consortium (DPAC). This work made use of data supplied by the UK Swift Science Data Centre at the University of Leicester. DdM, AP and TMB acknowledge financial support from the Italian Space Agency (ASI) and National Institute for Astrophysics (INAF) under agreements ASI-INAF I/037/12/0 and ASI-INAF n.2017-14-H.0 and from INAF ”Sostegno alla ricerca scientifica main streams dell’INAF”, Presidential Decree 43/2018. DdM, AP, MB and AP also acknowledge support from INAF ”SKA/CTA projects”, Presidential Decree N. 70/2016. DFT acknowledges support from the grants PGC2018-095512-B-I00, SGR2017-1383, and AYA2017-92402-EXP. FCZ is supported by a Juan de la Cierva fellowship and grants SGR2017-1383 and PGC2018-095512-B-I00. We also thank the ”PHAROS” COST Action (CA16214) for partial support. We also acknowledge useful discussion with Dr. A. Sanna on the NuSTAR data timing analysis.
References
- Al Noori et al. (2018) Al Noori H., et al., 2018, ApJ, 861, 89
- Alpar et al. (1982) Alpar M. A., Cheng A. F., Ruderman M. A., Shaham J., 1982, Nature, 300, 728
- Ambrosino et al. (2017) Ambrosino F., et al., 2017, Nature Astronomy, 1, 854
- Archibald et al. (2009) Archibald A. M., et al., 2009, Science, 324, 1411
- Archibald et al. (2010) Archibald A. M., Kaspi V. M., Bogdanov S., Hessels J. W. T., Stairs I. H., Ransom S. M., McLaughlin M. A., 2010, ApJ, 722, 88
- Archibald et al. (2013) Archibald A. M., Kaspi V. M., Hessels J. W. T., Stappers B., Janssen G., Lyne A., 2013, preprint, (arXiv:1311.5161)
- Archibald et al. (2015) Archibald A. M., et al., 2015, ApJ, 807, 62
- Arons & Tavani (1993) Arons J., Tavani M., 1993, ApJ, 403, 249
- Backer et al. (1982) Backer D. C., Kulkarni S. R., Heiles C., Davis M. M., Goss W. M., 1982, Nature, 300, 615
- Bailer-Jones et al. (2018) Bailer-Jones C. A. L., Rybizki J., Fouesneau M., Mantelet G., Andrae R., 2018, AJ, 156, 58
- Bassa et al. (2014) Bassa C. G., et al., 2014, MNRAS, 441, 1825
- Bellm et al. (2016) Bellm E. C., et al., 2016, ApJ, 816, 74
- Bogdanov et al. (2014) Bogdanov S., Patruno A., Archibald A. M., Bassa C., Hessels J. W. T., Janssen G. H., Stappers B. W., 2014, ApJ, 789, 40
- Bogdanov et al. (2015) Bogdanov S., et al., 2015, ApJ, 806, 148
- Bogdanov et al. (2018) Bogdanov S., et al., 2018, ApJ, 856, 54
- Broderick et al. (2016) Broderick J. W., et al., 2016, MNRAS, 459, 2681
- Burderi et al. (2001) Burderi L., et al., 2001, ApJ, 560, L71
- Burrows et al. (2005) Burrows D. N., et al., 2005, Space Sci. Rev., 120, 165
- Campana & Di Salvo (2018) Campana S., Di Salvo T., 2018, in Rezzolla L., Pizzochero P., Jones D. I., Rea N., Vidaña I., eds, Astrophysics and Space Science Library Vol. 457, The Physics and Astrophysics of Neutron Stars. pp 149–184 (arXiv:1804.03422), doi:10.1007/978-3-319-97616-7˙4
- Campana et al. (2019) Campana S., Miraval Zanon A., Coti Zelati F., Torres D. F., Baglio M. C., Papitto A., 2019, A&A, 629, L8
- Canto et al. (1996) Canto J., Raga A. C., Wilkin F. P., 1996, ApJ, 469, 729
- Cho et al. (2018) Cho P. B., Halpern J. P., Bogdanov S., 2018, ApJ, 866, 71
- Cordes & Lazio (2002) Cordes J. M., Lazio T. J. W., 2002, preprint, (arXiv:astro-ph/0207156)
- Coti Zelati et al. (2014) Coti Zelati F., et al., 2014, MNRAS, 444, 1783
- D’Angelo & Spruit (2012) D’Angelo C. R., Spruit H. C., 2012, MNRAS, 420, 416
- de Martino et al. (2010) de Martino D., et al., 2010, A&A, 515, A25
- de Martino et al. (2013) de Martino D., et al., 2013, A&A, 550, A89
- de Martino et al. (2014) de Martino D., et al., 2014, MNRAS, 444, 3004
- de Martino et al. (2015) de Martino D., et al., 2015, MNRAS, 454, 2190
- Deneva et al. (2016) Deneva J. S., et al., 2016, ApJ, 823, 105
- Dubus et al. (2010) Dubus G., Cerutti B., Henri G., 2010, A&A, 516, A18
- Dubus et al. (2015) Dubus G., Lamberts A., Fromang S., 2015, A&A, 581, A27
- Ertan (2017) Ertan Ü., 2017, MNRAS, 466, 175
- Evans et al. (2009) Evans P. A., et al., 2009, MNRAS, 397, 1177
- Ferrigno et al. (2014) Ferrigno C., et al., 2014, A&A, 567, A77
- Gaia Collaboration et al. (2018) Gaia Collaboration et al., 2018, A&A, 616, A1
- Harrison et al. (2013) Harrison F. A., et al., 2013, ApJ, 770, 103
- Hobbs et al. (2006) Hobbs G. B., Edwards R. T., Manchester R. N., 2006, MNRAS, 369, 655
- Hui et al. (2015) Hui C. Y., et al., 2015, ApJ, 801, L27
- Jennings et al. (2018) Jennings R. J., Kaplan D. L., Chatterjee S., Cordes J. M., Deller A. T., 2018, ApJ, 864, 26
- Johnson et al. (2014) Johnson T. J., et al., 2014, ApJS, 213, 6
- Johnson et al. (2015) Johnson T. J., et al., 2015, ApJ, 806, 91
- Kandel et al. (2019) Kandel D., Romani R. W., An H., 2019, ApJ, 879, 73
- Keith et al. (2010) Keith M. J., et al., 2010, MNRAS, 409, 619
- Kennel & Coroniti (1984) Kennel C. F., Coroniti F. V., 1984, ApJ, 283, 710
- Kong et al. (2017) Kong A. K. H., Hui C. Y., Takata J., Li K. L., Tam P. H. T., 2017, ApJ, 839, 130
- Leahy (1987) Leahy D. A., 1987, A&A, 180, 275
- Linares (2014) Linares M., 2014, ApJ, 795, 72
- Lindegren et al. (2018) Lindegren L., et al., 2018, A&A, 616, A2
- Lorimer & Kramer (2005) Lorimer D., Kramer M., 2005, The Observatory, 125, 338
- Lorimer et al. (2006) Lorimer D. R., et al., 2006, MNRAS, 372, 777
- Papitto & Torres (2015) Papitto A., Torres D. F., 2015, ApJ, 807, 33
- Papitto et al. (2013) Papitto A., et al., 2013, Nature, 501, 517
- Papitto et al. (2014) Papitto A., Torres D. F., Rea N., Tauris T. M., 2014, A&A, 566, A64
- Papitto et al. (2015) Papitto A., de Martino D., Belloni T. M., Burgay M., Pellizzoni A., Possenti A., Torres D. F., 2015, MNRAS, 449, L26
- Papitto et al. (2019) Papitto A., et al., 2019, ApJ, 882, 104
- Patruno et al. (2014) Patruno A., et al., 2014, ApJ, 781, L3
- Ritter et al. (2000) Ritter H., Zhang Z.-Y., Kolb U., 2000, A&A, 360, 969
- Rivera Sandoval et al. (2018) Rivera Sandoval L. E., et al., 2018, MNRAS, 476, 1086
- Roberts et al. (2015) Roberts M. S. E., McLaughlin M. A., Gentile P. A., Ray P. S., Ransom S. M., Hessels J. W. T., 2015, preprint, (arXiv:1502.07208)
- Roberts et al. (2018) Roberts M. S. E., et al., 2018, in Weltevrede P., Perera B. B. P., Preston L. L., Sanidas S., eds, IAU Symposium Vol. 337, Pulsar Astrophysics the Next Fifty Years. pp 43–46 (arXiv:1801.09903), doi:10.1017/S1743921318000480
- Romani & Sanchez (2016) Romani R. W., Sanchez N., 2016, ApJ, 828, 7
- Romani et al. (2015) Romani R. W., Graham M. L., Filippenko A. V., Kerr M., 2015, ApJ, 809, L10
- Roming et al. (2005) Roming P. W. A., et al., 2005, Space Sci. Rev., 120, 95
- Roy et al. (2015) Roy J., et al., 2015, ApJ, 800, L12
- Rybicki & Lightman (1979) Rybicki G. B., Lightman A. P., 1979, Radiative processes in astrophysics. New York: Wiley-Interscience
- Sanchez & Romani (2017) Sanchez N., Romani R. W., 2017, ApJ, 845, 42
- Sanna et al. (2017) Sanna A., et al., 2017, MNRAS, 466, 2910
- Sironi & Spitkovsky (2011a) Sironi L., Spitkovsky A., 2011a, ApJ, 726, 75
- Sironi & Spitkovsky (2011b) Sironi L., Spitkovsky A., 2011b, ApJ, 741, 39
- Sironi et al. (2015) Sironi L., Keshet U., Lemoine M., 2015, Space Sci. Rev., 191, 519
- Standish (1998) Standish E. M., 1998, A&A, 336, 381
- Stappers et al. (2014) Stappers B. W., et al., 2014, ApJ, 790, 39
- Staveley-Smith et al. (1996) Staveley-Smith L., et al., 1996, PASA, 13, 243
- Strader et al. (2019) Strader J., et al., 2019, ApJ, 872, 42
- Takata et al. (2014) Takata J., et al., 2014, ApJ, 785, 131
- Tendulkar et al. (2014) Tendulkar S. P., et al., 2014, ApJ, 791, 77
- Thorstensen & Armstrong (2005) Thorstensen J. R., Armstrong E., 2005, AJ, 130, 759
- Torres (2018) Torres D. F., 2018, Nature Astronomy, 2, 247
- Torres et al. (2017) Torres D. F., Ji L., Li J., Papitto A., Rea N., de Oña Wilhelmi E., Zhang S., 2017, ApJ, 836, 68
- Torres et al. (2019) Torres D. F., Viganò D., Coti Zelati F., Li J., 2019, MNRAS, 489, 5494
- Turner et al. (2001) Turner M. J. L., et al., 2001, A&A, 365, L27
- Vaughan et al. (1994) Vaughan B. A., et al., 1994, ApJ, 435, 362
- Veledina et al. (2019) Veledina A., Nättilä J., Beloborodov A. M., 2019, ApJ, 884, 144
- Venter et al. (2012) Venter C., Johnson T. J., Harding A. K., 2012, ApJ, 744, 34
- Wadiasingh et al. (2017) Wadiasingh Z., Harding A. K., Venter C., Böttcher M., Baring M. G., 2017, ApJ, 839, 80
- Wadiasingh et al. (2018) Wadiasingh Z., Venter C., Harding A. K., Böttcher M., Kilian P., 2018, ApJ, 869, 120
- Yao et al. (2017) Yao J. M., Manchester R. N., Wang N., 2017, ApJ, 835, 29