Long-term Periodicities in North–South Asymmetry of Solar Activity and Alignments of the Giant Planets
Abstract
The existence of 12-year and 51-year periodicities in the north–south asymmetry of solar activity is well known. However, the origin of these as well as the well-known relatively short periodicities in the north–south asymmetry is not yet clear. Here we have analyzed the combined daily data of sunspot groups reported in Greenwich Photoheliographic Results (GPR) and Debrecen Photoheligraphic Data (DPD) during the period 1874 – 2017 and the data of the orbital positions (ecliptic longitudes) of the giant planets in ten-day intervals during the period 1600 – 2099. Our analysis suggests that 12-year and 51-year periodicities in the north–south asymmetry of solar activity are the manifestations of the differences in the strengths of 11-year and 51-year periodicities of activity in the northern- and southern-hemispheres. During the period 1874 – 2017 the Morlet wavelet power spectrum of the north–south asymmetry of sunspot-group area and that of the mean absolute difference () of the orbital positions of the giant planets are found to be similar. Particularly, there is a suggestion that the 12-year and 51-year periodicities in the north–south asymmetry of sunspot-group area occurred during approximately the same times as the corresponding periodicities in . Therefore, we suggest that there could be influence of some specific configurations of the giant planets in the origin of the 12-year and 50-year periodicities of the north–south asymmetry of solar activity.
keywords:
Sun: Dynamo – Sun: Solar activity – (Sun): Solar system dynamics1 Introduction
The existence of the 12-year and 40 – 50-year periodicities in the north–south asymmetry of solar activity has been reported by a number of authors.\inlinecitecob93 analyzed the combined GPR (1874 – 1983) and United States Air Force (1983 – 1989) data of sunspot groups and found that only a 12.1-year periodicity is statistically significant in the north–south asymmetry of sunspot area. \inlineciteyi92 was first to point out that in the north–south asymmetry, derived by using the conventional formula (relative asymmetry), the 11 – 12-year periodicity is mostly an artifact of the 11-year cycle of the denominator , where and are the quantities of the activity in northern and southern hemispheres, respectively. \inlinecitejg97 verified this by determining separately the power spectra of the and the (absolute asymmetry) of the sunspot data. They found that a peak at year-1 frequency in the power spectrum of is statistically insignificant and the same peak in the spectrum of is statistically very significant (see Figure 7 in \opencitejg97). Obviously, they have confirmed the doubt of \inlineciteyi92. \inlineciteboc05 have done the same. However, the statistical error in the relative asymmetry, , is much smaller than that of the absolute asymmetry, (\opencitejg97). Therefore, variations of the relative asymmetry could be more reliable than those of the absolute asymmetry. \inlinecitejg97 have also shown the existence of 50-year periodicity in both the relative asymmetry and the absolute asymmetry, and a 8 – 9-year periodicity in the absolute asymmetry. Similar periods were also noticed by \inlineciteboc05. \inlineciteknaack04 by using a wavelet analysis, studied the long-term periodicities in the north–south asymmetry of the monthly averaged sunspot areas (1874 – 2003) and found the existence of the 12-year and 43-year periodicities in the relative asymmetry of the sunspot area. Similar periodicities in the relative north–south asymmetry of the areas of different size sunspot groups were also seen by \inlinecitemb16, using the Kodaikanal white-light digitized archive sunspot observations (1921 – 2011). \inlinecitedeng16 from the wavelet analysis of sunspot areas of Solar Cycles 9 – 14 found the existence of 9-year and 51-year periodicities in both the relative asymmetry and the absolute asymmetry of sunspot area, and a 12-year periodicity in the relative asymmetry only. Recently, \inlinecitejj19 studied cycle-to-cycle modulations in the relative north–south asymmetry of solar-cycle maximum and minimum and found that there exists a 30 – 50-year periodicity in the asymmetry of minimum and a possibility of the existence of a much longer (mostly substantially more than 100 years) periodicity in the asymmetry of maximum. Overall, the existence of 8 – 12-year and 40 – 50-year periodicities in the north–south asymmetry of solar activity is somewhat established from observational studies. \inlineciteverma93 detected the existence of a 110-year periodicity in the relative north–south asymmetry of solar activity (also see \openciteli02; \openciteli19). \inlinecitebo11 by using the method of Spectral Variation Analysis found the existence of long periods of phase shifts between northern- and southern-hemisphere’s activity.
The physical reason of the long periodicities as well as the well-known relatively short periodicities (170 – 180-day, 320 – 329-day, 1.5-year, 1.8-year, 2.1-year, 3.6-year, ; see \openciteknaack04; \openciterj15 and the references therein) in the north–south asymmetry is not yet clear. Recently, \inlinecitesc18 showed that around 8.5-year and 30 – 50-year periods in the absolute asymmetry are the sum and beat periods of a 22-year period magnetic dipolar mode and a 13 – 15-year period quadrupolar mode. \inlinecitenep19 showed that long-term variations in the north–south asymmetry of solar activity resulting from short-term fluctuations in the -effect of solar dynamo. On the other hand, a number of authors suggested the existence of a connection between solar variability (both long- and short-terms) and planetary configurations (\opencitejose65; \opencitewood65; \opencitewood72; \opencitegj95; \opencitezaq97; \opencitejuc03; \opencitewolff10; \openciteabreu12; \opencitecc12; \opencitewil13; \opencitesalv13; \opencitesharp13; \opencitechow16; \opencitestef16; \opencitestef19). \inlinecitejj05 found the existence of a good agreement between the amplitudes of the variations in the Sun’s spin and the orbital angular momenta at the common epochs of the steep decreases in both the orbital angular momentum and the Sun’s equatorial rotation rate determined from sunspot data. Since the Sun’s equator is inclined to the ecliptic, the influences of configurations of the planets on solar activity may be different across the Sun’s equator (also see \opencitejuc00). Here we have analyzed the combined daily data of sunspot groups reported in GPR and DPD during the period 1874 – 2017 and the orbital positions (ecliptic longitudes) of the giant planets available for each ten-day interval during the period 1600 – 2099 and found that during the period 1874 – 2017 the Morlet wavelet power spectrum of the north–south asymmetry of sunspot-group area and that of the mean absolute difference () of the orbital positions of the giant planets are similar. The wavelet spectra suggest that 12 – 13-year and the 40 – 50-year periodicities in the north–south asymmetry of sunspot-group area exist during approximately the same times as the corresponding periodicities in . Therefore, we suggest that there could be influence of some configurations of the giant planets in the origin of 12-year and 40 – 50-year periodicities of the north–south asymmetry of solar activity.
In the next section we describe the data analysis, in Section 3 we present the results, and in Section 4 we summarize the conclusions and discuss them briefly.
2 Data analysis
Recently, \inlinecitejj19 analyzed the GPR and DPD sunspot-group daily data during the period April 1874 – June 2017 (downloaded from fenyi.solarobs.unideb.hu/pub/DPD/) and derived the time series of the 13-month smoothed monthly mean corrected whole-spot areas of the sunspot groups in the Sun’s whole sphere (WSGA), northern hemisphere (NSGA), and southern hemisphere (SSGA). Here we have used these time series and derived the corresponding time series of both the relative north–south asymmetry (RNSA) and absolute north–south asymmetry (ANSA). The time series of the 13-month smoothed monthly mean values of the international sunspot number (ISSN) during the period 1874 – 2014 are downloaded from www.sidc.be/silso/datafiles (Source: WDC-SILSO, Royal Observatory of Belgium, Brussels). Here we have used the data on ecliptic longitudes (in degrees) , , , and of the giant planets Jupiter (J), Saturn (S), Uranus (U), and Neptune (N) in each 10-day interval during the period 1600 – 2099. These data were provided by Ferenc Varadi. He had derived these data using the Jet Propulsion Laboratory (JPL) DE405 ephemeris (\openciteseid92; \opencitestan98) for the period 1600 – 2099. We determined the average value () of the absolute differences , , , , , and in each ten-day interval during the period 1600 – 2099. The values of the absolute differences that are greater than are converted as minus the absolute difference. This is because of here we use minimum unsigned difference between the ecliptic longitudes (have values – ) of any two planets (we have not done this in the preliminary results reported in \opencitejj18, where we compared the variations in the amplitudes of solar cycles and ). From the wavelet transformation both time and frequency localization can be obtained (for more detail see \opencitetc98). We have used the IDL codes of Morlet wavelet power spectral analysis, cross-wavelet transformation (XWT), and wavelet coherence (WCOH) provided by \inlinecitetc98. We have downloaded these from paos.colorado.edu/research/wavelets. The cross-wavelet spectrum reveals localized similarity (covariance) in time and scale (period). WCOH is a normalized time and scale (period) resolved measure for the relationship between two time series (also see \opencitemk04). A number of authors used XWT and WCO to study asynchronous behavior of northern and southern hemispheres activity (, \openciteli10; \opencitedeng16, and the references therein). We made Morlet wavelet power spectral analysis of NSGA, SSGA, RNSA, and ANSA and compared the power spectra. We also made the Morlet wavelet spectral analysis of and compared the wavelet power spectra of , RNSA, and ANSA. In addition, we have applied XWT and WCOH to the time series of these parameters to confirm the similarities seen in the Morlet wavelet power spectra of these parameters.
3 Results
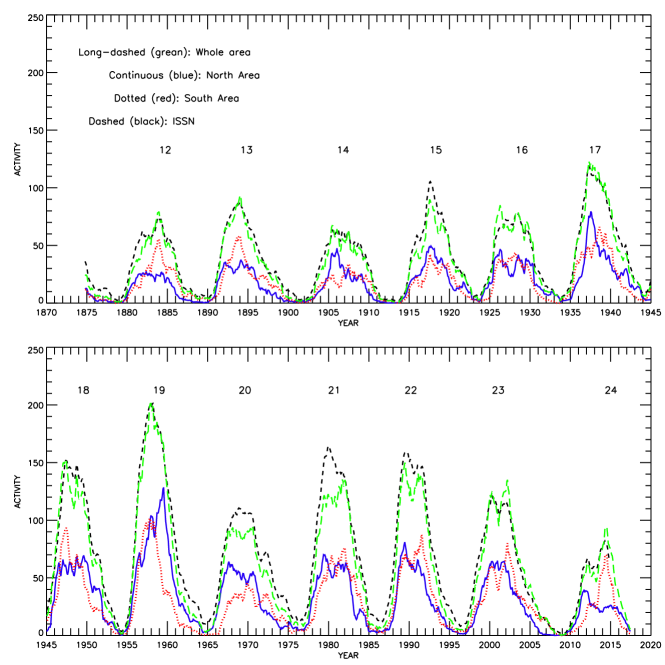
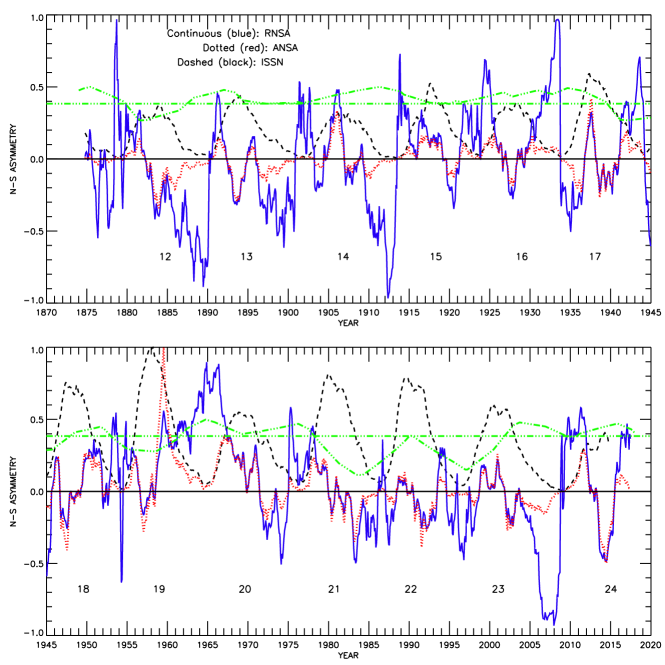
Figure 1 shows the variations in the 13-month smoothed monthly mean WSGA, NSGA, and SSGA during the period 1874 – 2017, and the variation in ISSN () during the period 1874 – 2014. This figure is a slightly modified (clarity improved) version of the Figure 1 of \inlinecitejj19. Figure 2 shows the variations in the relative north–south asymmetry, RNSA, and in the absolute north–south asymmetry, ANSA, determined from the 13-month smoothed monthly mean NSGA and SSGA during the period 1874 – 2017. In this figure the variation in values of ten-day intervals during the period 1874 – 2017 and the variation in ISSN during the period 1874 – 2014 are also shown. As can be seen in this figure, both the RNSA and the ANSA are considerably vary. The variation in RNSA is much more pronounced than that in ANSA. Obviously, the variations of RNSA and ANSA are considerably different. A major difference is during the minima of a majority of solar cycles RNSA is much larger than that of during the maxima. The behavior of ANSA is somewhat opposite to it. However, still there exists a high correlation between RNSA and ANSA (correlation coefficient ). During the late Maunder minimum the activity pattern, the large north–south asymmetry in the activity (see \opencitesoko94) is consistent with the aforementioned behavior of RNSA. There are 11-year cycles in all RNSA, ANSA, and . However, there is a suggestion that no appreciable correlation between ISSN and any of the parameters RNSA, ANSA, and . There are patterns (around 1885 – 1955 and 1965 – 2015) of about 40 – 60-year cycles in . Such a pattern seems to exist also in RNSA and ANSA, but it is not visible clearly.
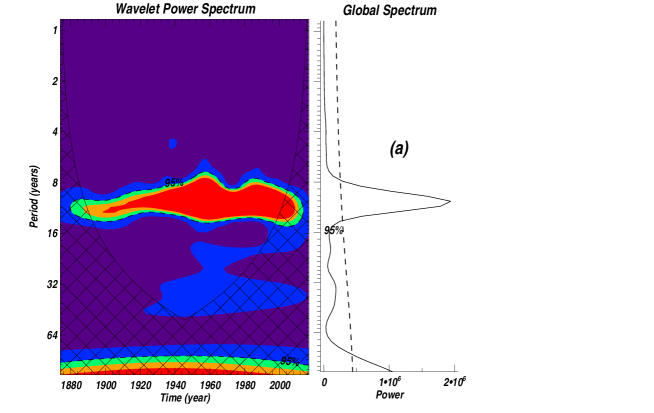
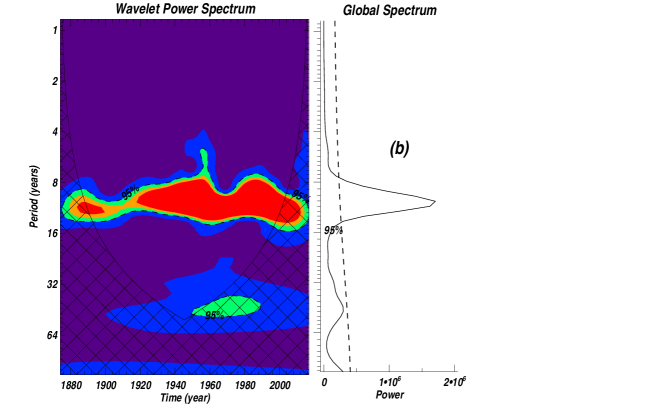
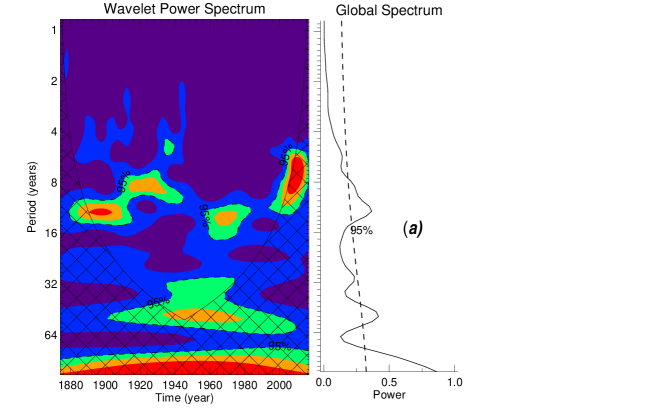
Figures 3a and 3b show the Morlet wavelet power spectra, and the corresponding global spectra, of NSGA and SSGA, respectively. As can be seen in these figures, obviously an 11-year periodicity exists in both NSGA and SSGA and dominant almost throughout the period 1874 – 2017. There is also a suggestion on the existence of a relatively much weaker 50-year periodicity in both the NSGA and the SSGA, but after around 1920. In the Morlet wavelet and global spectra of WSGA, which are not shown here, besides the much stronger 11-year periodicity, a very weak 50-year periodicity is seen.
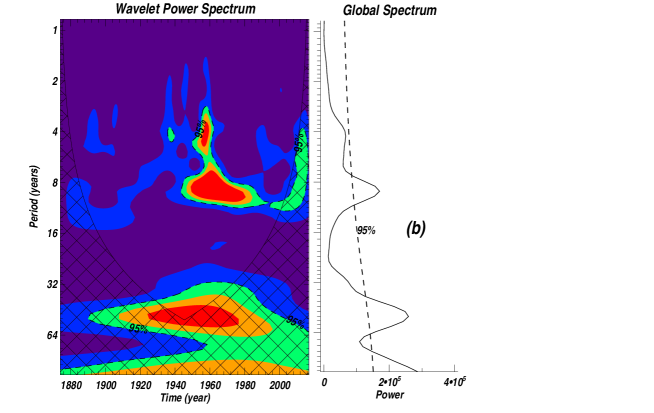
Figures 4a and 4b show the Morlet wavelet power spectra, and the corresponding global spectra, of the relative north–south asymmetry, RNSA, and the absolute north–south asymmetry, ANSA, respectively. As can be seen in these figures a 12.8-year periodicity exists in RNSA and a 9.6 year periodicity exists in ANSA. However, there is a strong suggestion that each of these periods vary with time considerably (from 8 to 16 years) and systematically. That is, a large change of this periodicity seems to be occurring in alternate 30 – 35 years, mainly in the case of RNSA. That is, in the case of RNSA a 12.8-year periodicity was strong around the period 1880 – 1920, a 9-year period was strong around the period 1920 – 1950, a 12.8-year period was strong around the period 1960 – 1990, and than onwards a 9-year periodicity is strong. Such clear alternate patterns are not present in ANSA, but overall variations in the 12.8-year periodicity of RNSA and in the 9-year periodicity of ANSA are the same. In ANSA the 9-year periodicity was strong only around the period 1945 – 1985. There is a suggestion on the existence of a 51-year periodicity (poorly resolved) in both RNSA and ANSA and it was strongly present during the period 1900 – 1990. The global spectrum of RNSA suggests that the strengths of the 12.8-year and the 51-year periodicities in RNSA are almost equal (the former is only slightly weaker than the latter) in RNSA, whereas the global spectrum of ANSA suggests that in ANSA the 51-year periodicity is considerably stronger than the 9-year periodicity. Besides the existence of these periodicities, there are episodes of a 4 – 5-year periodicity in both RNSA and ANSA. This periodicity was strong in RNSA around 1960. \inlinecitedd96 found a strong 35-year periodicity in the north–south asymmetry of solar filament activity during 1919 – 1989. A 32-year periodicity is also present in RNSA (see Figure 4a), but it is relatively very weak.
As can be seen in Figure 3 in the global spectra the peak at 11-year period of SSGA is slightly smaller than that of NSGA, whereas the peak of 50-year period of SSGA slightly larger (close to the 95% confidence level) than that in NSGA (much less than 95% confidence level). Therefore, the 12.8-year and 51-year periodicities in RNSA and the 9-year and 51-year periodicities in ANSA are look to be resulted due to the aforementioned differences in the strengths of 11-year and 50-year periodicities in NSGA and SSGA. In addition, the approximate two year difference exists between the 12.8-year/9-year period of RNSA/ANSA and 11-year period of NSGA and SSGA could be due to there exist 1 – 2 years differences in the positions (1 – 2-year phase difference) of the 11-year peaks of NSGA and SSGA (, \openciteng10; \opencitejj19, also see Figure 1). Overall, the 12-year and 51-year periodicities in the north–south asymmetry of solar activity seem to be manifestations of the differences in the strengths of 11-year and 51-year periodicities of activity in northern- and southern-hemispheres. As already mentioned in Section 1, the statistical error in the relative asymmetry, RNSA, is much smaller than that of the absolute asymmetry, ANSA (see \opencitejg97). Therefore, the variations of RNSA can be more reliable than the variations of ANSA. That is, the 12.8-year and 51-year periodicities of RNSA are more reliable than the 9-year and 51-year periodicities of ANSA.
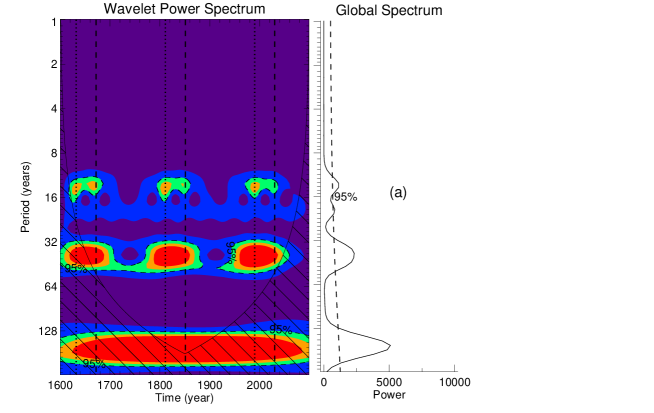
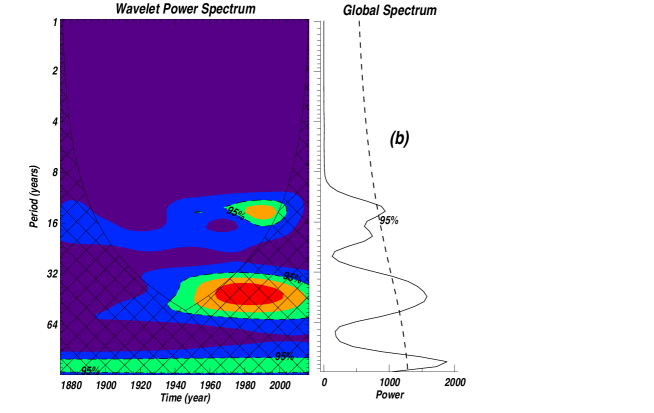
Figure 5a shows the Morlet wavelet and global power spectra of in ten-day intervals during the periods 1600 – 2099. In this figure the epochs of the steep decrease in the orbital angular momentum of the Sun are also shown (also see \opencitejj05, 2017). Figure 5b shows the wavelet and global power spectra of in ten-day intervals during the periods 1874 – 2017. We compare this figure with Figures 4a and 4b, the wavelet spectra of RNSA and ANSA for the period 1874 – 2017. As can be seen in Figure 5a, there exist 13.6-year and 41.6-year periodicities in around the years 1632, 1672, 1811, 1851, 1990, and 2030, when there was steep decrease in the Sun’s orbital angular momentum about the solar system barycenter caused by some specific configurations of the giant planets (see \opencitejj05). The well-known 179-year period of the Sun’s orbital angular momentum (\opencitejose65) is obviously exists in (however, most of the power spectral region of this period is within the region of cone of influence). In addition, relatively a very weak 20-year periodicity exists in , continuously throughout the 1600 – 2099. The wavelet and the global spectra of RNSA and ANSA are somewhat closely match with that of shown Figure 5b. Particularly, there is a suggestion that the 12 – 13-year and 40 – 50-year periodicities in RNSA and ANSA were occurred during approximately the same times as the corresponding periodicities in . In the global spectra of both north–south asymmetry of sunspot area and there is a suggestion that an increase of power with an increase in the value of period. That is, there is a suggestion that not only the values of the aforementioned periods of the north–south asymmetry of solar activity and and their timings match, the relative powers of these periods are also approximately match. Therefore, we suggest that there could be influence of some specific configurations of the giant planets in the origin of 12-year and 40 – 50-year periodicities of the north–south asymmetry of solar activity.
The power spectral area of the 51 periodicity in RNSA and ANSA is within the region of cone of influence in the corresponding wavelet power spectra. That is, the available 144 years data of sunspot groups used here are not adequate for accurately determining this periodicity in RNSA and ANSA from wavelet analysis. On the other hand, as can be seen in Figure 5a, the existence of a 40 – 50-year periodicity in is very clear in the data during 1600 – 2099. In view of this, the corresponding periodicity in obtained from the data during the period 1874 – 2017 may be reliable in spite of most of its power spectral area is within the region of the cone of influence. This may imply that the existence of this periodicity seen in the wavelet power spectra of RNSA and ANSA is mostly reliable. Moreover, the 50-year peaks in the Global power spectra of the north-south asymmetry are statistically significant on much more than 95% confidence level. This periodicity in north–south asymmetry of solar activity is found to be statistically significant in the fast Fourier transform and periodogram analyses (, \opencitejg97; \opencitedeng16). The 40 – 50-year periodicity in is not continuously present throughout the period 1600 – 2099 (see Figure 5a). In particular, as already mentioned above, this periodicity, and even the 12-year periodicity, in seem to present strongly around the epochs where the Sun’s orbital motion is retrograde. Hence, around such occasions the 12-year and 51-year periodicities may be occurring and strong in the north–south asymmetry of solar activity.
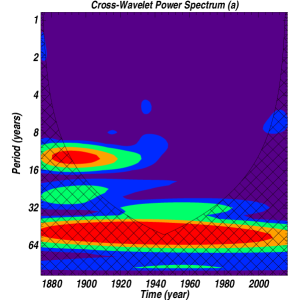
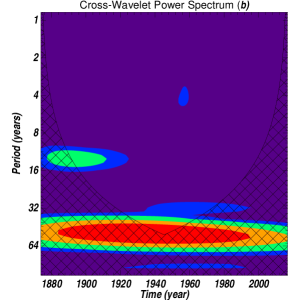
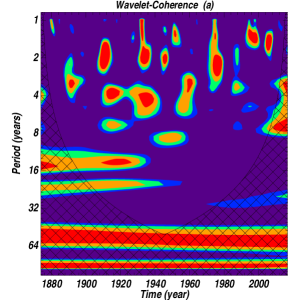
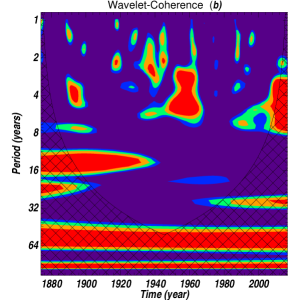
Figures 6a and 6b show the cross-wavelet power spectrum of RNSA and that of and ANSA and , respectively, during the period 1874 – 2017. These figures indicate a large similarities (covariance) exist between the time series of and north–south asymmetry in sunspot-group area at scale (period) 12-year mainly before 1940 and at the scale (period) 51-year throughout 1874 – 2017. Figures 7a and 7b show the wavelet-coherence of RNSA and and that of ANSA (normalized) and , respectively, during the period 1874 – 2017. In these figures there is a suggestion that the wavelet-coherence exists between and north–south asymmetry of solar activity at most of the known periodicities (including 1.5-year, 1.8-year, 2.1-year, 3.6-year, ) of the latter, at several times. However, in WCOH spectra spurious peaks can occur for the areas of low wavelet power (\opencitemk04). On the other hand, the wavelet-cross spectrum may not suitable for significance testing the interrelation between two processes. Therefore, wavelet-coherence may be very useful (\opencitemk04). Nevertheless, the wavelet cross spectra (Figures 6a and 6b), and even the WCOH spectra (Figures 7a and 7b), suggest that in the case of 12-year periodicity, only before 1940 a large similarity (covariance) exists between the time series of and north-south asymmetry in sunspot-group area. In addition, the spectral region of 51-year periodicity is within the region of cone of influence. Therefore, the inference above, the influence of some specific configurations of the giant planets in the origin of 12-year and 51-year periodicities of north–south asymmetry of solar activity is only suggestive rather than compelling.
4 Conclusions and Discussion
The existence of 12-year and 51-year periodicities in the north–south asymmetry of solar activity seems to be established to some extent by now from observational point of view. However, the physical reason of these as well as the known relatively short periodicities in the north–south asymmetry is not yet clear. Here we have analyzed the combined daily data of sunspot groups reported in GPR and DPD during the period 1874 – 2017 and the data of the orbital positions (ecliptic longitudes) of the giant planets in ten-day intervals during the period 1600 – 2099. Our analysis suggests that the 12-year and 51-year periodicities in the north–south asymmetry of solar activity could be manifestations of the differences in the strengths of 11-year and 51-year periodicities of activity in northern- and southern-hemispheres. During the period 1874 – 2017 the Morlet wavelet power spectra of the north–south asymmetry of sunspot-group area and the mean absolute difference () of the orbital positions of the giant planets are found to be similar. Particularly, the wavelet spectra suggest that the 12 – 13-year and 40 – 50-year periodicities in the north–south asymmetry of sunspot area occurred during approximately the same times as the corresponding periodicities in . In addition, the relative powers of these periods of the north–south asymmetry and are also found to be matched. Therefore, we suggest that there could be influence of some specific configurations of the giant planets in the origin of the 12 – 13-year and 40 – 50-year periodicities in the north–south asymmetry of solar activity.
Depending on the torque acting on the system, the angular momentum of the system might be conserved in only one or two directions but not all the directions. The net torque on the Sun (an extended body) due to gravitational force of the planets may not be always zero, though it is small. That is, there could be some changes in the solar differential rotation rate due to the external forces on the Sun (, \opencitezaq97) and hence, in the strength of solar dynamo, suggesting planetary configurations have an influence in solar variability. However, a planetary influence on solar activity, even if it exists, seems to be negligibly small (\opencitedej05). There is a continuous progress on this topic. \inlineciteabreu12 suggested that variations in solar rotation through time-dependent torque exerted by the planets on the non-spherical solar tachocline responsible for the solar cycle and other variations of solar activity. \inlinecitewil13 constructed a Venus–Earth–Jupiter spin–orbit coupling model. According to this model net tangential torques due to time dependent alignments of Venus, Earth, and Jupiter act upon the outer convective layers of the Sun with periodicities that match many of the long-term solar cycles. \inlinecitestef16 and \inlinecitestef19 have shown that tidal force induced by the Venus–Earth–Jupiter system affect solar dynamo through resonant excitation of the oscillation of the -effect.
When the Sun’s orbital angular momentum was close to zero (the Sun was close to the barycenter), the solar equatorial rotation rate was also considerably low (the steep decreases in the Sun’s spin and orbital angular momenta have the same value, g cm2 s-1; see \opencitejj05), suggesting that the differential rotation rate was considerably low, a weak dynamo. That is, at least the Sun’s retrograde orbital motion about the solar system barycenter may influence the solar dynamo and may be responsible for the grand minima, such as Maunder minimum (also see \opencitecc12). Although the altitude of planetary tidal waves on the Sun is of the order of only one millimeter (, \opencitecs75), it may be enlarged appreciably at the times of some alignments of the Jupiter with other planets. There may be a complicated coupling between the variation in the rotation rate caused by some specific alignments of the tide rising planets (Venus, Earth, and Jupiter) and the variation in the orbital motion of the Sun due to some specific alignments of the giant planets. Depending on the differences among the angular inclinations of the orbits of planets to the ecliptic (in the heliocentric co-ordinate system), during a specific configuration of planets the maximum angular distances of the planets above and below the ecliptic (or invariant plane) cause the maximum north–south asymmetry in the distribution of mass and angular momentum in the solar system. \inlinecitejj03 showed the presence of the periods of the alignments of two or more giant planets in both the solar differential rotation and its north–south asymmetry determined from the sunspot-group data during the period 1879 – 1976. As suggested by \inlinecitegj95, variations in the north–south asymmetry of solar activity may represent anti-symmetric global modes of solar magnetic oscillations and the perturbations needed for all the global modes of solar magnetic oscillations may be provided by some specific configurations of the planets. Moreover, besides there exists a considerable north–south asymmetry in both the solar differential rotation and the meridional flow, a reasonable correlation also exists between solar cycle variations of the differential rotation rate and the meridional motion of sunspot groups (\openciteju06). \inlinecitejhs17 found the existence of a highly statistical significant correlation between the solar meridional flow and the Sun’s orbital torque during the Solar Cycle 23. Recent numerical simulations from a flux transport dynamo model show importance of time variation and north–south asymmetry in meridional circulation in producing differing solar cycles in the northern- and southern-hemispheres (\opencitebd13). We think that the effect of differences in the time-dependent configurations of planets above and below the ecliptic may be responsible for variations in the north–south asymmetry of solar differential rotation and meridional circulation that are in turn responsible for the variations of north–south asymmetry in solar activity.
5 Acknowledgments
The author thanks anonymous referee for helpful comments and suggestions. The author is thankful to Ferenc Varadi for providing the entire planetary data used here. Wavelet software was provided by C. Torrence and G. Compo and is available at http://paos.colorado.edu/research/wavelets.
6 Disclosure of Potential Conflicts of Interest
The author declares that he has no conflicts of interest.
References
- Abreu et al. (2012) Abreu, J.A., Beer, J., Ferriz-Mas, A., McCracken K.G., Steinhilber, F.: 2012, Astron. Astrophys. 548, A88. DOI: 10.1051/0004-6361/20219997
- Ballester, Oliver, and Carbonell (2005) Ballester, J.L., Oliver, R., Carbonell, M.: 2005, Astron. Astrophys., 431, L5. DOI: 10.1951/0004-6361:200400135
- Badalym and Obridko (2011) Badalyan, O.G., Obridko, V.N.: 2011, New Astron. 16, 357. DOI: 10.1016/j.newast.2011.01.005
- Belucz and Dikpati (2013) Belucz, B., Dikpati, M.: 2013, Astrophys. J. 779, 4. DOI: 10.1088/0004-1075637X/779/1/4
- Carbonell, Oliver, and Ballester (1993) Carbonell, M., Oliver, R., Ballester, J.L.: 1993, Astron. Astrophys. 274, 497. DOI: 10.3847/0004-6256/151/3/70
- Chowdhury et al. (2016) Chowdhury, P., Gokhale, M.H., Singh, J., Moon, Y.-J.: 2016, Astrophys. Space Sci., 361, 54. DOI: 10.1007/s10509-015-2641-8
- Cionco and Compagnucci (2012) Cionco, R.G., Compagnucci, R.H.: 2012, Adv. Space Res. 50, 1434. DOI: 10.1016/j.asr.2012.07.013
- Condon and Schmidt (1975) Condon, J.J., Schmidt, R.R.: 1975, Solar Phys. 42, 529. DOI: 10.1007/BF00149930
- De Jager and Versteegh (2005) De Jager, C., Versteegh, G.: 2005, Solar Phys. 229, 175. DOI: 10.1007/s11207-005-4086-7
- Deng et al. (2016) Deng, L.H., Xiang, Y.Y., Qu, Z.N., An, J.M.: 2016, Asrophys. J. 151, 70. DOI: 10.3847/0004-6256/151/3/70
- Duchlev and Dermendjiev (1996) Duchlev, P.I., Dermendjiev, V.N.: 1996, Solar Phys. 168, 205. DOI: 10.1007/BF00145836
- Gokhale and Javaraiah (1995) Gokhale, M.H., Javaraiah, J.: 1995, Solar Phys. 156, 157. DOI: 10.1007/BF00669582
- Javaraiah (2003) Javaraiah, J.: 2003, Solar Phys. 212, 23. DOI: 10.10.1023/A:1022912430585
- Javaraiah (2005) Javaraiah, J.: 2005, Mon. Not. Roy. Astron. Soc. 362, 1311. DOI: 10.1111/j.1365-2966.2005.09403.x
- Javaraiah (2017) Javaraiah, J.: 2017, Solar Phys. 292, 172. DOI: 10.1007/s11207-017-1197-x
- Javaraiah (2018) Javaraiah, J.: 2018, In: Dr. Banerjee, J. Jiang, K. Kusano, S. Solanki, eds., Long-Term Datasets for the Understanding of Solar and Stellar Magnetic Cycles, Proc. IAU Symp., No. 340, P.263. DOI: 10.1017/S1743921318001321
- Javaraiah (2019) Javaraiah, J.: 2019, Solar Phys. 294, 64. DOI: 10.1007/s11207-019-442-6
- Javaraiah and Gokhale (1997) Javaraiah, J., Gokhale, M.H.: 1997, Solar Phys. 170, 389. DOI: 10.1023/A:1004928020737
- Javaraiah and Ulrich (2006) Javaraiah, J., Ulrich, R.K.: 2006, Solar Phys. 237, 245. DOI: 10.1007/s11207-006-0130-5
- Jose (1965) Jose P.D.: 1965, Astronomic. J. 70, 193. DOI: 10.1086/109714
- Juckett (2000) Juckett, D.A.: 2000, Solar Phys. 191, 201. DOI: 10.1023/A:1005226724316
- Juckett (2003) Juckett, D.A.: 2003, Astron. Astrophys. 399, 731. DOI: 10.1051/0004-6361:20021923
- Knaack et al. (2004) Knaack, R., Stenflo, J.O., Berdyugina, S.V.: 2004, Astron. Astrophys. 418, L17. DOI: 10.1051/0004-6361:20040107
- Li et al. (2019) Li, F.Y., Wang, J.X., Xiang, N.B., Xie, J.L., Xu, J.C.: 2019, Astrophys. J. 873, 121. DOI: 10.3847/1538-4357/ab06bf
- Li et al. (2010) Li, K.J., Gao, P.X., Zhan, L.S., Shi, X.J., Zhu, W.W.: 2010, Mon. Not. R. Astron. Soc., 401, 342. DOI: 10.1111/j.1365-2966.2009.15639.x
- Li et al. (2002) Li, K.J., Wang, J.X., Xiong, S.Y., Liang, H.F., Yun, H.S., Gu, X.M.: 2002, Astron. Astrophys. 383, 648. DOI: 10.1051/0004-6361:20011799
- Mandal and Banerjee (2016) Mandal, S., Banerjee, D.: 2016, Astrophys. J. Lett. 830, L33. DOI: 10.3847/2041-8205/830/2/L33
- Marun and Kurths (2016) Maraun, D., Kurths, J.: 2004, Nonlin. Proc. in Geophys., 11, 505. SRef-ID: 1607-7946/npg/2004-11-505.
- Nepomnyashchikh et al. (2019) Nepomnyashchikh, A., Mandal, S., Banerjee, D., Kitchatinov, L.: 2019, Astron. Astrophys. 625, A37. DOI: 10.1051/0004-6361/201935224
- Norton and Gallagher (2010) Norton, A.A., Gallagher, J. C.: 2010, Solar Phys. 261, 193. DOI: 10.1007/s11207-009-9479-6
- Ravindra and Javaraiah (2015) Ravindra, B., Javaraiah, J.: 2015, New Astron. 39, 55. DOI: 10.1016/j.newast.2015.03.004
- Schüssler and Cameron (2018) Schüssler, M., Cameron, R.H.: 2018, Astron. Astrophys., 618, A89. DOI: 10.1051/0004-6361/201833532
- Salvador (2013) Salvador, R.J.: 2013, Pattern Recogn. Phys. 1, 117. DOI: 10.5194/prp-1-117-2013
- Seidelmann (1992) Seidelmann, P.K.: 1992, Explanatory supplement to The Astronomical Almanac, revised edition. University Science Books, MillValley, CA, USA.
- Sharp (2013) Sharp, G.J.: 2013, Int. J. Astron. Astrophys., 3, 260. DOI: 10.4236/ijaa.2013.33031
- Shirley (2017) Shirley, J.H.: 2017, arXiv:1706.01854.
- Sokoloff and Nesme-Ribes (1994) Sokoloff, D., Nesme-Ribes, E.: 1994, Astron. Astrophys. 288, 293.
- Standish (1998) Standish, E.M.: 1998, JPL Planetary and Lunar Ephemerides, DE405/LE405, Interoffice Memo. 312.F-98-048. Jet Propulsion Laboratory, Pasadena, CA, 1998. (ftp,//navigator.jpl.nasa.gov/ephem/export/de405.iom)
- Stefani, Giesecke, and Weier (2019) Stefani, F, Giesecke, A., Weier, T.: 2019, Solar Phys. 294, 60. DOI: 10.1007/s11207-019-1447-1
- Stefani et al. (2016) Stefani, F, Giesecke, A., Weber, N., Weier, T.: 2016, Solar Phys. 291, 2197. DOI: 10.1007/s11207-016-0968-0
- Torrance and Compo (1998) Torrence, Ch., Compo, G.P.: 1998, Bull. Am. Meteor. Soc. 79, 61. DOI: 10.1175/1520-0477(1998)079¡0061,APGTWA¿2.0.CO;2
- Verma (1993) Verma, V.K.: 1993, Astrophys. J. 403, 797. DOI: 10.1086/172250
- Wilson (2013) Wilson, I.R.G.: 2013, Pattern Recog. Phys. 1, 147. DOI: 10.5194/prp-1-147-2013
- Wolff and Patrone (2010) Wolff, C.L., Patrone, P.N.: 2010, Solar Phys. 266, 227. DOI: 10.1007/s11207-010-9628-y
- Wood (1972) Wood, K.D.: 1972, Nature 240, 91. DOI: 10.1038/240091a0
- Wood and Wood (1965) Wood, R.M., Wood, K.D.: 1965, Nature 208, 129. DOI: 10.1038/208129a0
- Yi (1992) Yi, W.: 1992, J. Roy. Astron. Soc. Can. 86, 89.
- Zaqarashvili (1997) Zaqarashvili, T.V.: 1997, Astrophys. J. 487, 930. DOI: 10.1086/304629