88email: iris.breda@astro.up.pt
Stellar age gradients and inside-out star formation quenching in galaxy bulges
Radial age gradients hold the cumulative record of the multitude of physical processes driving the build-up of stellar populations and the ensuing star formation (SF) quenching process in galaxy bulges, therefore potentially sensitive discriminators between competing theoretical concepts on bulge formation and evolution. Based on spectral modeling of integral field spectroscopy (IFS) data from the CALIFA survey, we derive mass- and light-weighted stellar age gradients () within the photometrically determined bulge radius () of a representative sample of local face-on late-type galaxies that span 2.6 dex in stellar mass (8.9 log 11.5). Our analysis documents a trend for decreasing with increasing , with high-mass bulges predominantly showing negative age gradients and vice versa. The inversion from positive to negative occurs at log 10, which roughly coincides with the transition from lower-mass bulges whose gas excitation is powered by SF to bulges classified as Composite, LINER or Seyfert. We discuss two simple limiting cases for the origin of radial age gradients in massive LTG bulges. The first one assumes that the stellar age in the bulge is initially spatially uniform ( 0), thus the observed age gradients ( –3 Gyr/) arise from an inside-out SF quenching (ioSFQ) front that is radially expanding with a mean velocity . In this case, the age gradients for massive bulges translate into a slow ( 1-2 km s-1) ioSFQ that lasts until , suggesting mild negative feedback by SF or an AGN. If, on the other hand, negative age gradients in massive bulges are not due to ioSFQ but primarily due to their inside-out formation process, then the standard hypothesis of quasi-monolithic bulge formation has to be discarded in favor of a scenario that involves gradual buildup of stellar mass over 2-3 Gyr through, e.g., inside-out SF and inward migration of SF clumps from the disk. In this case, rapid ( 1 Gyr) AGN-driven ioSFQ cannot be ruled out. While the vs. relation suggests that the assembly history of bulges is primarily regulated by galaxy mass, its large scatter (1.7 Gyr/) reflects a considerable diversity that calls for an in-depth examination of the role of various processes (e.g., negative and positive AGN feedback, bar-driven gas inflows) with higher-quality IFS data in conjunction with advanced spectral modeling codes.
Key Words.:
galaxies: spiral – galaxies: bulges – galaxies: evolution1 Introduction
A key element in our understanding of bulge evolution in late-type galaxies (LTGs) revolves around the termination of their dominant mass assembly phase through star formation quenching (SFQ). This process is thought to result from different, perhaps non-mutually exclusive mechanisms, such as morphological quenching (stabilization of the disk against gas fragmentation once its center becomes dominated by a massive stellar spheroid, Martig et al., 2009; Genzel et al., 2014), inhibition of inflow of cold gas from the cosmic web due to virial shocks in the galactic halo (Dekel et al., 2009) or stripping away of the gaseous reservoir of galaxies in clusters (Larson et al., 1980, see also, Peng et al. 2015), or negative feedback by an active galactic nucleus (AGN; e.g., Silk, 1997; Di Matteo et al., 2005; Croton et al., 2006; Cattaneo et al., 2009).
Various lines of evidence suggest that SFQ is initiated once galaxy bulges have grown to a mass (Strateva et al., 2001) and a stellar surface density kpc-2 (Kauffmann et al., 2003; González-Delgado et al., 2016). Indeed, whereas in the local universe star formation (SF) is almost omnipresent in low-, low- bulges, it is steeply vanishing above a characteristic mass-density threshold log (10,9), as documented through multi-band photometry (e.g., Peng et al., 2010; Omand et al., 2014), single-aperture spectroscopy (e.g., Kauffmann et al., 2003; Brinchmann et al., 2004) and, more recently, spatially resolved integral field spectroscopy (IFS; e.g., Fang et al., 2013; Catalán-Torrecilla et al., 2017; Ellison et al., 2018; Woo & Ellison, 2019, BP18). For instance, Zibetti et al. (2017) report from an analysis of stellar indices for 394 galaxies from the CALIFA IFS survey (Sánchez et al., 2012) a bi-variate distribution of galaxy stellar populations on the vs. luminosity-weighted age plane, with old (log 10) quiescent E&S0 galaxies populating a high-density peak (log() 8.3), whereas younger (log 9.5) LTGs being confined to log() 8. Breda & Papaderos (2018, hereafter BP18) find from spatially resolved modeling of CALIFA IFS data for a representative sample of local LTGs that the contribution of stellar populations younger than 9 Gyr to the bulge -band mean surface brightness is tightly anti-correlated with and , showing a monotonous decrease from 60% in the lowest-mass bulges to 10% in the most massive and dense ones (log 11.3,9.7). This, and the fact that the bulge-to-disk age contrast increases with increasing (BP18) suggests that the assembly timescale of bulges scales inversely with galaxy mass, that is, the more massive a LTG is, the earlier it has experienced the dominant phase of its bulge build-up (what these authors termed sub-galactic downsizing), in agreement with earlier conclusions by Ganda et al. (2007). This trend also adds further support to the picture of inside-out galaxy growth (Eggen et al., 1962; Fall & Efstathiou, 1980; van den Bosch, 1998; Kepner, 1999), with the dense galaxy centers completing their assembly first while stellar mass continuing building up in the galaxy periphery, in agreement with previous findings (e.g., Muñoz-Mateos et al., 2007; Salim et al., 2012; Pérez et al., 2013; González-Delgado et al., 2014; Tacchella et al., 2015). At a higher redshift , the association between log and SFQ is established through abundance matching studies (van Dokkum et al., 2013), pixel-by-pixel SED fitting (Wuyts et al., 2012; Lang et al., 2014; Tacchella et al., 2015; Molseh et al., 2018) or empirical relations between rest-frame color and mass-to-light ratio (Szomoru et al., 2012).
The growth of stellar spheroids above log and the ensuing SFQ, appears to be accompanied by a gradual change in the dominant gas excitation mechanism: whereas nebular emission in low-mass bulges is typically powered by SF, the majority of bulges above log (for instance, 94% of those bulges in the sample of BP18) fall in the loci of Seyferts, LINERs (low-ionization nuclear emission-line regions; Heckman, 1980) and Composites. The affinity of quenched, high- stellar spheroids (bulges and early-type galaxies-ETGs) to LINER-specific emission-line ratios (e.g., Annibali et al., 2010; Yan & Blanton, 2012, see Kormendy & Ho 2013 for a review), recently documented with IFS out to several kpc from the nucleus (Papaderos et al., 2013; Singh et al., 2013; Gomes et al., 2016a), thereby adding justification to the generic term LIER (e.g. Belfiore et al., 2016), has been traditionally attributed to photoionization by old ( 100 Myr) post-AGB sources (Binette et al., 1994) or a weak AGN (Ho, 2008). Papaderos et al. (2013), on the other hand, argue that even a strong AGN cannot be ruled out in massive spheroids showing merely weak LINER emission (i.e. with an H equivalent width EW(H) 0.5 Å): this is because these authors (see also Gomes et al., 2016a) find that, in the absence of absorbing cold gas with a sufficient filling factor, the bulk of Lyc radiation from pAGB sources (consequently, also from a putative AGN) is escaping without being reprocessed into nebular emission. Indeed, the paucity of a cold medium in the nuclear region of quenched spheroids can be seen as natural consequence of depletion, thermalization and expulsion of gas by SF and eventually an AGN. If so, SFQ, LyC photon escape, and LI(N)ER emission are actually inseparable and causally linked facets of one and the same phenomenon, namely the partial or complete evacuation of cold gas from bulges and ETGs once they have grown above log, and AGN, if present, has fully unfold its energy impact.
Whereas there is broad consensus that the dense galaxy centers form and quench first (e.g. Tacchella et al., 2015, 2018, see also Lin et al. 2019), the timescale of inside-out SFQ (ioSFQ) in LTG bulges is poorly constrained. A circumstantial argument that the onset of accretion-powered nuclear activity above log does not universally initiate a rapid SFQ rests on the co-existence of bulges classified as Composite, LINER and Seyfert above log. This led BP18 to deduce a 2 Gyr, in agreement with estimates by Tacchella et al. (2015) from analysis of massive (10.84 log 11.7) galaxies at . Clearly, quantitative inferences on as a function of total and bulge mass are desirable, given that they could help discriminating between different proposed SFQ mechanisms. For instance, a short (e.g., on the order of the warm-gas sound crossing time of 600 Myr for a typical LTG bulge with 3 kpc) would be consistent with a single or several intermittent energetic episodes leading to quick gas removal (e.g., most plausibly, a strong AGN outburst or a series of nuclear starbursts), and otherwise with a gradual inside-out depletion of gas or, possibly, morphological quenching, or gas starvation scenarios (cf. Fig. 4).
Quick ioSFQ should thus nearly preserve pre-existing stellar age gradients, whereas slow ioSFQ produce or amplify negative age gradients. Therefore, in the idealized case of a bulge with initially uniform age that experiences an outwardly propagating SFQ front with a constant radial velocity , the slope (Gyr/kpc) in stellar age () could help placing constraints on 111An analogous case of conversion of stellar age gradients into a mean SF propagation velocity was presented in Papaderos et al. (1998) for the blue compact galaxy SBS 0335-052E (Izotov et al., 1990)..
Several observational studies in the past decades have greatly improved our understanding on age and star formation rate (SFR) patterns in galaxies and their bulges. These include, e.g., i) the analysis of radial specific SFR (sSFR) profiles, obtained from H and EW(H) determinations (e.g. Catalán-Torrecilla et al., 2017; Belfiore et al., 2018), age-dating of stellar populations via ii) broad-band colors (e.g., Peletier & Balcells, 1996; de Jong, 1996; Peletier & de Grijs, 1998; Muñoz-Mateos et al., 2007) or iii) Lick indices (e.g. Thomas & Davies, 2006; Morelli et al., 2016), and iv) full spectral synthesis of IFS data (e.g. González-Delgado et al., 2014, 2016; Sánchez-Blázquez et al., 2014; Sánchez-Blázquez, 2016). These studies consistently report a radial decrease of sSFR in the central parts of galaxies, and a trend for an inversion (though a large scatter) of color profiles from positive (negative) in low (high) mass bulges (Balcells & Peletier, 1993, 1994), in qualitative agreement with the presence of negative gradients in high-mass galaxies and vice versa (e.g. González-Delgado et al., 2014, 2016).
On the other hand, all these approaches are tied to underlying assumptions and subject to limitations. For instance, the EW(H) is a proxy to sSFR only as long as the extinction-corrected H luminosity is a reliable SFR tracer. This requires quite specific assumptions (continuous SF at a constant SFR since 100 Myr and no Lyc photon leakage, and, in the case of IFS, that all H emission excited by stars is registered). A secondary issue is that negative stellar metallicity gradients in the bulge can readily lead to an outwardly increasing specific LyC production rate by a factor of 2, thereby mimicking positive H-based sSFR gradients. A further potential caveat of i is that line-of-sight dilution by the triaxial stellar background of the bulge can naturally produce positive EW(H) (thus also sSFR) gradients (cf. Papaderos et al., 2002, for an analogy to local blue compact dwarf galaxies), further adding to the previous effect. Regarding ii, extinction-corrected color gradients are not convertible into age gradients without assumptions on the star formation- and chemical enrichment history, and can strongly be affected by nebular emission (Huchra, 1977; Krüger et al., 1995; Papaderos et al., 1998; Schaerer & de Barros, 2009). As for iii, Lick indices are per se luminosity-weighted, thus primarily reflect the radial distribution of young stars. Since they are designed for instantaneously formed stellar populations (e.g., globular clusters) and not systems with prolonged SF, and potentially suffer from emission-line infilling, they appear to be of questionable applicability to LTG bulges. Finally, iv is subject to the notorious age-metallicity-extinction degeneracy.
A further concern is that the systematization and inter-comparison of results from studies employing the methods above is partly hindered by the fact that age gradients are mostly inferred within the effective radius instead of within the bulge radius . As recently pointed out by BP18, given that shrinks with increasing bulge-to-total ratio and is functionally coupled to the Sérsic index (Trujillo et al., 2001), the usual normalization to it can erase potentially important physical trends or lead to artificial correlations. Likewise, some studies adopt radius normalizations that might optimally serve specific science goals but are less suited to the study of the bulge component. As an example, González-Delgado et al. (2016) infer gradients normalized within a50, the semi-major axis of the elliptical aperture containing 50% of the total light at 5635 Å. Since a50 is unrelated to and also cannot be converted into a photometric radius without knowledge of the ellipticity, a transformation of age gradients from this study into is not possible.
The goal of our study is to infer stellar age gradients within a homogeneously defined for a representative sample of local LTGs, as a step toward the systematization of the physical properties of bulges and the exploration of the mechanisms driving their ioSFQ. In Sect. 2 we briefly present our sample and analysis methodology, and in Sect. 3 we discuss trends between bulge age gradients and galaxy mass, and their possible interpretation in the context of ioSFQ. The main results from this study are summarized in Sect. 4. Throughout we adopt distance estimates from NASA/IPAC Extragalactic Database for H0=67.8 km s-1 Mpc-1.
2 Analysis and main results
The sample used for this analysis has been studied in detail by BP18 and comprises 135 non-interacting, nearly face-on (40∘) local (130 Mpc) LTGs from the CALIFA IFS survey (Sánchez et al., 2012, 2016) conducted with the Potsdam Multi-Aperture Spectrometer (PMAS; Roth et al., 2005; Kelz et al., 2006). It spans 2.6 dex in total stellar mass (8.9 log 11.5) and 3 dex in bulge mass (8.3 log 11.3), therefore can be considered representative of the LTG population in the local universe.
The reader is referred to BP18 for details on the photometric and spectral modeling analysis. Here, we only recall that the isophotal radius of the bulge component in our sample ranges between 25 and 112 (cf. Fig. A.2 in BP18), with only four galaxies (3%) having a bulge diameter 6″. Therefore, convolution with the point spread function (FWHM 26, in the case of CALIFA IFS data) does not appreciably affect our study. was determined with the code iFit (Breda et al., 2019, cf. BP18 for details) as the radius of the Sérsic model to the bulge at an extinction-corrected surface brightness 24 mag/. An alternative approach might have been to define at the radius where the surface brightness of the bulge equals that of the disk (Sánchez-Blázquez et al., 2014), this would have required, however, image decomposition, which can be prone to methodological uncertainties discussed in BP18.
The spectral modeling of low-resolution () CALIFA IFS data in the V500 setup was carried out spaxel-by-spaxel with the pipeline Porto3D (Papaderos et al., 2013; Gomes et al., 2016a), which invokes the population synthesis code Starlight (Cid Fernandes et al., 2005). The simple stellar population libraries used consisted of templates from Bruzual & Charlot (2003) for 38 ages between 1 Myr and 13 Gyr and allowing for a time resolution of 1 Gyr for ages above 7 Gyr. As pointed out in BP18, the intrinsic -band extinction in the bulge, as inferred with Starlight for a foreground screen model was found to be relatively low (0.3 0.18 mag) and not show a clear trend with .
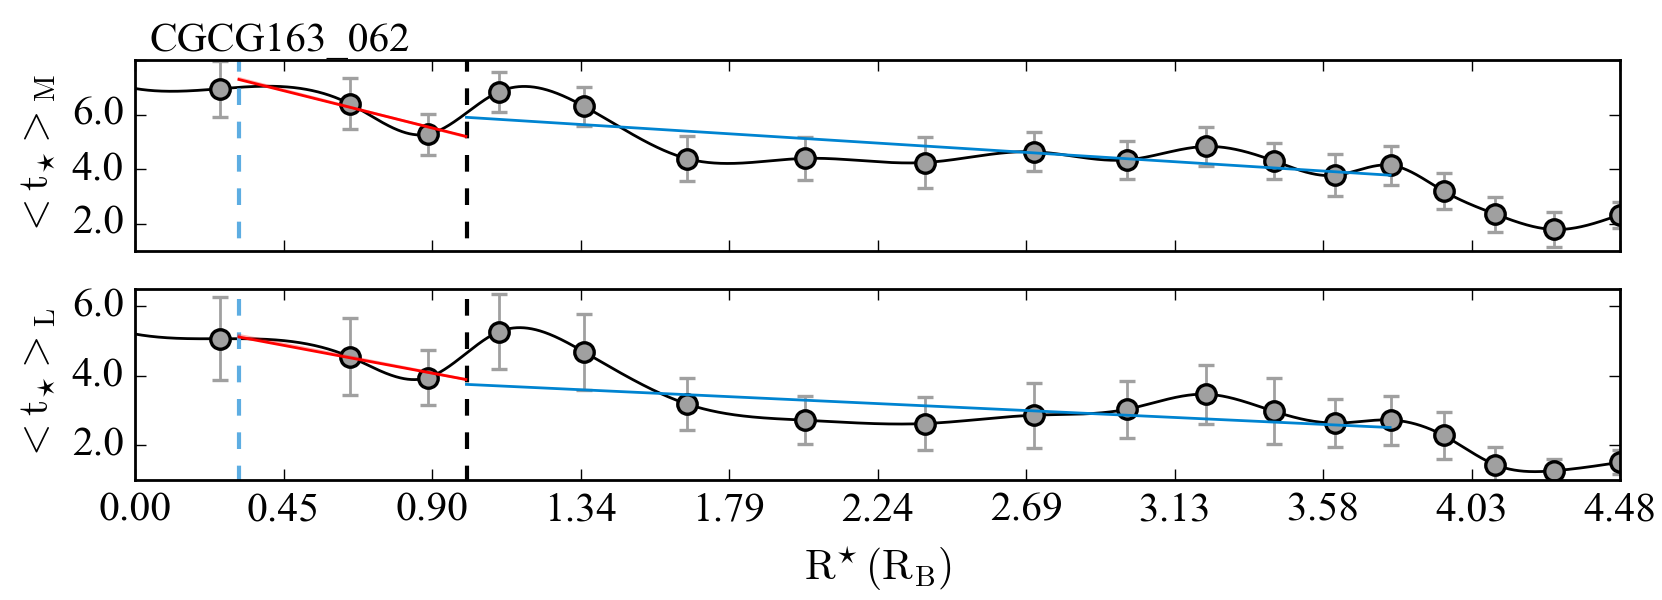
Single-spaxel (sisp) determinations of the mass- and light-weighted age ( and , respectively) were converted into radial profiles using an adaptation of the isophotal annuli (isan) surface photometry technique by Papaderos et al. (2002). The key feature of this method lies in the computation of statistics within logarithmically equidistant isophotal zones, each corresponding to a photometric radius (″), being defined on a reference image of the emission-line-free pseudo-continuum at 6390–6490 Å.
Following BP18, the mean age and its uncertainty within each isan were determined, respectively, as the arithmetic average and standard deviation about the mean of the individual sisp determinations. One advantage of this approach is that it prevents the highest-luminosity (or highest-) spaxels from dictating the result, since all spaxels subtended within an isan are given equal weight. Typically, three to seven isan are included within . As a next step, the mean and were spline-interpolated to a finer radius step, and a linear regression (both non-weighted and weighted by ) was computed within , with set to 26 in order to exclude the innermost PSF-affected part of age profiles from fits. From the latter, the mass- and light-weighted stellar age gradient ( and , respectively) within the bulge was determined. Figure 1 illustrates this procedure on the example of the LTG CGCG 0163-062.
Figure 2 shows and vs. LTG mass log(), with error bars depicting formal uncertainties from weighted and non-weighted linear fits (semi-transparent and solid markers, respectively).
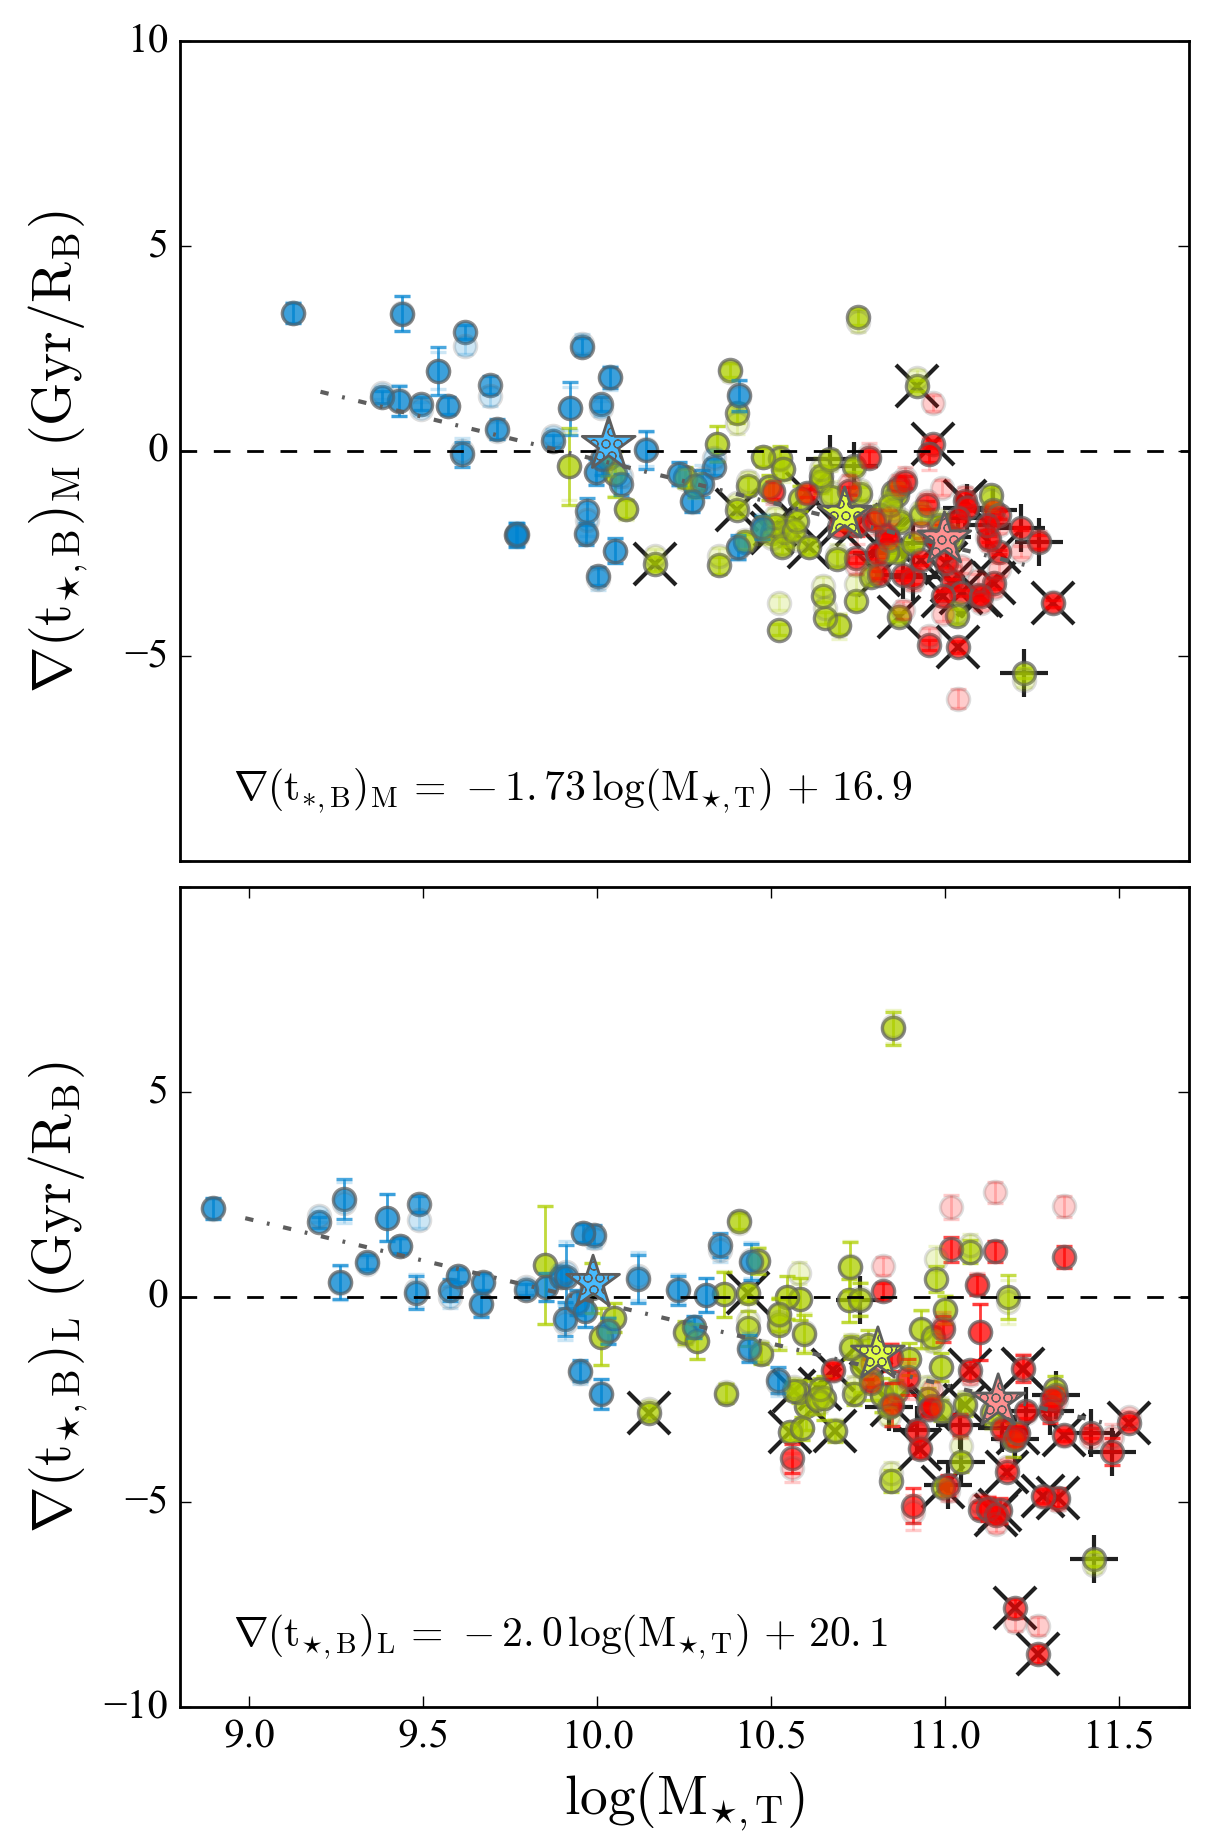
The color coding corresponds to the tentative subdivision of bulges into the intervals iA, iB and iC (blue, green and red, respectively) according to (mag), which was defined by BP18 as the difference - between the mean band surface brightness of the present-day stellar component and that of stars older than 9 Gyr. Thus, a 0 mag characterizes bulges that have completed their make-up earlier than 9 Gyr ago (), whereas a of, say, –2.5 mag translates into a contribution of 90% from stars younger than 9 Gyr. Breda & Papaderos (2018) showed that tightly correlates with physical and evolutionary properties of LTG bulges (e.g., stellar age, surface density and mass) and proposed it as a convenient means for their classification. The most massive, dense and old bulges fall onto the iC class ( –0.5 mag) whereas bulges classified as iA ( –2.5 mag) are the youngest and reside in the least massive LTGs. Spectroscopically classified after Baldwin, Phillips & Terlevich (1981), nearly all iA bulges fall on the locus of Hii regions, whereas almost all bulges classified as LINER (+) and Seyfert (x) are hosted by LTGs with log() 10.5, as apparent from Fig. 2.
Linear fits to weighted determinations of age gradients (dashed-dotted lines) yield the relations = –(1.73 0.15) log() + (17.0 1.56) and = –(2.0 0.15) log() + (20.1 1.56).
Despite a large scatter, both panels of Fig. 2 consistently reveal a trend for an inversion of age gradients from positive to negative values with increasing galaxy mass: whereas iA bulges hosted by lower- LTGs show in their majority flat or positive age gradients, the opposite is the case for iB & iC bulges for which both and are generally negative with an average value of –2 Gyr/ above log 10.5.
We note that this trend is highly unlikely to be driven by the outwardly increasing contribution of the star-forming disk, given that profile decomposition by BP18 yields that in most cases the latter provides a small fraction of the -band emission at , and determinations are relatively insensitive to young stellar populations. Moreover, would disk contamination be strongly affecting mass-weighted age gradients within , then one would expect low-mass (iA) bulges to be most prone to this effect and show negative values, which is the opposite of the evidence from Fig. 2.
3 Discussion
Over the past years, observational evidence has been accumulating for a dependence of the slope of stellar age gradients on galaxy mass and luminosity (cf. Sect. 1). The present study adds further insights into this subject by virtue of the fact that it investigates for the first time a representative sample of local LTGs and determines age gradients within a clear-cut defined bulge radius. On the other hand, one should bear in mind some methodological limitations of this study. Of those, especially important is the age-metallicity-extinction degeneracy being inherent to all purely stellar population spectral synthesis codes (cf. BP18 for a further discussion). In the case of Starlight, typical uncertainties of 0.1-0.15 dex on age determinations (Cid Fernandes et al., 2005, 2014) within individual isan could propagate into errors in and at a level that we estimate to be 20%. The same applies to systematic errors arising from the neglect of nebular continuum emission: as demonstrated by Cardoso et al. (2019), already at a modest level of nebular contamination (EW(H) 40-60 Å) the inferred from Starlight can be overestimated by 0.2-0.3 dex. Additionally, several of the here analyzed LTGs show within significant departures from a linear increase of stellar age with radius, thus linear fits (cf. Fig. 1) yield in these cases rather coarse estimates to and .
The large scatter ( 1.7 Gyr/) in Fig. 2 does not permit to associate the inversion point from positive to negative age gradients with a sharp threshold in . However, judging from the linear fits in Fig. 2, this transition occurs at approximately log(/) 10, i.e. the empirically suggested border between SF- and AGN/LINER-dominated LTG bulges (BP18). This is consistent with the notion that the inversion of stellar age gradients marks the epoch when accretion-powered nuclear activity starts taking over the gas excitation in bulges, then gradually leading to the extinction of their SF activity. The fact that negative age gradients are naturally arising in an ioSFQ scenario reinforces this conjecture, even though this alone is no compelling evidence for a causal link between both phenomena. In the light of the trends in Fig. 2 it appears worthwhile to extend this study with metallicity determinations both in the stellar and nebular component, which is a forthcoming task. Interestingly, Tissera et al. (2016) find from cosmological simulations evidence for inside-out disk formation, with simulated discs with a mass around showing steeper negative stellar metallicity gradients, in agreement with observational results (e.g. González-Delgado et al., 2015).
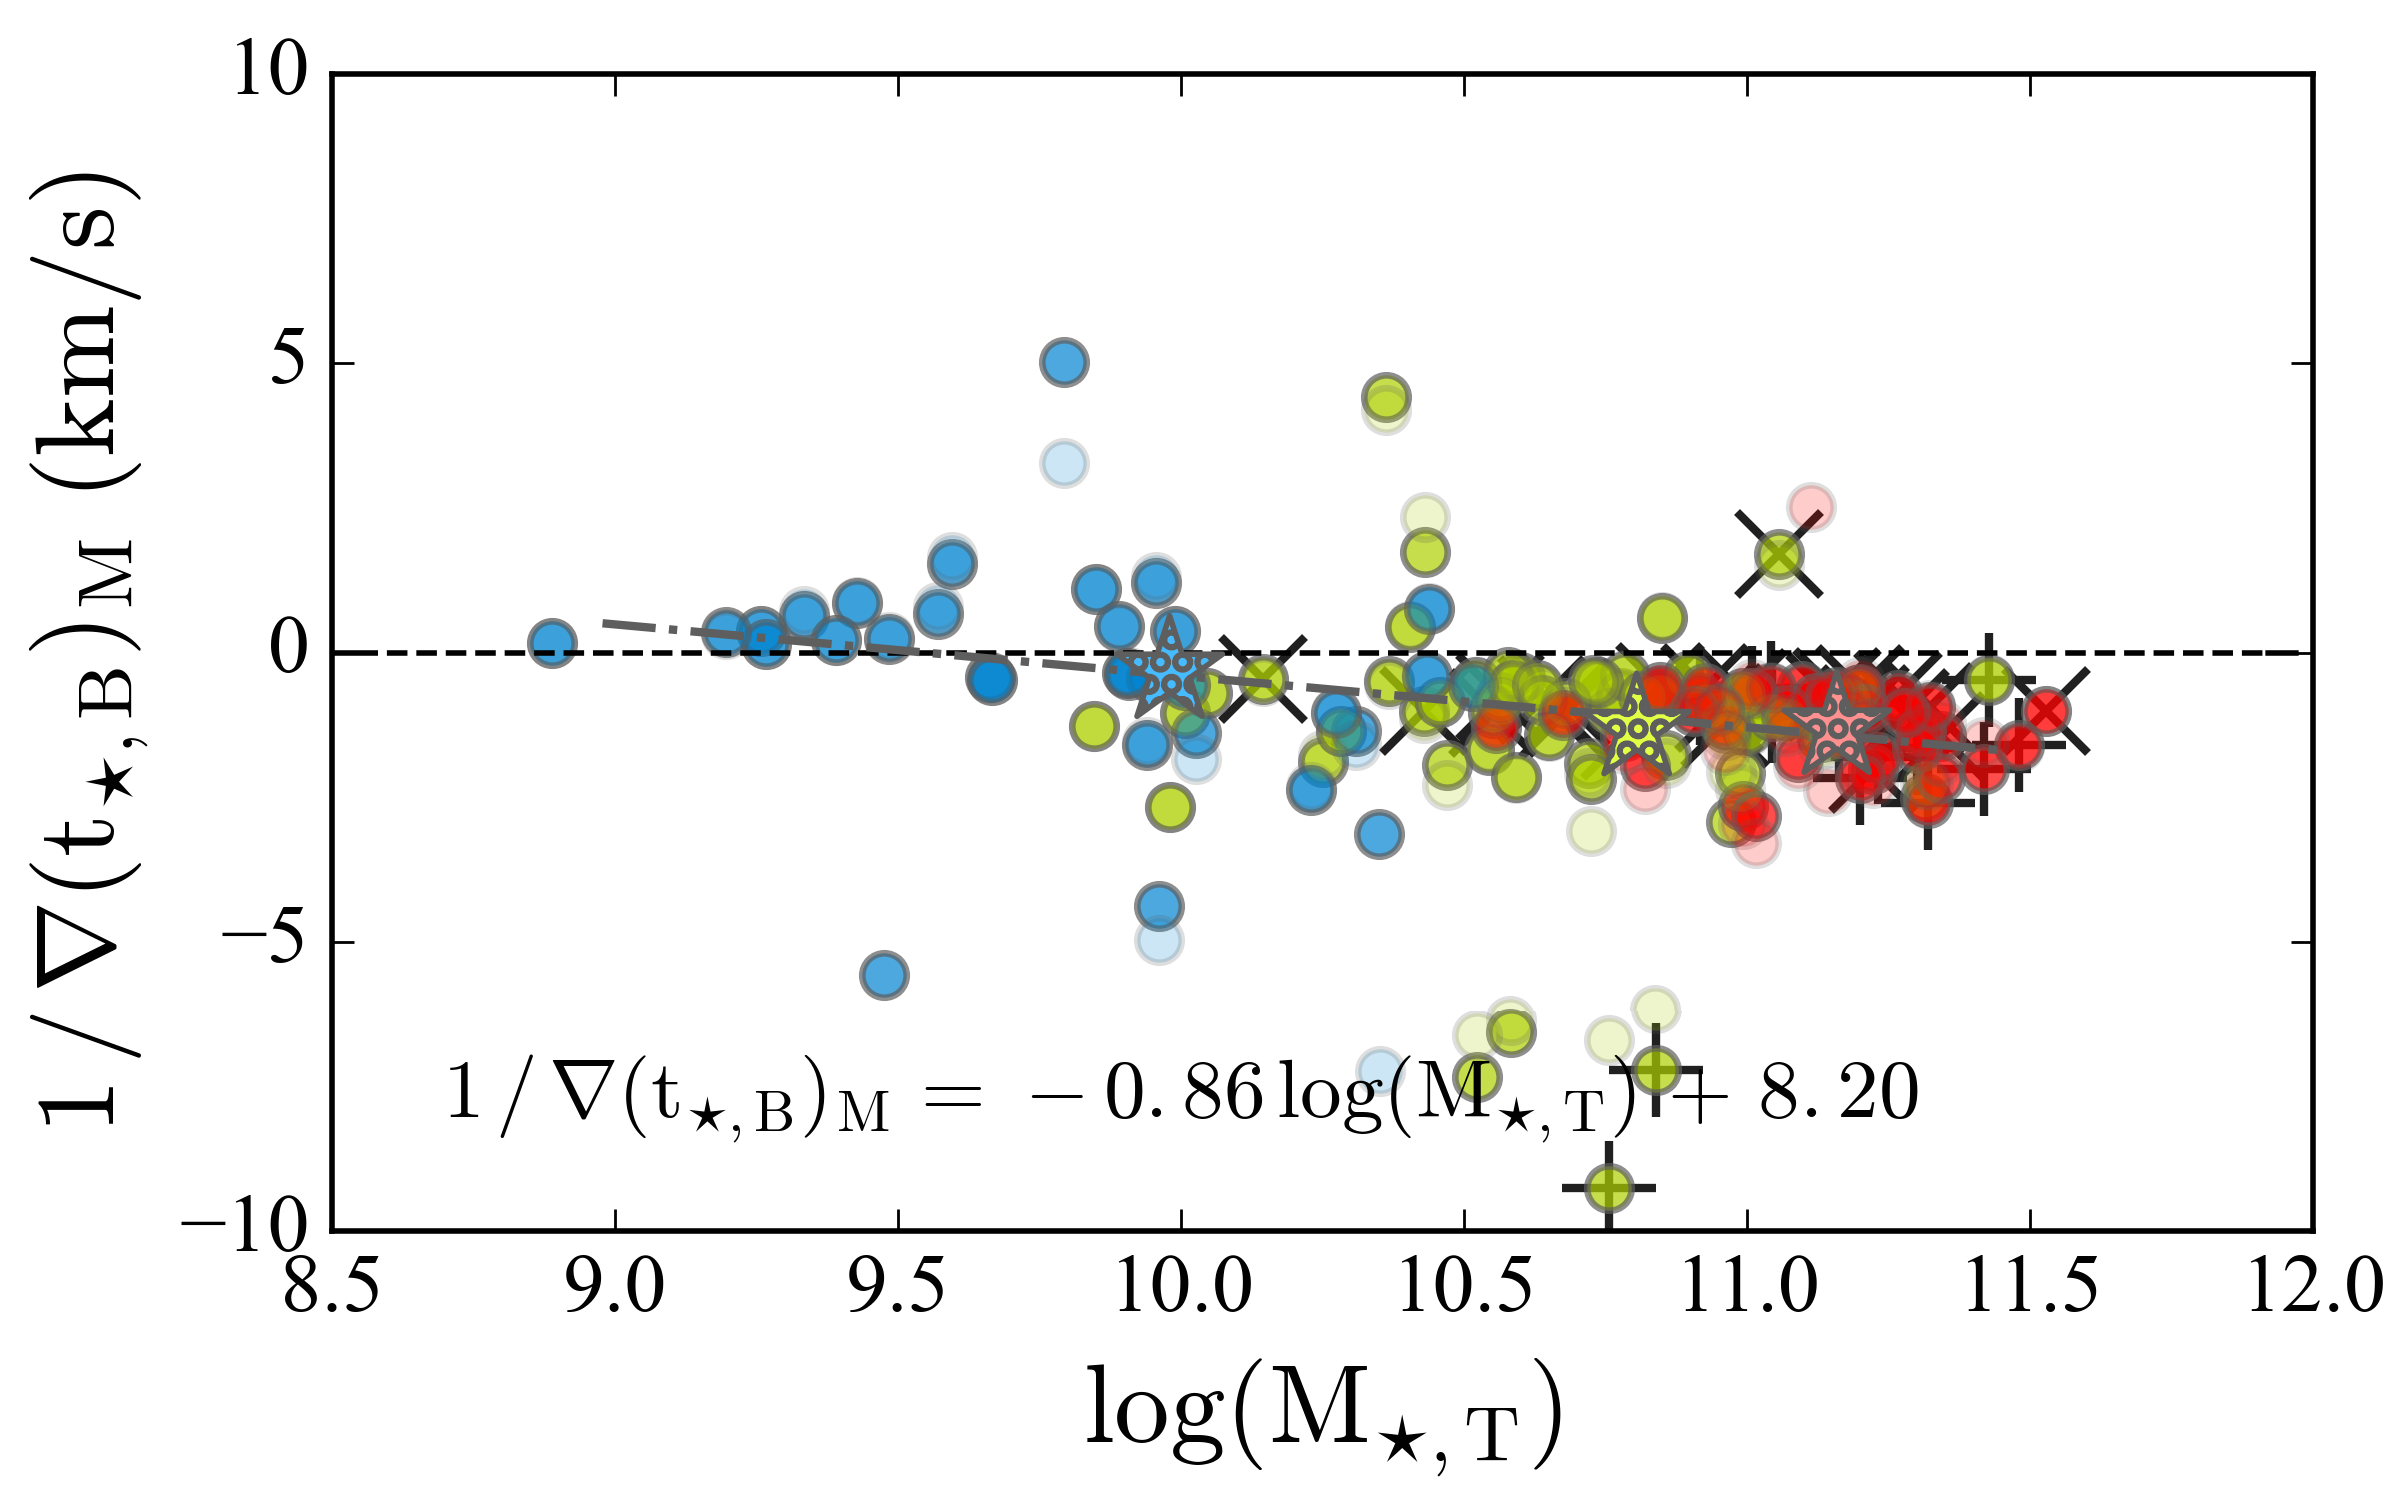
One may consider two simple limiting cases for the bulge growth prior to the onset of ioSFQ, the first one employing the assumption that the sSFR within has initially been roughly spatially uniform (thus 0) and the second one assuming an inside-out bulge assembly process, thus a negative of genetic origin. In a simple gedankenexperiment, one can then convert in the first case the present-day into a mean radial velocity (km s-1) for a spheric-symmetric outwardly (inwardly) propagating front of SF quenching (shrinking).
As apparent from Fig. 3, for the majority of bulges above log() 10 (iB and iC class in the notation by BP18), this is in the range of 1-2 km s-1, which is 2 dex lower than the central stellar velocity dispersion of LTG bulges (150-200 km s-1, Falcon-Barroso et al., 2016)222Interestingly, in Gomes et al. (2016b) we simulated the formation of ETGs in a toy model assuming inside-out SF since 13.5 Gyr at a mean velocity of 2 km s-1, which was chosen such as to reproduce the typical radius of these galaxies. The fact that this assumed velocity turns out to be fairy close to the here observationally estimated mean for LTG bulges, if not a mere coincidence, raises the speculation of whether stellar spheroids both form and quench in an inside-out manner at a speed on the other of the sound speed in the neutral gas.. This prima facie points against a brief energetic event (e.g., an AGN-driven blast wave or series of starbursts) that rapidly swept gas out of the bulge, thereby leading to an abrupt cessation of SF out to . The inversion point at a present-day stellar mass of log() 10 translates by the relations log() = 1.22 log() - 2.87 and = 2.3 log() - 13.44 by BP18 to an age of 9.6 Gyr () for the onset of ioSFQ. This suggests that, on the statistical average, LTGs with a present-day log() 10 have entered their ioSFQ phase no later than 4 Gyr after the Big Bang. To reconcile this with the observed age contrast between bulge center and periphery (3 Gyr; cf. Fig. 2) in the most massive ( ) LTGs, one has then to assume that ioSFQ in these systems has started at a cosmic age of 1 Gyr ( 5.7). The hypothesis that this process was driven by negative AGN feedback appears to be compatible with existing data, even though the peak of the average SMBH growth rate has occurred only at (e.g., Shankar et al., 2009).
Admittedly, the assumption of a nearly constant is simplistic: for instance, by analogy to a SF-driven supershell that spherically expands against an ambient medium of constant density, one would expect the radius to grow as and for the case of, respectively, an instantaneous and continuous injection of mechanical energy (e.g. de Young & Heckman, 1994, see also McCray & Kafatos 1987). Furthermore, a stable, spheric-symmetrically expanding ioSFQ front is improbable in the presence of a turbulent multi-phase gas medium exposed to strongly directional outflows from an AGN, as several observations indicate (e.g., Kehrig et al., 2012, see Kormendy & Ho 2013 for a review).
As for the second hypothesis, it assumes a superposition of a pre-existing negative with that subsequently arising through ioSFQ. Discriminating between both is clearly a formidable task, perhaps only possible through a combined chemodynamical decomposition of stellar populations and the nebular emission they are associated with. Obviously, if the observed ’s of 3 Gyr/ are primarily of genetic origin, then massive (iB and iC) bulges cannot have formed quasi-monolithically (1 Gyr, Kormendy & Kennicutt, 2004, for a review), but instead over a prolonged phase of 2-3 Gyr that lasted until 2.2, as suggested by BP18. These authors proposed that bulges arise out of galactic disks on a timescale that is inversely related to the present-day LTG mass, with massive iC bulges forming in the most massive galaxies first, whereas the least massive iA bulges still assembling out of gaseous and stellar material from the disk. This minimum timescale of 2-3 Gyr for the make-up of bulges is probably also consistent with the two-phase galaxy formation scenario by Oser et al. (2010), if the initial (2) dissipational phase of in-situ SF in their simulations is chronologically associated with the dominant phase of bulge formation in the most massive LTGs. The same applies to the timescales predicted by bulge formation scenarios envisaging inward migration and coalescence of massive ( ) SF clumps emerging out of violent disk instabilities (Bournaud et al., 2007; Mandelker et al., 2014). As pointed out in BP18, a natural consequence from inward migration of SF clumps from the disk are negative age gradients in massive iC bulges, in agreement with the evidence from Fig. 2.
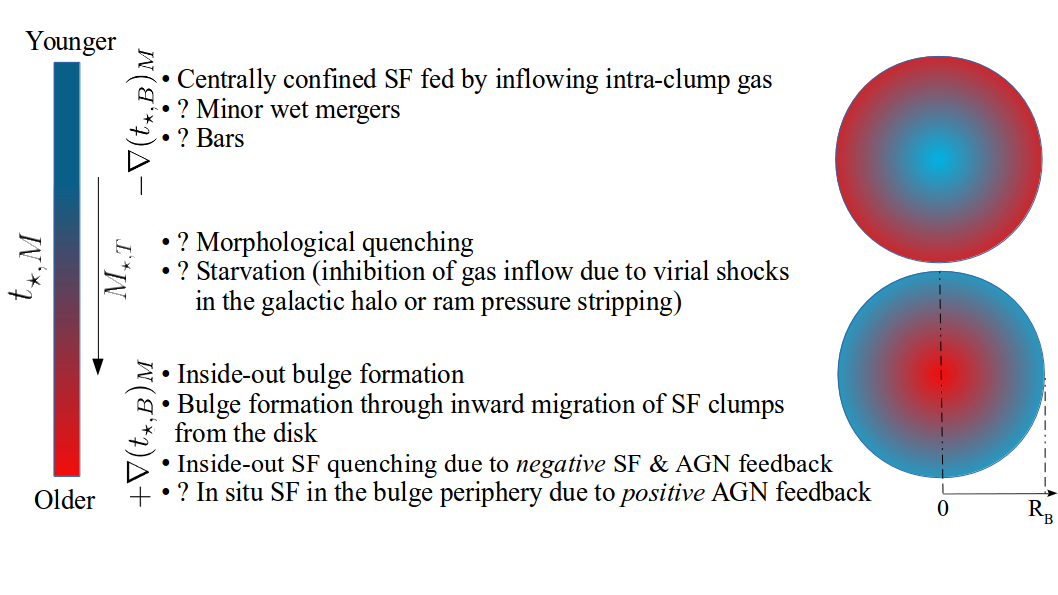
The large scatter in in Fig. 2), even though partly due to observational and methodological uncertainties, suggests that there are multiple evolutionary pathways from bulges bracketed by the two limiting cases of slow and quick ioSFQ. The spread of determinations at the l.h.s. of the diagram ( 0) might reflect a various degree of intensity and confinement of SF to the center of low-mass bulges, possibly regulated by
the inflow rate of intra-clump gas from the disk (Hopkins et al., 2012) and influenced by minor wet mergers with gaseous entities from the galaxy itself and its surroundings.
As for bulges with 0, the documented spread in might be accounted for by a superposition of different non-mutually exclusive processes. These include both negative and positive AGN feedback, the latter in the sense of fast nuclear outflows plunging into the ambient dense gas and triggering localized SF in the periphery of the bulge, this way promoting its growth (Maiolino et al., 2017) and further steepening negative age gradients.
The role of bars for this phase and over the whole bulge evolution is most certainly another important unknown: Gadotti & dos Anjos (2001) found mostly negative - and - color gradients, with flat or positive gradients mostly in barred galaxies.
The expected imprints of morphological quenching or gas starvation (cf. Sect. 1) on stellar age gradients in the bulge has, to our best knowledge, not been quantitatively explored from the theoretical point of view. Whereas both of these processes act towards shutting off SF all over , thus probably have no dominant effect on pre-existing age gradients, it cannot be excluded that they favor, over a certain period at least, a non-uniform sSFR within the bulge, eventually leaving an imprint on and contributing to its scatter. The resolution of current cosmological simulations is insufficient for spatially resolving the bulge and carrying out a comparative investigation of the expected for the above scenarios. Moreover, contrary to an AGN, one cannot switch on/off gas inflow onto the bulge in order to quantitatively assess the effect of inhibition of gas transfer from the cosmic web (Dekel et al., 2009) or the local galaxy environment (e.g., Peng et al., 2015). Additionally, the investment in computational time for higher-resolution simulations appears justifiable only after an improvement of contemporary models, which in some respects suffer from significant deficits. For instance, simulations on larger spatial scales (out to ) by Hirschmann et al. (2013) and Choi et al. (2017) always predict strongly positive age gradients in massive (log(/)10) galaxies (Hirschmann et al., 2015), which indicates that better prescriptions or additional physical processes need to be implemented.
4 Summary and conclusions
The trend for an inversion of the slope of radial stellar age gradients from positive values in young low-mass bulges to negative values for old massive bulges, here solidified through a homogeneous analysis of representative sample of local late-type galaxies from the CALIFA survey, likely encodes crucial information on the physical drivers of bulge growth and the ensuing inside-out cessation of star-forming activity.
For massive bulges (log10), we distinguish between two simple limiting cases, the first one attributing stellar age gradients to an inside-out quenching of star formation, and the second one viewing them as relics from the bulge formation process. In the first case, and assuming that prior to ioSFQ bulges had spatially uniform age, the observed gradients translate into a mean inside-out SFQ velocity of 1–2 km s-1, which is consistent with a gradual evacuation or thermalization a cold gas being susceptible to star formation. If due to negative AGN feedback, this could hint at a mild growth of super-massive black holes in tandem with the bulge. However, alternative mechanisms for the shut-off of star formation (e.g., morphological quenching or inhibition of cold gas inflow from the halo and the cosmic web) cannot be excluded given the lack of quantitative theoretical constraints on the radial age patterns these processes could leave behind.
In the second scenario, i.e. assuming that the observed age gradients portray the bulge formation process, then the range of values inferred (3 Gyr/) argue against a quasi-monolithic build-up and point instead to a prolonged formation phase that could be driven by a superposition of inwards migration of star-forming clumps from the disk and in situ star formation. Quite importantly, if the observed age gradients in bulges are mainly of genetic origin, then one cannot rule out a quick ioSFQ episode following an energetic AGN outburst, given that such a process would leave virtually no imprints on pre-existing age patterns in the stellar component.
As the large scatter (1.7 Gyr/) of age gradients at a given mass suggests, the evolutionary pathways of galaxy bulges are far more complex, and possibly shaped by a mixture of the two aforementioned limiting scenarios with, for instance, positive AGN feedback, bulge-bar interaction and possibly also morphological quenching and gas starvation. A further exploration of the age gradient vs. stellar mass relation with higher-resolution IFS data and detailed numerical simulations, incorporating realistic recipes for star formation and AGN-driven feedback appears to be of considerable interest and fundamental to the development of a coherent picture on the assembly history of late-type galaxies and their structural components.
Acknowledgements.
We thank the European taxpayer, who in the spirit of solidarity between EU countries is offering to Portugal a substantial fraction of the financial resources that allowed it to sustain a research infrastructure in astrophysics. Specifically, the major part of this work was carried out at an institute whose funding is provided to 85% by the EU via the FCT (Fundação para a Ciência e a Tecnologia) apparatus, through European and national funding via FEDER through COMPETE by the grants UID/FIS/04434/2013 & POCI-01-0145-FEDER-007672 and PTDC/FIS-AST/3214/2012 & FCOMP-01-0124-FEDER-029170. Additionally, this work was supported by FCT/MCTES through national funds (PIDDAC) by this grant UID/FIS/04434/2019. We are grateful to Dr. Dimitri Gadotti, Prof. Daniel Schaerer and Dr. Andrew Humphrey for valuable comments. We acknowledge supported by European Community Programme (FP7/2007-2013) under grant agreement No. PIRSES-GA-2013-612701 (SELGIFS). I.B. was supported by the FCT PhD::SPACE Doctoral Network (PD/00040/2012) through the fellowship PD/BD/52707/2014 funded by FCT (Portugal) and POPH/FSE (EC) and by the fellowship CAUP-07/2014-BI in the context of the FCT project PTDC/FIS-AST/3214/2012 & FCOMP-01-0124-FEDER-029170. P.P. was supported through Investigador FCT contract IF/01220/2013/CP1191/CT0002 and by a contract that is supported by FCT/MCTES through national funds (PIDDAC) and by grant PTDC/FIS-AST/29245/2017. SA gratefully acknowledge support from the Science and Technology Foundation (FCT, Portugal) through the research grants PTDC/FIS-AST/29245/2017 and UID/FIS/04434/2019. P.L. acknowledges support by DL57/2016/CP1364/CT0010. This study uses data provided by the Calar Alto Legacy Integral Field Area (CALIFA) survey (califa.caha.es), funded by the Spanish Ministry of Science under grant ICTS-2009-10, and the Centro Astronómico Hispano-Alemán. It is based on observations collected at the Centro Astronómico Hispano Alemán (CAHA) at Calar Alto, operated jointly by the Max-Planck-Institut für Astronomie and the Instituto de Astrofísica de Andalucía (CSIC). This research has made use of the NASA/IPAC Extragalactic Database (NED) which is operated by the Jet Propulsion Laboratory, California Institute of Technology, under contract with the National Aeronautics and Space Administration.References
- Annibali et al. (2010) Annibali, F., Bressan, A., Rampazzo, R. et al. 2010, A&A, 519, A40
- Balcells & Peletier (1993) Balcells, M., & Peletier, R. F. 1993, Galactic Bulges, 153, 409
- Balcells & Peletier (1994) Balcells, M. & Peletier, R.F. 1994, AJ 107, 135
- Baldwin, Phillips & Terlevich (1981) Baldwin, J. A., Phillips, M. M. & Terlevich, R., 1981, PASP, 93, 5 (BPT)
- Belfiore et al. (2016) Belfiore, F., Maiolino, R., Maraston, C. et al. 2016, MNRAS, 461, 311
- Belfiore et al. (2018) Belfiore, F., Maiolino, R., Bundy, K. et al. 2018, MNRAS, 477, 3014
- Binette et al. (1994) Binette, L., Magris, C. G., Stasińska, G., & Bruzual, A. G. 1994, A&A, 292, 13
- Bournaud et al. (2007) Bournaud, F., Elmegreen, B. G., Elmegreen, D. M., 2007, ApJ, 670, 237
- Breda & Papaderos (2018) Breda, I. & Papaderos, P. 2018, A&A 614, 48 (BP18)
- Breda et al. (2019) Breda, I., Papaderos, P., Gomes, J.M., Amarantidis, S. 2019, A&A 632A, 128B
- Brinchmann et al. (2004) Brinchmann, J., Charlot, S., White, S. D. M. et al. 2004, MNRAS, 351, 1151
- Bruzual & Charlot (2003) Bruzual, G. & Charlot, S., 2003, MNRAS, 344, 1000
- Cardoso et al. (2019) Cardoso, L., Gomes, J. M. & Papaderos, P., 2017, A&A, 622, 56
- Catalán-Torrecilla et al. (2017) Catalán-Torrecilla, C., Gil de Paz, A., Castillo-Morales, A. et al. 2017, ApJ 848, 87
- Cattaneo et al. (2009) Cattaneo, A., Faber, S. M., Binney, J., Dekel, A., Kormendy, J. et al. 2009, Nature, 460, 213
- Choi et al. (2017) Choi, E., Ostriker, J.P., Naab, T. et al. 2017, ApJ, 844, 31
- Cid Fernandes et al. (2005) Cid Fernandes, R., Mateus, A., Sodré, L., Stasińska, G., Gomes, J. M., 2005, MNRAS, 358, 363
- Cid Fernandes et al. (2014) Cid Fernandes, R., Gonzálex Delgado, R., García Benito, R. et al. 2014, A&A 561, 130
- Croton et al. (2006) Croton, D.J., Springel, V., White, S.D.M. et al. 2006, MNRAS, 365, 11
- Dekel et al. (2009) Dekel, A., Birnboim, Y., Engel, G., et al. 2009, Nature, 457, 451
- de Jong (1996) de Jong, R. S. 1996, A&A, 313, 377
- de Young & Heckman (1994) De Young, D.S. & Heckman,, T.M. 1994, ApJ, 431, 598
- Di Matteo et al. (2005) Di Matteo, T., Springel, V. & Hernquist, L. 2005, Nature, 433, 604
- Eggen et al. (1962) Eggen, O.J., Lynden-Bell, D. & Sandage, A.R. 1962, ApJ, 136, 748
- Ellison et al. (2018) Ellison, S. et al. 2018, MNRAS, 474, 2039
- Falcon-Barroso et al. (2016) Falcón-Barroso, J., Lyubenova, M., van de Ven, G. et al. 2016, A&A, 597, 48
- Fall & Efstathiou (1980) Fall, S.M. & Efstathiou G. 1980, MNRAS, 193, 189
- Fang et al. (2013) Fang, J.J., Faber, S.M., Koo, D.C., Dekel, A. 2013, ApJ, 776, 63
- Gadotti & dos Anjos (2001) Gadotti, D. A. & dos Anjos, S., 2001, AJ 122, 1298
- Ganda et al. (2007) Ganda, K., Peletier, R.F., McDermid, R.M. et al. 2007, MNRAS, 380, 506
- Genzel et al. (2014) Genzel, R. et al. 2014, ApJ 785, 75
- Gomes et al. (2016a) Gomes, J.M., Papaderos, P., Kehrig, C. et al. 2016a, A&A, 588, A68
- Gomes et al. (2016b) Gomes, J.M., Papaderos, P. Vílchez, J.M. et al. 2016b, A&A, 586, 22
- González-Delgado et al. (2014) González Delgado, R.M., Pérez, E., Cid Fernandes, R. et al. 2014, A&A, 562, A47
- González-Delgado et al. (2015) González Delgado, R.M., García-Benito, R., Pérez, E., et al. 2015, A&A, 581, A103
- González-Delgado et al. (2016) González Delgado, R.M., Cid Fernandes, R., Pérez, E. et al. 2016, A&A, 590, A44
- Heckman (1980) Heckmann, T. M. 1980, A&A, 87, 152
- Hirschmann et al. (2013) Hirschmann, M., Naab, T., Davé, R., et al. 2013, MNRAS, 436, 2929
- Hirschmann et al. (2015) Hirschmann, M., Naab, T., Ostriker, J.P. 2015, MNRAS, 449, 528
- Ho (2008) Ho, L.C., 2008, ARA&A, 46, 475
- Hopkins et al. (2012) Hopkins, P.F. et al. 2012, MNRAS, 427, 968
- Huchra (1977) Huchra, J.P. 1977, ApJ, 217, 928
- Izotov et al. (1990) Izotov, Y.I., Guseva, N.G., Lipovetsky, V.A. et al. 1990, Nature, 343, 238
- Kauffmann et al. (2003) Kauffmann G. et al., 2003, MNRAS, 341, 54
- Kehrig et al. (2012) Kehrig, C., Monreal-Ibero, A. & Papaderos, P. et al. 2012, A&A, 540, 11
- Kelz et al. (2006) Kelz, A., Verheijen, M. A. W., Roth, M. M., et al. 2006, PASP, 118, 129
- Kepner (1999) Kepner J.V., 1999, ApJ, 520, 59
- Kormendy & Kennicutt (2004) Kormendy, J. & Kennicutt Jr, R. 2004, ARA&A, 42, 603
- Kormendy & Ho (2013) Kormendy, J. & Ho, L.C. 2013, ARA&A, 51, 511
- Krüger et al. (1995) Krüger, H., Fritze-v. Alvensleben, U., & Loose, H.-H. 1995, A&A, 303, 41
- Larson et al. (1980) Larson, R.B., Tinsley, B.M. & Caldwell, C.N. 1980, ApJ, 237, 692
- Lang et al. (2014) Lang P., Wuyts, S., Somerville, R.S. et al. 2014, ApJ, 788, 11
- Maiolino et al. (2017) Maiolino, R., Russell, H.R., Fabian, A.C. et al. 2017, Nature, 544, 202
- Mandelker et al. (2014) Mandelker, N., Dekel, A., Ceverino, D. et al. 2014, MNRAS 443, 3675
- Martig et al. (2009) Martig, M., Bournaud, F., Teyssier, R., Dekel, A. 2009, ApJ 707, 250
- McCray & Kafatos (1987) McCray, R. & Kafatos, M. 1987, ApJ, 317, 190
- Molseh et al. (2018) Mosleh, M., Tavasoli, S., Tacchella, S. 2018, ApJ, 861, 101
- Morelli et al. (2016) Morelli, L., Parmiggiani, M., Corsini, E. M. et al. 2016, MNRAS, 463, 4396
- Muñoz-Mateos et al. (2007) Muñoz-Mateos, J.C., Gil de Paz, A., Boissier, S., et al. 2007, ApJ, 658, 1006
- Omand et al. (2014) Omand, C.M.B., Balogh, M.L., Poggianti, B.M. 2014, MNRAS, 440, 843
- Oser et al. (2010) Oser, L., Ostriker, J.P., Naab, T. et al. 2010, ApJ, 725, 2312
- Papaderos et al. (1998) Papaderos, P., Izotov, Y.I., Fricke, K.J. et al. 1998, A&A, 338, 43
- Papaderos et al. (2002) Papaderos, P., Izotov, Y.I., Thuan, T.X. et al. 2002 A&A, 393, 461
- Papaderos et al. (2013) Papaderos, P., Gomes, J. & Vílchez, J. et al. 2013, A&A, 555, L1
- Peletier & Balcells (1996) Peletier & Balcells, 1996, AJ, 111, 2238
- Peletier & de Grijs (1998) Peletier, R.F. & de Grijs, R. 1998, MNRAS, 300, L3
- Peng et al. (2010) Peng, Y.-J., Lilly, S.J., Kovac, K. et al. 2010, ApJ, 721, 193
- Peng et al. (2015) Peng, Y., Maiolino, R. & Cochrane, R. 2015, Nature 521, 192
- Pérez et al. (2013) Pérez, E., Cid Fernandes, R., González Delgado, R.M. et al. 2013, ApJL 764, 1
- Roth et al. (2005) Roth, M. M., Kelz, A., Fechner, T. et al. 2005, PASP, 117, 620
- Salim et al. (2012) Salim, S., Fang, J.J., Rich, R.M. et al. 2012, ApJ, 755, 105
- Sánchez et al. (2012) Sánchez, S.F., Kennicutt, R. C., Gil de Paz, A. et al. A&A, 538, 8
- Sánchez et al. (2016) Sánchez, S.F., García-Benito, R., Zibetti, S. et al. 2016, A&A 594, 36
- Sánchez-Blázquez et al. (2014) Sánchez-Blázquez, P., Rosales-Ortega, F.F., Méndez-Abreu, J. et al. 2014, A&A, 570, A6
- Sánchez-Blázquez (2016) Sánchez-Blázquez, P. 2016, in Galactic Bulges, Laurikainen, E., Peletier, R. & Gadotti, D. (Eds.), Astrophysics and Space Science Library, Springer, Volume 418, p. 127
- Schaerer & de Barros (2009) Schaerer, D. & de Barros, S. 2009, A&A, 502, 423
- Shankar et al. (2009) Shankar, F., Weinberg, D., Miralda-Escudé, J. 2009, ApJ, 690, 20
- Silk (1997) Silk, J. 1997, ApJ, 481, 703
- Singh et al. (2013) Singh, R., van de Ven, G., Jahnke, K. et al. 2013, A&A 558, A43
- Strateva et al. (2001) Strateva, I., Ivvezic, Z., Knapp, G. R., et al. 2001, AJ, 122, 1861
- Szomoru et al. (2012) Szomoru, D., Franx, M., & van Dokkum, P. G. 2012, ApJ, 749, 121
- Tacchella et al. (2015) Tacchella, S., Carollo, C.M., Renzini, A. et al. 2015, Science 348, 314
- Tacchella et al. (2018) Tacchella, S., Carollo, C. M., Förster Schreiber, N. M., et al. 2018, ApJ, 859, 56
- Thomas & Davies (2006) Thomas, D. & Davies, R., 2006, MNRAS, 366, 510
- Tissera et al. (2016) Tissera, P.B., Machado, R.E.G., Sánchez-Blazquez, P. et al. 2016, A&A, 592, 93
- Trujillo et al. (2001) Trujillo, I., Graham, A.W. & Caon, N. 2001, MNRAS, 326, 869
- van den Bosch (1998) van den Bosch F. C., 1998, ApJ, 507, 601
- van Dokkum & Franx (2001) van Dokkum, P.G. & Franx, M. 2001, ApJ, 553, 91
- van Dokkum et al. (2013) van Dokkum, P. G., Leja, J., Nelson, E. J. et al. 2013, ApJL, 771, 35
- Yan & Blanton (2012) Yan, R. & Blanton, M. R. 2012, ApJ, 747, 61
- Woo & Ellison (2019) Woo, J. & Ellison, S.L. 2019, MNRAS, 487, 1927
- Wuyts et al. (2012) Wuyts, S., Förster Schreiber, N., Genzel, R. et al. 2012, ApJ 753, 114
- Zibetti et al. (2017) Zibetti, S., Gallazzi, A.R., Ascasibar, Y. et al. 2017, MNRAS, 468, 1902