Revealing the Double Nucleus of NGC 4490
Abstract
NGC 4490/85 (UGC 7651/48) or Arp 269 is well known for being one of the closest interacting/merging galactic systems. NGC 4490 has a high star formation rate (SFR) and is surrounded by an enormous H I feature stretching about 60 kpc north and south of the optically visible galaxies. Both the driver for the high SFR in NGC 4490 and the formation mechanism of the H I structure are puzzling aspects of this system. We have used mid-infrared Spitzer data to show that NGC 4490 has a double nucleus morphology. One nucleus is visible in the optical, while the other is only visible at infrared and radio wavelengths. We find the optical nucleus and the potential infrared visible nucleus have similar sizes, masses, and luminosities. Both are comparable in mass and luminosity to other nuclei found in interacting galaxy pairs and much more massive and luminous compared with typical non-nuclear star-forming complexes. We examine possible origin scenarios for the infrared feature, and conclude that it is likely that NGC 4490 is itself a merger remnant, which is now interacting with NGC 4485. This earlier encounter provides both a possible driver for extended star formation in NGC 4490, and multiple pathways for the formation of the extended H I plume.
1 Introduction
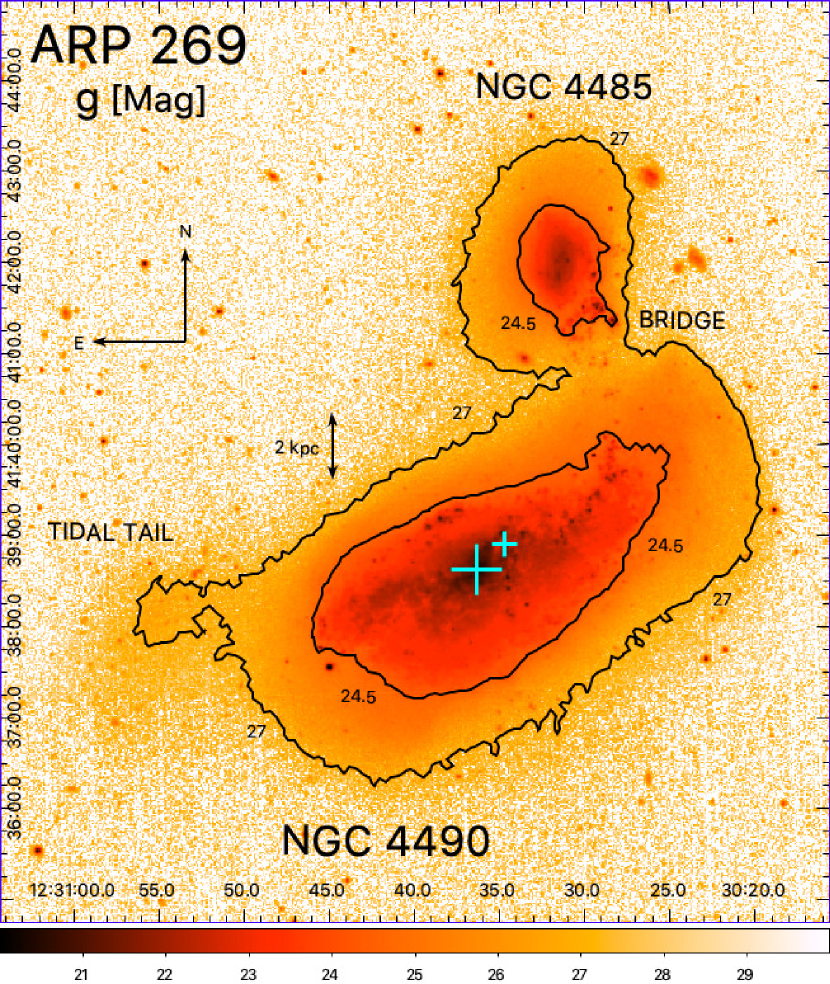
NGC 4490/85 (UGC 7651/48) or Arp 269 (Arp, 1966) is a relatively nearby ( Mpc; Yim & van der Hulst 2016) interacting galaxy system (see Table 1 for a summary of all adopted physical and observational parameters). As shown in Figure 1, it consists of a smaller irregular (IB 9) galaxy (NGC 4485) interacting with a larger barred spiral (SB 7) galaxy (NGC 4490, or colloquially the “Cocoon Galaxy”). In this paper we present evidence that NGC 4490 is itself a late-stage merging system, and we discuss how this fact explains some puzzling aspects of the Arp 269 system.
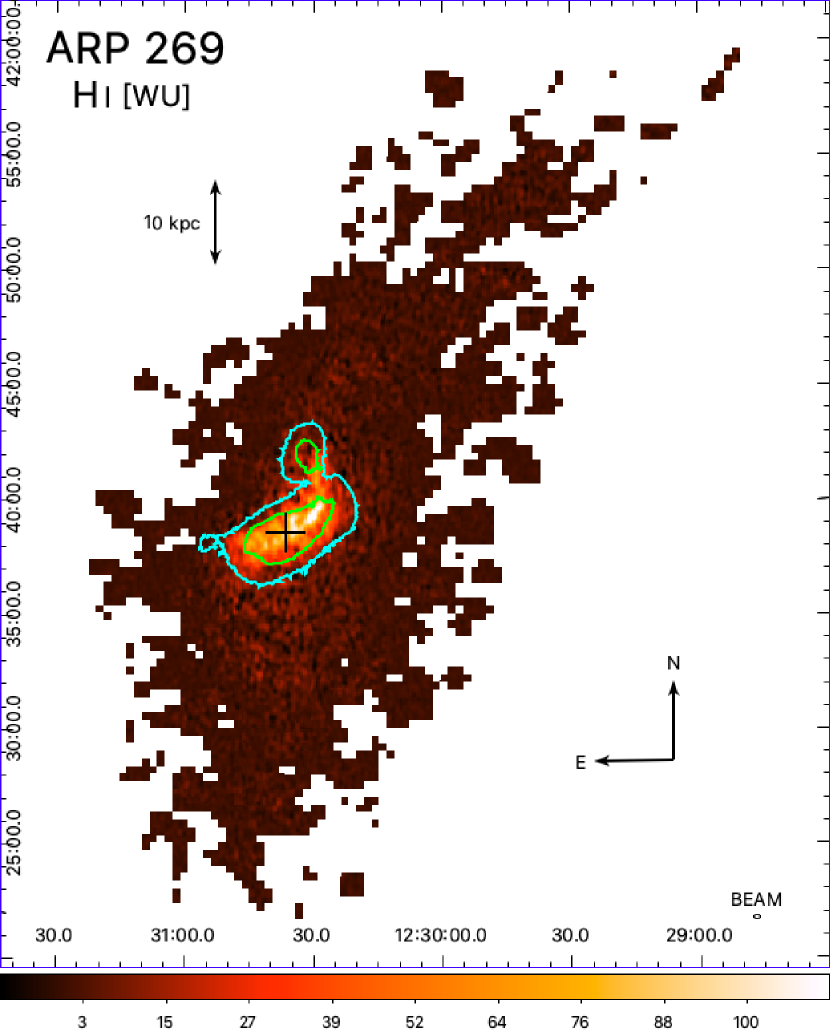
One of the most striking features of NGC 4490/85, first noted by Huchtmeier et al. (1980) and Viallefond et al. (1980), is that it is embedded in an extensive envelope of neutral hydrogen (H I). The H I emission is elongated approximately perpendicular to the plane of NGC 4490 and has a total length of approximately 120 kpc (see Figure 2). One hypothesis for the origin of this structure is that it is the result of a star formation/supernova-driven outflow plume (Clemens et al., 1998). An extensive multi-wavelength study of NGC 4490/85 by Clemens et al. (1999) showed that the dynamic timescale for the formation of the plume ( yr) is consistent with a derived long-lived ( yr) constant high rate of star formation (4.7 M⊙ yr-1), which we will call the NGC 4490 starburst hereafter. In addition, H and X-ray observations (Clemens & Alexander 2002 and Richings et al. 2010 respectively) show filaments and outflow features that are consistent with the outflow hypothesis. Noting the minimal disruption of the optical disk of NGC 4490, Clemens et al. (1999) argued that we are observing the first encounter between it and NGC 4485. They estimated that the time since the closest approach (i.e., pericentric passage) was yr and estimated that the effects of the encounter on star formation in NGC 4490 would not become significant until yr after the closest approach.
Alternatively the H I emission may be from tidal features associated with the encounter between NGC 4485 and NGC 4490. Clemens et al. (1998) briefly considered this idea, but simulations of galaxy collisions between unequal mass galaxies available at that time did not show elongated structures matching the H I morphology. This idea was followed up by Pearson et al. (2018), who modeled the interaction and found a plausible encounter history that results in a baryonic mass distribution similar to what is observed in H I. In their best-match model there are two previous close encounters of the galaxies 1.3 Gyr and 0.19 Gyr ago, and the two galaxies are predicted to fully merge in another 0.4 Gyr. During the first passage a large tidal tail is formed primarily from NGC 4490 that eventually extends to a length of kpc. When viewed at a particular angle this tail is seen as a symmetric structure centered on NGC 4490 thus matching observations. One possible shortcoming of this model is the lack of an observed stellar component to the tidal feature as both stars and gas should be influenced by the tidal interaction; they suggest this apparent discrepancy could be the result of NGC 4490 having a gas-rich disk that is much larger than the stellar disk resulting in a gas dominated tidal feature. Pearson et al. (2018) concluded that star-formation driven outflows may add material to the observed envelope, but they are not the source of the bulk of the material seen as the symmetric H I structure.
In this paper we use multi-wavelength images of NGC 4490 to show that the galaxy has two nuclei; one is visible primarily at optical wavelengths while the other one becomes prominent only at infrared (IR) and radio wavelengths due to extinction within NGC 4490. The use of IR imaging to investigate the structure of interacting galaxies dates back to the advent of IR imaging arrays. For example, Stanford & Balcells (1990) used K-band images to show that there are two nuclei within the Arp 157 system, which led to it being used as the defining example of an intermediate-stage merger in the Hibbard & van Gorkom (1996) galactic merger sequence study. Stanford & Bushouse (1991) and Bushouse & Stanford (1992) conducted an IR imaging survey of approximately 180 Arp systems, but, since their survey was limited to objects that would fit within the arcsec field of view of their detector, the relatively nearby Arp 269 system with its large angular extent was not examined. Radio continuum and H emission associated with this second nucleus, which we will refer to as the ‘infrared’ nucleus, have been observed before (Seaquist et al., 1978; Duval, 1981), but our study is the first to compare its physical properties to the optically-visible nucleus. In the current paper, we show that it is comparable in mass and size, and we place this feature in the context of the history of the Arp 269 system. The fact that NGC 4490 could be a late-stage merging system, as suggested by the presence of two close nuclei, has implications for either picture of how the H I plume formed. In the star-formation driven hypothesis, the merger could act as the driver for the necessary extended period of star formation. In the tidal debris picture the previous merger is a new part of the Arp 269 system that must be accounted for, and the resulting nucleus is a major structural feature of the system that must be matched in any simulation.
| ParameteraaFor NGC 4490 unless otherwise indicated. | Value | Reference |
|---|---|---|
| RA (J2000) | 12 | See Figure 1 - optical nucleus |
| DEC (J2000) | See Figure 1 - optical nucleus | |
| Hubble Class | SB(s)7p | Clemens et al. (1998) |
| Hubble Class (4485) | IB(s)9p | Clemens et al. (1998) |
| Inclination Angle | 60° | Yim & van der Hulst (2016) |
| cz | 589 km s-1 | Falco et al. (1999) |
| DistancebbDerived using Hubble’s Law and velocity field described in Appendix A of Mould et al. (2000). | 9.2 Mpc | Yim & van der Hulst (2016) |
| D25 | 15 kpc | Clemens et al. (1998) |
| D25 (4485) | 5.6 kpc | Clemens et al. (1998) |
2 Observations
Unsurprisingly, given that Arp 269 is well known for being one of the closest interacting/merging galactic systems, there is an extensive collection of high-quality archival data available spanning a wide wavelength range. In Table 2 we list the various data sets used in this study, and, for convenience, we briefly summarize the key characteristics of the data in the following paragraphs. Unless otherwise indicated, data were downloaded from the NASA/IPAC Extragalactic Database111http://ned.ipac.caltech.edu (NED).
Ultraviolet (UV) data were obtained from the GALEX mission. GALEX was a NASA Small Explorer mission that operated between 2003 and 2012 making observations in two UV bands in the far-UV (FUV nm) and near-UV (NUV 232 nm). The properties of the various GALEX data products, including calibration details and resolution, are described in Morrissey et al. (2007).
Optical images of NGC 4490/85 (u, g, r, i, and z) were obtained from the Sloan Digital Sky Survey (SDSS; York et al., 2000; Gunn et al., 2006) SDSS-II Data Release 12 science archive server. In addition, we used narrow band H observations of NGC 4490/85 from the Steward Observatory’s 2.3-m Bok telescope at the Kitt Peak National Observatory (Kennicutt et al., 2008).
At infrared wavelengths we made use of data from the Two Micron All Sky Survey (2MASS) and the Spitzer space telescope. 2MASS is an all-sky near-infrared survey in the J (1.25 m), H (1.65 m), and Ks (2.16 m) bands (Skrutskie et al., 2006). Observations were conducted from two dedicated 1.3-m diameter telescopes located at Mount Hopkins, Arizona, and Cerro Tololo, Chile. The Spitzer mission is described in Werner et al. (2004). We made use of data from the 24, 70 and 160 m bands of the Multiband Imaging Photometer (MIPS; Rieke et al., 2004), and data from the 3.6, 4.5, 5.6, and 8.0 m bands of the Infrared Array Camera (IRAC; Fazio et al., 2004). The 3.6 and 4.5 m data are described in Sheth et al. (2010), and the observations in other bands are described in Dale et al. (2016).
At radio wavelengths, the 8.46 GHz continuum observation from the Very Large Array (VLA) was obtained from the NRAO VLA Archive Site. H I integrated 21-cm emission data (clipped at a signal to noise level of 3) was obtained from the WHISP (Westerbork observations of neutral Hydrogen (H I) in Irregular and SPiral galaxies) survey (van der Hulst et al., 2001) using the Westerbork Synthesis Radio Telescope (WSRT). Surface brightness in the WHISP maps are in Westerbork Units (WU), where 1 WU = 5 mJy beam-1 (Yim & van der Hulst, 2016). Images were created using a beam size of arcsec (ellipse major minor axes), and the data cube channel spacing is 4.14 km s-1. Details of the WHISP observations and data reduction can be found in van der Hulst et al. (2001), Swaters et al. (2002), and Noordermeer et al. (2005).
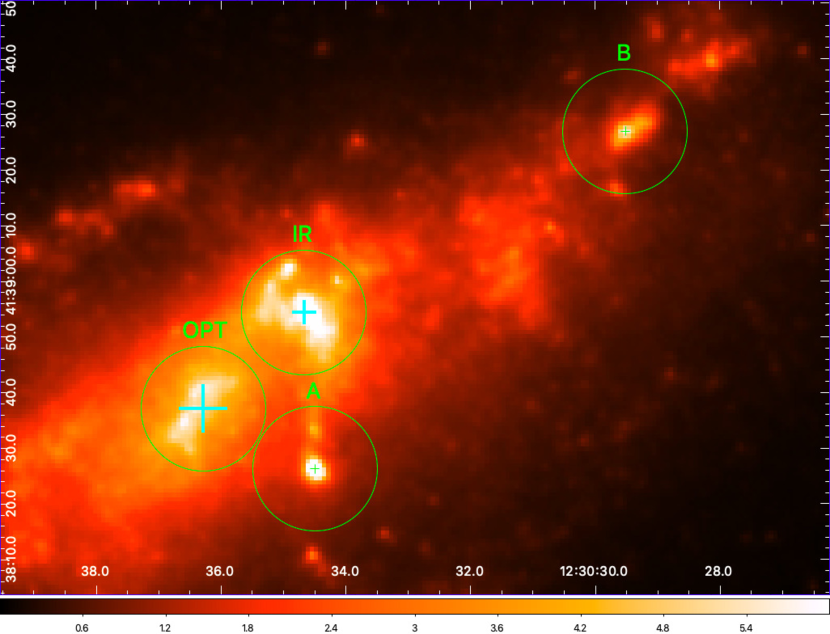
Figure 3 illustrates how the appearance of the central region of NGC 4490 changes dramatically with wavelength. The optical and the infrared nuclei are both best seen in the near-IR images. At longer wavelengths emission becomes dominated by heated dust in the interstellar medium and by emission associated with individual H II regions, which are evident in the H image. At shorter wavelengths dust obscures the infrared nucleus and the galaxy looks more like a normal galaxy with a single dominant nucleus.
| Source | Band | FITS Data Set | Resolution | |
|---|---|---|---|---|
| GALEX | FUV | 1539 | NGC4490IFUVd2009.fits | 4.2″ |
| NUV | 2316 | NGC4490INUVd2009.fits | 5.3″ | |
| SDSS | 3560 | frame-u-003840-2-0188.fits | ||
| 4680 | frame-g-003840-1-0188.fitsaaUsed for Figure 1 mosaic. | |||
| frame-g-003840-1-0189.fitsaaUsed for Figure 1 mosaic. | ||||
| frame-g-003840-2-0188.fitsaaUsed for Figure 1 mosaic.bbUsed for Figure 3. | ||||
| frame-g-003840-2-0189.fitsaaUsed for Figure 1 mosaic. | ||||
| 6180 | frame-r-003840-2-0188.fits | |||
| Bok | H | 6580 | NGC4490IHad2009.fits | |
| SDSS | i | 7500 | frame-i-003840-2-0188.fits | |
| 8790 | frame-z-003840-2-0188.fits | |||
| 2MASS | J | 1.25 m | 2MASSNGC4490J.fits | |
| H | 1.65 m | 2MASSNGC4490H.fits | ||
| Ks | 2.16 m | 2MASSNGC4490K.fits | ||
| Spitzer | IRAC | 3.6 m | NGC4485IIRAC3.6srh2010.fits | 1.66″ |
| 4.5 m | NGC4485IIRAC4.5srh2010.fits | 1.72″ | ||
| 5.8 m | NGC4485IIRAC5.8d2009.fits | 1.88″ | ||
| 8.0 m | NGC4485IIRAC8.0d2009.fits | 1.98″ | ||
| MIPS | 24 m | NGC4490IMIPS24d2009.fits | ||
| 70 m | NGC4490IMIPS70d2009.fits | |||
| 160 m | NGC4490IMIPS160d2009.fits | |||
| VLA | 8.46 GHz | 3.54 cm | 8.46I7.98AA01811995MAR16179.4U2.60M.imfits | |
| WHISP | H I | 21.147 cm | UGC07651FRI21cmh2002.fits |
3 Analysis
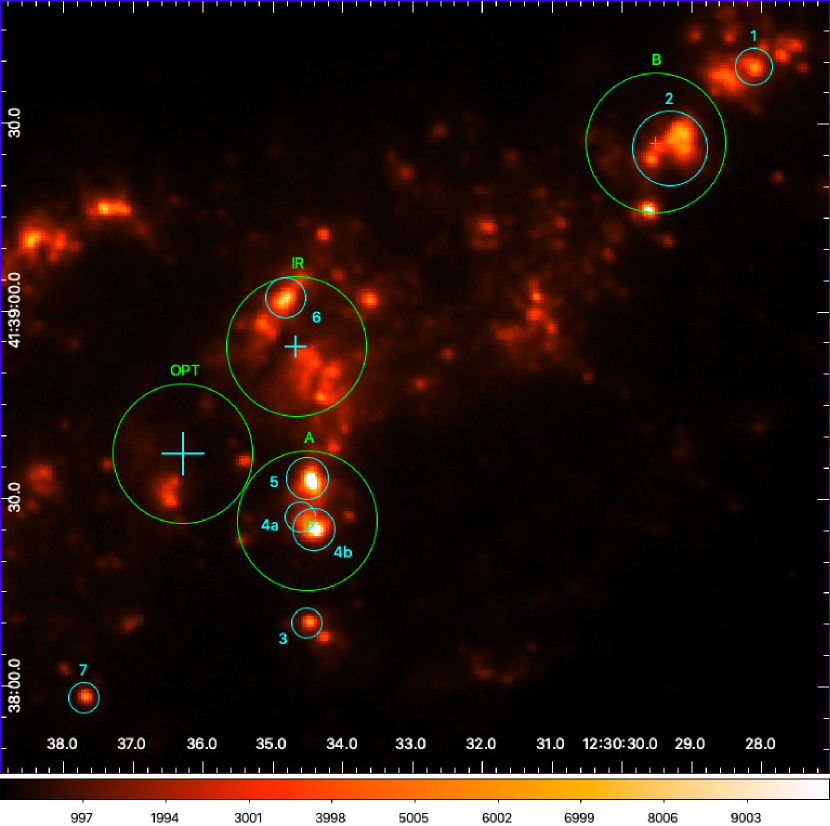
Since the optical and infrared nuclei are equally prominent at 3.6 m we used the Spitzer image in that band to define the apertures used for our analysis. Figure 4 shows the central and northwest portions of NGC 4490 at 3.6 m. We use 500 pc radius apertures centered on the optical nucleus (OPT) and the infrared nucleus (IR). These are shown along with similar apertures around two more compact regions (A and B). These two compact regions correspond to regions 4a+4b+5 and region 2 from the radio study of Clemens & Alexander (2002) respectively. An H image of NGC 4490 in Figure 5 shows the position and approximate extent of the Clemens & Alexander (2002) H II regions along with our apertures. We find the H luminosity (), calculated using the apertures shown in Figure 5, is and erg s-1 for regions A and B respectively. These values, and the compact nature of each source, are consistent with these regions being giant H II regions (e.g., see Table 9.1 in Conti et al. 2008). The of the H II regions A and B are both similar to the of 30 Doradus (1.5 x 1040 erg s-1), which was measured in a 370 pc diameter region (Conti et al., 2008; Kennicutt, 1984). The values calculated for the 500 pc regions (OPT, IR, A and B) and the galaxies (NGC 4490 and NGC 4485) are shown in column 22 of Table 3. The combined of the four 500 pc aperture regions (IR, OPT, A, and B) accounts for 25% of the total of NGC 4490.
3.1 Stellar Mass
The stellar mass () of the various regions can be estimated from Spitzer 3.6 and 4.5 m flux densities ( and ) using the Eskew et al. (2012) calibration, which was based on resolved observations of the Large Magellanic Cloud (LMC),
| (1) |
where the flux densities are in Jy, is the distance to NGC 4490 in Mpc, and the adopted distance to the LMC is 50 kpc. Photometry was obtained from sky-subtracted images for each of the nuclei at 3.6 and 4.5 m using the 500 pc apertures shown in Figure 4 with no local background subtraction. This means that the fluxes we measure include light from the inner portion of the undefined disk, the inner bulge (if any), in addition to the nucleus itself. In the following analysis, we use the term ‘nucleus’ to refer generically to this part of the galaxy. We also measured and for NGC 4490 and NGC 4485 using elliptical apertures of kpc and kpc respectively (semi-major semi-minor axis). In addition to the Mpc uncertainty in the distance to NGC 4490 (e.g., Clemens et al. (1998) uses 8 Mpc), the main source of error in the mass estimate is a uncertainty of up to caused by intrinsic scatter in the calibration (Eskew et al., 2012). All of the flux density measurements and derived masses are summarized in Table 3.
We find that the mass of the optical and infrared nuclei are comparable (), and each nucleus contains about 10 percent of the stellar mass of NGC 4490. The infrared and optical nuclei are each also 3 – 5 times more massive than either of the two H II regions, which each contain only 2 – 3 percent of the stellar mass of NGC 4490. As expected, the total stellar mass of NGC 4490 is much larger ( times) than NGC 4485, but it is approximately 5 times smaller than the Milky Way’s total stellar mass of (Licquia & Newman, 2015). Both NGC 4490 and NGC 4485 have stellar masses comparable ( and times larger) to the Large and Small Magellanic Clouds respectively (van der Marel et al., 2002; Stanimirović et al., 2004; Pearson et al., 2018).
| Aperture | RA (Center) | DEC (Center) | FUV | NUV | u | g | r | i | z | J | H | Ks | 3.6 m | 4.5 m | 5.8 m | 8 m | 24 m | 70 m | 160 m | |||
|---|---|---|---|---|---|---|---|---|---|---|---|---|---|---|---|---|---|---|---|---|---|---|
| Object | Radius (at 9.2 Mpc) | J2000 | J2000 | (mJy) | (mJy) | (mJy) | (mJy) | (mJy) | (mJy) | (mJy) | (mJy) | (mJy) | (mJy) | (mJy) | (mJy) | (mJy) | (mJy) | (mJy) | (mJy) | (mJy) | (erg s-1) | |
| Optical Nucleus (OPT) | 500 pc | 12 | 2.30 | 13.3 | 35.1 | 45.7 | 53.9 | 62.2 | 68.9 | 77.1 | 61.6 | 35.4 | 39.5 | 75.8 | 118 | 1860 | 1737 | 6.39E+39 | 9.04 | |||
| Infrared Nucleus (IR) | 500 pc | 12 | 3.02 | 7.72 | 16.4 | 24.2 | 28.3 | 35.8 | 45.4 | 55.6 | 49.9 | 38.0 | 80.7 | 198 | 471 | 4045 | 2571 | 1.95E+40 | 9.01 | |||
| HII Region A | 500 pc | 12 | 1.26 | 5.58 | 11.6 | 15.2 | 16.4 | 18.7 | 20.8 | 22.6 | 19.8 | 16.1 | 39.9 | 104 | 505 | 2059 | 1772 | 1.43E+40 | 8.53 | |||
| HII Region B | 500 pc | 12 | 0.49 | 2.61 | 5.06 | 7.38 | 7.01 | 8.50 | 9.38 | 10.0 | 8.95 | 11.3 | 39.2 | 103 | 311 | 2237 | 1807 | 1.23E+40 | 8.34 | |||
| NGC 4490aa North: PA = 0∘, East: PA = 90∘ (see Figure 1 for compass); PA refers to position of semi-major axis. | 9.12 4.31 kpc, PA = 117∘ | 12 | 79.4 | 172 | 401 | 543 | 633 | 719 | 784 | 930 | 757 | 572 | 1042 | 2374 | 4258 | 63119 | 90465 | 2.07E+41 | 10.1 | |||
| NGC 4485aa North: PA = 0∘, East: PA = 90∘ (see Figure 1 for compass); PA refers to position of semi-major axis. | 3.07 2.42 kpc, PA = 20∘ | 12 | 14.7 | 24.1 | 51.7 | 66.0 | 75.2 | 84.2 | 72.1 | 87.1 | 63.0 | 54.4 | 54.5 | 120 | 186 | 2689 | 5758 | 2.33E+40 | 8.86 |
| Object | aaIntegration between FUV and 160 m. | MBBbbIntegration between FUV and 1100 m. Single dust temperature (T), modified blackbody (MBB: , from Dunne et al. 2000) fit to the 70/160 flux density ratio, used for m. | ccIntegration between FUV and 3 m (linear interpolation between 2.16 and 3.6 m). | ddEmpirical calibration from Dale & Helou (2002), where the 3 to 1100 m luminosity (LTIR) is estimated from the 24, 70, and 160 m flux densities. | (3+TIR)eeSum of L and LTIR. | TffDust temperature for a modified blackbody (MBB) fit to the 70/160 flux density ratio. |
|---|---|---|---|---|---|---|
| (L☉) | (L☉) | (L☉) | (L☉) | (L☉) | (K) | |
| Optical Nucleus (OPT) | 1.51E+09 | 1.54E+09 | 1.06E+09 | 3.73E+08 | 1.40E+09 | 33.85 |
| Infrared Nucleus (IR) | 1.58E+09 | 1.63E+09 | 6.26E+08 | 7.63E+08 | 1.39E+08 | 38.48 |
| H II Region A | 9.72E+08 | 1.00E+09 | 3.69E+08 | 5.55E+08 | 9.24E+08 | 34.73 |
| H II Region B | 6.94E+08 | 7.26E+08 | 1.66E+08 | 4.74E+08 | 6.39E+08 | 35.45 |
| NGC 4490 | 2.71E+10 | 2.88E+10 | 1.30E+10 | 1.37E+10 | 2.67E+10 | 29.94 |
| NGC 4485 | 2.35E+09 | 2.47E+09 | 1.65E+09 | 7.11E+08 | 2.36E+09 | 27.01 |
3.2 Spectral Energy Distribution
To construct a spectral energy distribution (SED) for NGC 4485, NGC 4490, the infrared and optical nuclei, and the H II regions A and B, we obtained photometry on sky-subtracted images from the FUV at 1539 Å to the FIR at 160 m using the apertures described in the previous section (see Table 3. In all cases no local background subtraction was made. The photometry is summarized in Table 3, and the SEDs are shown in Figure 6. In Figure 6 the SED has been extended to 1100 m using a single dust temperature (T) modified blackbody, MBB: . For the dust emissivity we used (Dunne et al., 2000), and the dust temperature (T) was obtained by matching the (70/160) flux density ratio. See column 7 of Table 4 for the dust temperatures (T). We see that all six of the SEDs show a double-peak structure, as would be expected for a combination of stars and heated dust. Both of the galaxies have similar SEDs, although clearly NGC 4490 is much more luminous than NGC 4485. The shape of both galaxy SEDs is very similar to the shape of the infrared and optical nuclei SEDs.
We measured the bolometric (FUV to 1100 m) luminosity for the objects in two ways. In the first technique we extended the SED beyond 160 m using a MBB; , with and T set by the (70/160) flux density ratio (see column 7 of Table 4). The FUV to 1100 m SED (see Figure 6) was numerically integrated using the trapezoidal rule (i.e., using a piecewise linear approximation for the SED), and the resulting luminosity, , is shown in column 3 of Table 4. For reference, we also show the luminosity obtained when the integration omits the FIR ( 160 m) and covers the range 0.1539 160 m ( in column 2 of Table 4).
In the second technique we first integrated between FUV and 3 m (L3, column 4 in Table 4), where the 3 m point was estimated using a linear interpolation between the 2.16 and 3.6 m flux densities. To account for emission beyond 3 m we then used the empirical calibration from Dale & Helou (2002), where the 3 to 1100 m luminosity (LTIR) can be estimated from the 24, 70, and 160 m flux densities. is shown in column 5 of Table 4 and the bolometric luminosity estimate, (3+TIR), found by combining and is shown in column 6. Inspection of Table 4 shows that the luminosity found in this manner is (5–15%) lower than the luminosity found using the MBB. For simplicity we will adopt the MBB bolometric values in further discussions.
We find that both the infrared and optical nuclei have similar bolometric luminosities: . They each contribute about five percent to the total luminosity of NGC 4490, and are each about 60 percent as luminous as the entire NGC 4485 galaxy. The H II regions A and B both have a lower, but still significant, bolometric luminosity compared to either nuclei. For region A: and . Similarly for region B: and . We discuss the nucleus and H II region luminosities further in subsection 4.3.

3.3 Radial Profiles
We also compare the optical and infrared nuclei, and the two H II regions A and B, by examining their 3.6 m radial surface brightness profiles constructed using IDL. The same apertures used for photometry were divided into a series of concentric annuli of width 0.75 arcsec (3.6 m image pixel size, 33.45 pc at 9.2 Mpc), and the average surface brightness within each annulus was calculated. The resulting normalized radial profiles are shown in Figure 7.
H II regions A and B both have sharply peaked profiles showing that the emission within the aperture is dominated by a single compact central source. In contrast, the OPT aperture profile shows a shallow, essentially linear, decrease in brightness. The IR aperture profile is a combination of these two profile types. There is a steep drop off at small distance, like the H II region profiles, followed by a more shallow linear decrease similar to the OPT profile. There are a number of compact H II regions within the IR aperture, as can be seen in the H image (Figure 5). In particular, H II region 13 from Boulesteix et al. (1970) is very close to the center of the aperture and is the cause of the central peak in the radial profile. Some smaller compact sources, not cataloged by Boulesteix et al. (1970), are responsible for the departure from linearity observed around a radius of 10 pixels.
In order to separate the compact and diffuse emission components in these regions we applied the spatial filtering technique described in Sofue & Reich (1979). Starting with an initial image, denoting the surface brightness at any given position as , a smoothed version of the image is created using a Gaussian smoothing kernel. A new image, , is calculated, where if , and if . The image is then smoothed using the same Gaussian kernel creating a large-scale structure image, . A map of the small-scale emission structure is calculated as . The exact spatial scale isolated using this technique is controlled by the size of the Gaussian kernel. For our data we used a Gaussian kernel with a FWHM arcsec, effectively removing point-source like emission from the m image. The initial 3.6 m image and the resulting and images are shown in the upper row and lower left panel of Figure 8. Comparison of the small-scale structure image with the H image shown in the lower right panel of Figure 8 shows the filtering technique has done a good job of isolating compact emission features likely associated with H II regions.
Using the same technique described before, we obtained radial profiles for the optical and infrared nuclei as seen in the large-scale structure image (upper right panel of Figure 8). As expected, there is only a minimal change to the normalized profile of the optical nucleus. In contrast, the radial profile of the infrared nucleus now closely resembles that of the optical nucleus; there is a shallow linear decrease in intensity over the entire aperture.

3.4 Star Formation Rate
The combination of FUV and 24 m IR emission has proven to be a good tracer of the star formation rate (SFR) of an extragalactic system (Calzetti et al., 2007; Leroy et al., 2008; Yim & van der Hulst, 2016). To calculate this quantity our GALEX FUV and Spitzer 24 m images of NGC 4490/85 were first reprojected to a common pixel grid using montage (Berriman & Good, 2017), and the FUV image was converted from counts s-1 to MJy sr-1 to match the 24 m data. The SFR surface density, , was then calculated on a pixel by pixel basis using the following equation from Leroy et al. (2008):
| (2) |
where and are the FUV and 24 m surface brightness in MJy sr-1, and is the inclination angle of the galaxy. was then integrated over the appropriate aperture to obtain the total SFR ( yr-1) for the region of interest. To facilitate comparison of our results with earlier estimates of the SFR, we multiplied our SFR values by a factor of 1.59 (Leroy et al., 2008). This converts the SFR derived using Equation 2, which is based on a Kroupa (2001) initial mass function (IMF) with a stellar mass range of = 0.1 – 120 , to a SFR appropriate for a Salpeter (1955) IMF with a stellar mass range of = 0.1 – 100 .
SFR was also calculated for the various regions with a combination of H and 24 using the following equation from Calzetti et al. (2007):
| (3) |
where the luminosities are in erg s-1 and is expressed as Lν. As before, we multiplied our SFR values by a factor of 1.59 to convert the SFR derived using Equation 3, which is which is based on a Kroupa (2001) initial mass function (IMF) with a stellar mass range of = 0.1 – 120 , to a SFR appropriate for a Salpeter (1955) IMF with a stellar mass range of = 0.1 – 100 .
Our SFR calculations are summarized in the upper part of Table 5. Each region or galaxy is listed in column 1. Column 4 gives the total SFR for each region calculated using Equation 2 while Columns 2 and 3 of Table 5 show the SFR that would be obtained using only the first or second terms of Equation 2 respectively. The ratio of these quantities, which provides a measure of the degree to which the star formation activity is obscured or embedded, is shown in column 6 of Table 5. The SFR calculated using Equation 3 is shown in column 5. In the lower part of Table 5 we list two SFR estimates for NGC 4490 from the literature. Clemens et al. (1999) obtained 4.7 yr-1 as the SFR of NGC 4490 using radio emission and an extended Miller-Scalo IMF ( = 0.1 – 100 ), which is similar to the Salpeter IMF (Kennicutt, 1983). Clemens & Alexander (2002) used the H luminosity and a Salpeter IMF ( = 0.1 – 100 ) to obtain a SFR of 3.4 yr-1 for NGC 4490.
The similarity of the SFR for the IR aperture and the H II regions A and B is because there are compact H II regions within this aperture as discussed in the previous section. Comparing columns 4 and 5, we see that the SFR estimates using the two different techniques agree to within the errors associated with the parameter uncertainties in each formula. Comparing the NGC 4490 results in columns 4 and 5 with the results shown in the lower part of the table we see that our H value agrees with Clemens & Alexander (2002), and our FUV value is slightly lower. Unfortunately the Clemens & Alexander (2002) and Clemens et al. (1999) values do not have reported uncertainties, but we can conclude that all of the SFR values derived from the different techniques for NGC 4490 agree to within a factor of two or better.
| Object | SFRFUV | SFR | SFRFUV+24μmaaSFR calculation procedure from Leroy et al. (2008) with Salpeter IMF ( = 0.1 – 100 ) using FUV and m data. | SFRHα+24μmbbSFR calculation procedure from Calzetti et al. (2007) with Salpeter IMF ( = 0.1 – 100 ) using H and m data. | SFR |
|---|---|---|---|---|---|
| [/yr] | [/yr] | [/yr] | [/yr] | Ratio | |
| Optical Nucleus (OPT) | 0.029 | 0.054 | 0.084 | 0.092 | 1.8 |
| Infrared Nucleus (IR) | 0.018 | 0.13 | 0.14 | 0.32 | 12 |
| H II Region A | 0.019 | 0.22 | 0.24 | 0.29 | 12 |
| H II Region B | 0.0084 | 0.14 | 0.15 | 0.21 | 16 |
| NGC 4485 | 0.12 | 0.080 | 0.20 | 0.26 | 0.65 |
| NGC 4490 | 0.53 | 1.8 | 2.4 | 3.15 | 3.4 |
| NGC 4490ccFrom Clemens & Alexander (2002). SFR calculated using H luminosity with Salpeter IMF ( = 0.1 – 100 ). | 3.4 | ||||
| NGC 4490ddFrom Clemens et al. (1999). SFR calculated using integrated thermal emission from radio observations with an extended Miller-Scalo IMF ( = 0.1 – 100 ). | 4.7 |
Note. — Superscript and subscript values represent the range of calculated values consistent with the parameter uncertainties in the applicable SFR formula.
4 Discussion
Clearly the infrared nucleus within NGC 4490 is a significant structural component of the galaxy. Our analysis has shown that, compared to the optical nucleus, it has a similar spatial extent, stellar mass, bolometric luminosity, and radial brightness profile at 3.6 m. The feature is particularly intriguing as a double nucleus morphology is not a common structure seen in low redshift spiral galaxies. For example, the Spitzer Infrared Nearby Galaxy Survey (SINGS; Kennicutt et al., 2003) legacy project examined a sample of 75 nearby ( Mpc) galaxies representing the full range of Hubble types. While this is not a complete survey, it is interesting to note that none of the spiral galaxies observed as part of SINGS show a double-nucleus morphology in the near and mid infrared like we see in NGC 4490. In the following subsections we discuss possible origins of the infrared nucleus/region and the different implications for the history of the Arp 269 system. We then compare our results to other observations of nuclei and star-formation regions found in interacting galaxies.
4.1 A Merger Remnant?
Given the similarities between the IR feature and the optical nucleus, one natural interpretation is that the IR feature is the nucleus of a late-stage minor-merger remnant. Closely spaced double nuclei observed in other galaxies are typically interpreted as being due to a minor merger. For example, Gimeno et al. (2004) examined various major galaxy catalogs (e.g., Petrosian et al., 1978; Mazzarella et al., 1991) as well as the literature to identify spiral galaxies with reported double nuclei that are candidates for minor mergers. Their final catalog contains 107 spiral galaxies with km s-1 or , corresponding to distances Mpc. We note that only two of the galaxies listed in this combined catalog have distances smaller than the distance to NGC 4490.
Since the pioneering study of Larson & Tinsley (1978), numerous studies have concluded that mergers/interactions between galaxies can trigger/create higher rates of star formation than in isolated galaxies (e.g., see the Smith et al. (2016) comparative study of 46 nearby ( Mpc) interacting galaxies). The connection between mergers and intense star formation is dramatically illustrated by the more extreme ultra-luminous infrared galaxies (ULIRGs). ULIRGs, defined by L☉, are known to contain starbursts driven by interacting pairs of equal mass disk galaxies that are in advanced phases of merging (see Kim et al. 2002, Veilleux et al. 2002, and Veilleux et al. 2006). A thorough discussion of all aspects of galaxy collisions/interactions, including the association of star formation and collisions, can be found in the reviews by Barnes & Hernquist (1992), Struck (1999), and Struck (2006).
In this picture the Arp 269 system should be viewed as a triple system, where NGC 4490 is a late-stage merger that is now interacting with NGC 4485. This earlier merger provides a possible driver for the NGC 4490 starburst. Privon et al. (2017) suggest that large-scale, extended star formation is expected for interactions between low-mass galaxies, in contrast to higher-mass galaxy interactions which lead to a nuclear starburst. Lotz et al. (2008) examined merger time scales applicable to mergers between equal-size spiral galaxies, and found the full merger takes place on 1-3 Gyr time scales. The models of Pearson et al. (2018) suggest that a similar timescale is also applicable for minor mergers. The Lotz et al. (2008) models also found that the star formation activity induced by the merger lasts for yr. These timescales compare favorably with the SF driven emplacement timescale of the NGC 4490 H I plume of yr (Clemens et al., 1998) and the estimated duration of continuous high levels of star formation in NGC 4490 (constant for years) from Clemens et al. (1999).
Alternatively NGC 4490 may be a merger remnant, but the extended H I plume may instead be primarily a tidal feature related to the merger of two gas-rich dwarf galaxies. The Pearson et al. (2016) study of H I in dwarf galaxy pairs found that a significant fraction of the H I lies outside the optical extent of such galaxies so mergers involving dwarf pairs have the potential to create extensive H I features. Using the H I Rogues Gallery (Hibbard et al., 2001) as a guide, we found four comparable examples of gas-rich merging systems in the literature. I Zw18 is a nearby ( Mpc) blue compact dwarf galaxy embedded in a huge H I envelope, and van Zee et al. (1998a) consider a merger is one possible origin for the H I morphology. A better analog may be the blue compact dwarf II Zw40, which has a strikingly elongated H I morphology. van Zee et al. (1998b) consider II Zw40 to be a clear example of an ongoing merger between two gas-rich dwarf galaxies. NGC 2146 is a larger galaxy, but it also has highly elongated H I filaments. Taramopoulos et al. (2001) suggest that these formed due to the interaction between NGC 2146 and a (no longer visible) low-surface brightness late-type gas-rich galaxy. Finally, Iyer et al. (2004) examined the Arp 158 system and showed that the H I extends well beyond the optical extent of the system. They conclude that it is a mid-stage merger similar to the prototypical mid-stage merger system, Arp 157, discussed in Hibbard & van Gorkom (1996). Each of these systems are possible analogs of NGC 4490, minus the additional interaction with NGC 4485.
A variation on this scenario is that the H I surrounding Arp 269 is actually a large, highly warped, H I disk. This picture was considered by Clemens et al. (1998), but they rejected it because there was no obvious way to obtain the degree of warping required. Given the similarity of the mass and size of the optical and infrared nuclei a major-merger cannot be discounted, and could induce the necessary severe disk warping. In this case, the H I “plume” would be the highly warped remnant of the progenitor disk(s).
4.2 An Induced Star-Formation Complex?
In the Pearson et al. (2018) model of the Arp 269 system, the need for a star-formation driven wind is removed as the H I plume is primarily a tidal feature from the initial encounter between NGC 4485 and NGC 4490. In this scenario the feature we are calling the infrared nucleus would be an large region of star-formation activity induced by one or both or the NGC 4490/85 encounters. The star-formation activity associated with the clump may still contribute material to the H I plume, but it is not the primary source of the plume.
In favor of this picture is the fact that the infrared nucleus region clearly contains signposts of active star formation activity (see subsection 3.3). In addition, radio continuum emission from the region corresponding to the infrared nucleus was first observed at 2.7 and 8.1 GHz by Seaquist et al. (1978). These aperture synthesis observations had high enough resolution (9 and 3 arcsec respectively) to show clearly that the strongest radio emission from NGC 4490 is an extended non-thermal source located within an H II region complex offset from the optical center of the galaxy. Seaquist et al. (1978) also show that the thermal radio emission from the H II regions themselves contribute only a small amount to the total radio emission, and they suggest that the non-thermal emission arises from multiple supernova events.
4.3 Comparison to Clumps in Other Interacting Galaxies
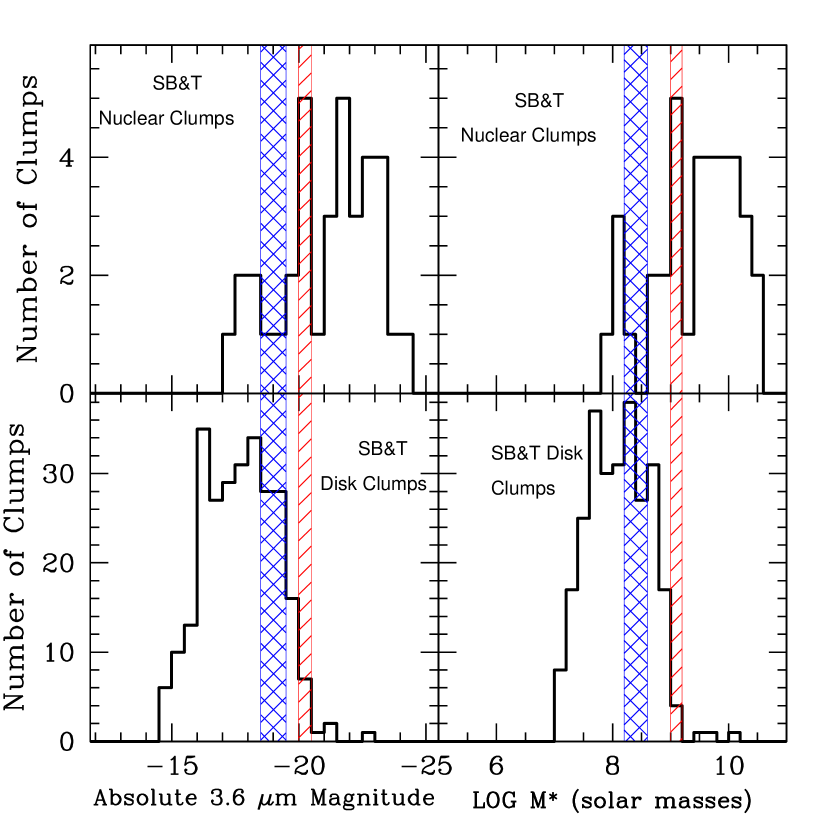
To distinguish between the above two possibilities for the nature of the infrared feature in NGC 4490, we compared the 3.6 m luminosities and the derived stellar masses of the optical nucleus and the infrared nucleus/region in NGC 4490 with both nuclei and extra-nuclear star-forming regions within other interacting galaxies. As a comparison sample, we used the Spirals, Bridges, and Tails (SB&T) sample of nearby pre-merger galaxy pairs studied by Smith et al. (2007, 2010, 2016). Using 8.0 m Spitzer images, Smith et al. (2016) selected discrete regions of emission (“clumps”), which were then classified as disk clumps (likely star-forming regions/complexes) or nuclear clumps (likely galactic nuclei) based on their position and relative brightness in Spitzer 3.6 m images.
Smith et al. (2016) did their clump photometry using apertures of 2.5 kpc and 1.0 kpc radii. To match our measurements for the nuclei in Arp 269, we re-did the Smith et al. (2016) clump and nuclear photometry on sky-subtracted images using smaller aperture radii of 500 pc and did not subtract a local background on the galaxy. We made aperture corrections to the photometry interpolating between the suggested values from the IRAC Instrument Handbook 222http://irsa.ipac.caltech.edu/data/SPITZER/docs. We limited our sample to the 18 SB&T pairs with distances less than 43 Mpc. At that distance, a 500 pc radius corresponds to 2.4 arcsec, which is the minimum radius suggested for aperture corrections for IRAC.
In the upper and bottom left panels of Figure 9, we provide histograms of the 3.6 m absolute magnitudes of the nuclei and the disk clumps, respectively. The red hashed areas give the location of the absolute 3.6 m magnitudes of the optical nucleus and the infrared nucleus/region in NGC 4490. For the disk and nuclear regions in the SB&T sample, we calculated stellar masses from the 3.6 m and 4.5 m flux densities using Equation 1 (see subsection 3.1). In the right panels of Figure 9, we compare the masses of the SB&T nuclei (top panel) and disk clumps (bottom panel) with the optical nucleus and the infrared nucleus/region in NGC 4490. This comparison shows that the OPT and IR regions in NGC 4490 are more luminous and more massive than almost all of the SB&T disk clumps. If the possible second nucleus (IR) in NGC 4490 is only an extra-nuclear star-forming region, then it is both extremely luminous and very massive for such a region. In contrast, when we consider the SB&T nuclear clumps, both of the NGC 4490 regions lie just slightly below the median 3.6 m absolute magnitude and ) bins. In Figure 9 we also show the values for the H II regions A and B as blue hashed areas. We see that these regions fall well within the disk clump distributions and are located well below the median magnitude and mass values for nuclear clumps.
Some idea of how these clumps compare to nuclei and H II regions in a sample of (primarily) non-interacting galaxies can be obtained from data from Kennicutt et al. (1989). In their Figure 2 they show the distribution of H luminosities for a sample of approximately 80 nuclei (“H II nuclei”) and disk H II regions. Comparing our measured H luminosities with these distributions, we find that both the OPT and IR regions have H luminosities ( and 40.29) that are higher than the average nuclei luminosity (), but fall to the lower end of the starburst nuclei distribution. The A and B H II regions, with and 40.09) fall in the very high luminosity tail of the disk H II regions. These results are similar to what we see with the SB&T sample.
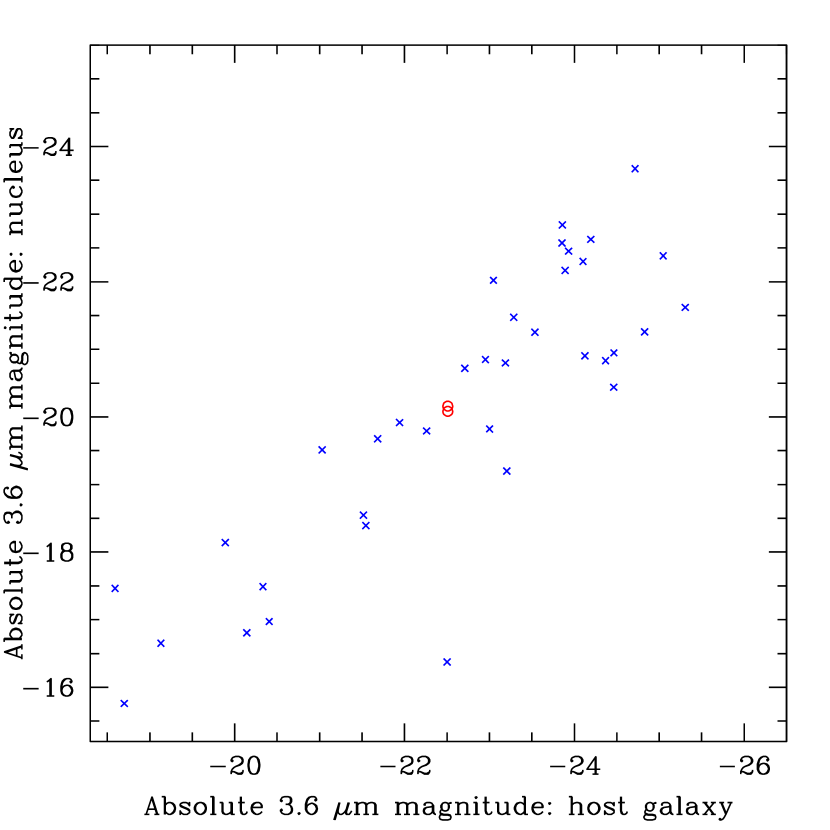
In general, the more luminous a galaxy, the more luminous the central nucleus/bulge. We illustrate this trend in Figure 10, where we compare the 3.6 m absolute magnitudes of the SB&T nuclei with the total 3.6 m absolute magnitudes of their host galaxy. A clear correlation is present and the NGC 4490 nuclei both fit this correlation.
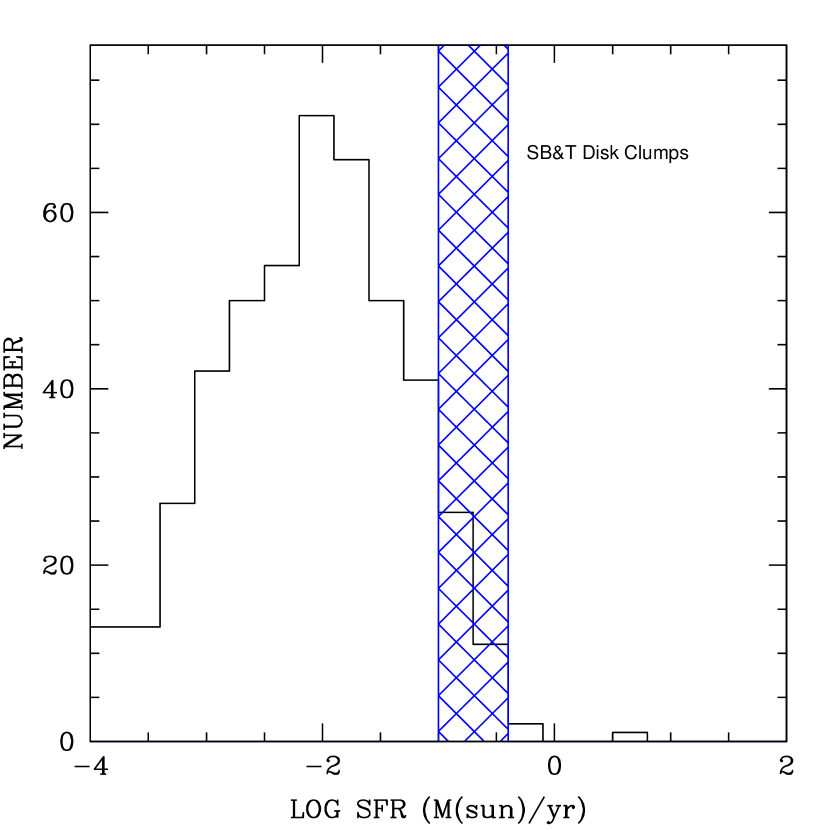
In Figure 11 we show the SFR for the disk clumps in the SB&T sample along with the position of the H II regions A and B. We see that SFR of these regions is on the high-end tail of the SFR distribution.
5 Conclusions
NGC 4490 has a clear double nucleus structure. One nuclei is optically visible while the other is dust shrouded and is prominent at infrared and radio wavelengths. The double nucleus morphology is best observed at NIR wavelengths.
The infrared nucleus has similar physical properties as the optical nucleus. Comparison with a sample of SB&T pre-merger galaxy pairs show that the luminosity and stellar mass of the feature is similar to other galactic nuclei and much larger than most extra-nuclear star-forming regions. The most straightforward interpretation of the observations is that NGC 4490 is itself a late-stage merger remnant. Such a merger could drive the extended high level of star formation activity required for a star-formation driven emplacement of the Arp 269 H I plume. Variations on this merger scenario would have the extended H I morphology arising either as a tidal feature related to the merger, or as a highly warped disk. An alternative interpretation is that the infrared nucleus is actually a very large active region of star formation induced by the encounter(s) between NGC 4490 and NGC 4485. In this picture the H I plume is primarily a tidal feature, but the intense star-formation activity associated with the infrared region would be expected to contribute material to the plume via stellar and supernova driven outflows.
Regardless of the merger history of the Arp 269 system, and the exact emplacement mechanism of the H I plume (tidal, disk, non-tidal, combination), we have shown that the infrared nucleus/feature in NGC 4490 is a significant structure. Its origin and influence should be considered in any future studies of the Arp 269 system.
References
- Arp (1966) Arp, H. 1966, ApJS, 14, 1
- Barnes & Hernquist (1992) Barnes, J. E., & Hernquist, L. 1992, ARA&A, 30, 705
- Berriman & Good (2017) Berriman, G. B., & Good, J. C. 2017, PASP, 129, 058006
- Boulesteix et al. (1970) Boulesteix, J., Dubout-Crillon, R., & Monnet, G. 1970, A&A, 8, 204
- Bushouse & Stanford (1992) Bushouse, H. A., & Stanford, S. A. 1992, ApJS, 79, 213
- Calzetti et al. (2007) Calzetti, D., Kennicutt, R. C., Engelbracht, C. W., et al. 2007, ApJ, 666, 870
- Clemens & Alexander (2002) Clemens, M. S., & Alexander, P. 2002, MNRAS, 333, 39
- Clemens et al. (1998) Clemens, M. S., Alexander, P., & Green, D. A. 1998, MNRAS, 297, 1015
- Clemens et al. (1999) —. 1999, MNRAS, 307, 481
- Conti et al. (2008) Conti, P. S., Crowther, P. A., & Leitherer, C. 2008, From Luminous Hot Stars to Starburst Galaxies (Cambridge, UK: Cambridge Univ. Press)
- Dale & Helou (2002) Dale, D. A., & Helou, G. 2002, ApJ, 576, 159
- Dale et al. (2016) Dale, D. A., Beltz-Mohrmann, G. D., Egan, A. A., et al. 2016, AJ, 151, 4
- Dunne et al. (2000) Dunne, L., Eales, S., Edmunds, M., et al. 2000, MNRAS, 315, 115
- Duval (1981) Duval, M. F. 1981, A&A, 98, 352
- Eskew et al. (2012) Eskew, M., Zaritsky, D., & Meidt, S. 2012, AJ, 143, 139
- Falco et al. (1999) Falco, E. E., Kurtz, M. J., Geller, M. J., et al. 1999, PASP, 111, 438
- Fazio et al. (2004) Fazio, G. G., Hora, J. L., Allen, L. E., et al. 2004, ApJS, 154, 10
- Gimeno et al. (2004) Gimeno, G. N., Díaz, R. J., & Carranza, G. J. 2004, AJ, 128, 62
- Gunn et al. (2006) Gunn, J. E., Siegmund, W. A., Mannery, E. J., et al. 2006, AJ, 131, 2332
- Hibbard & van Gorkom (1996) Hibbard, J. E., & van Gorkom, J. H. 1996, AJ, 111, 655
- Hibbard et al. (2001) Hibbard, J. E., van Gorkom, J. H., Rupen, M. P., & Schiminovich, D. 2001, in Astronomical Society of the Pacific Conference Series, Vol. 240, Gas and Galaxy Evolution, ed. J. E. Hibbard, M. Rupen, & J. H. van Gorkom, 657
- Huchtmeier et al. (1980) Huchtmeier, W. K., Seiradakis, J. H., & Materne, J. 1980, A&A, 91, 341
- Iyer et al. (2004) Iyer, M. G., Simpson, C. E., Gottesman, S. T., & Malphrus, B. K. 2004, AJ, 128, 985
- Kennicutt (1983) Kennicutt, R. C., J. 1983, ApJ, 272, 54
- Kennicutt (1984) —. 1984, ApJ, 287, 116
- Kennicutt et al. (1989) Kennicutt, Robert C., J., Keel, W. C., & Blaha, C. A. 1989, AJ, 97, 1022
- Kennicutt et al. (2008) Kennicutt, Robert C., J., Lee, J. C., Funes, J. G., et al. 2008, ApJS, 178, 247
- Kennicutt et al. (2003) Kennicutt, Robert C., J., Armus, L., Bendo, G., et al. 2003, PASP, 115, 928
- Kim et al. (2002) Kim, D. C., Veilleux, S., & Sanders, D. B. 2002, ApJS, 143, 277
- Kroupa (2001) Kroupa, P. 2001, MNRAS, 322, 231
- Larson & Tinsley (1978) Larson, R. B., & Tinsley, B. M. 1978, ApJ, 219, 46
- Leroy et al. (2008) Leroy, A. K., Walter, F., Brinks, E., et al. 2008, AJ, 136, 2782
- Licquia & Newman (2015) Licquia, T. C., & Newman, J. A. 2015, ApJ, 806, 96
- Liu et al. (2011) Liu, G., Koda, J., Calzetti, D., Fukuhara, M., & Momose, R. 2011, ApJ, 735, 63
- Lotz et al. (2008) Lotz, J. M., Jonsson, P., Cox, T. J., & Primack, J. R. 2008, MNRAS, 391, 1137
- Mazzarella et al. (1991) Mazzarella, J. M., Bothun, G. D., & Boroson, T. A. 1991, AJ, 101, 2034
- Morrissey et al. (2007) Morrissey, P., Conrow, T., Barlow, T. A., et al. 2007, ApJS, 173, 682
- Mould et al. (2000) Mould, J. R., Huchra, J. P., Freedman, W. L., et al. 2000, ApJ, 529, 786
- Noordermeer et al. (2005) Noordermeer, E., van der Hulst, J. M., Sancisi, R., Swaters, R. A., & van Albada, T. S. 2005, A&A, 442, 137
- Pearson et al. (2016) Pearson, S., Besla, G., Putman, M. E., et al. 2016, Monthly Notices of the Royal Astronomical Society, 459, 1827
- Pearson et al. (2018) Pearson, S., Privon, G. C., Besla, G., et al. 2018, MNRAS, 480, 3069
- Peng et al. (2002) Peng, C. Y., Ho, L. C., Impey, C. D., & Rix, H.-W. 2002, AJ, 124, 266
- Peng et al. (2010) —. 2010, AJ, 139, 2097
- Petrosian et al. (1978) Petrosian, A. R., Saakian, K. A., & Khachikian, E. E. 1978, Astrofizika, 14, 69
- Pogson (1856) Pogson, N. 1856, MNRAS, 17, 12
- Privon et al. (2017) Privon, G. C., Stierwalt, S., Patton, D. R., et al. 2017, ApJ, 846, 74
- Richings et al. (2010) Richings, A. J., Fabbiano, G., Wang, J., & Roberts, T. P. 2010, ApJ, 723, 1375
- Rieke et al. (2004) Rieke, G. H., Young, E. T., Engelbracht, C. W., et al. 2004, ApJS, 154, 25
- Salpeter (1955) Salpeter, E. E. 1955, ApJ, 121, 161
- Seaquist et al. (1978) Seaquist, E. R., Davis, L., & Bignell, R. C. 1978, A&A, 63, 199
- Sheth et al. (2010) Sheth, K., Regan, M., Hinz, J. L., et al. 2010, PASP, 122, 1397
- Skrutskie et al. (2006) Skrutskie, M. F., Cutri, R. M., Stiening, R., et al. 2006, AJ, 131, 1163
- Smith et al. (2010) Smith, B. J., Giroux, M. L., Struck, C., & Hancock, M. 2010, AJ, 139, 1212
- Smith et al. (2007) Smith, B. J., Struck, C., Hancock, M., et al. 2007, AJ, 133, 791
- Smith et al. (2016) Smith, B. J., Zaragoza-Cardiel, J., Struck, C., Olmsted, S., & Jones, K. 2016, AJ, 151, 63
- Sofue & Reich (1979) Sofue, Y., & Reich, W. 1979, A&AS, 38, 251
- Stanford & Balcells (1990) Stanford, S. A., & Balcells, M. 1990, ApJ, 355, 59
- Stanford & Bushouse (1991) Stanford, S. A., & Bushouse, H. A. 1991, ApJ, 371, 92
- Stanimirović et al. (2004) Stanimirović, S., Staveley-Smith, L., & Jones, P. A. 2004, ApJ, 604, 176
- Struck (1999) Struck, C. 1999, Phys. Rep., 321, 1
- Struck (2006) —. 2006, Galaxy Collisions — Dawn of a New Era, ed. J. W. Mason, 115
- Swaters et al. (2002) Swaters, R. A., van Albada, T. S., van der Hulst, J. M., & Sancisi, R. 2002, A&A, 390, 829
- Taramopoulos et al. (2001) Taramopoulos, A., Payne, H., & Briggs, F. H. 2001, A&A, 365, 360
- van der Hulst et al. (2001) van der Hulst, J. M., van Albada, T. S., & Sancisi, R. 2001, in Astronomical Society of the Pacific Conference Series, Vol. 240, Gas and Galaxy Evolution, ed. J. E. Hibbard, M. Rupen, & J. H. van Gorkom, 451
- van der Marel et al. (2002) van der Marel, R. P., Alves, D. R., Hardy, E., & Suntzeff, N. B. 2002, AJ, 124, 2639
- van Zee et al. (1998b) van Zee, L., Skillman, E. D., & Salzer, J. J. 1998b, AJ, 116, 1186
- van Zee et al. (1998a) van Zee, L., Westpfahl, D., Haynes, M. P., & Salzer, J. J. 1998a, AJ, 115, 1000
- Veilleux et al. (2002) Veilleux, S., Kim, D. C., & Sanders, D. B. 2002, ApJS, 143, 315
- Veilleux et al. (2006) Veilleux, S., Kim, D. C., Peng, C. Y., et al. 2006, ApJ, 643, 707
- Viallefond et al. (1980) Viallefond, F., Allen, R. J., & de Boer, J. A. 1980, A&A, 82, 207
- Werner et al. (2004) Werner, M., Roellig, T. L., Low, F. J., et al. 2004, in American Astronomical Society Meeting Abstracts, Vol. 204, American Astronomical Society Meeting Abstracts #204, 33.01
- Yim & van der Hulst (2016) Yim, K., & van der Hulst, J. M. 2016, MNRAS, 463, 2092
- York et al. (2000) York, D. G., Adelman, J., Anderson, John E., J., et al. 2000, AJ, 120, 1579