Intense Anti-Stokes Emission of Erbium Ions in Gallium Lanthanum Sulphide-Oxide Glass in Visible Spectral Range
Abstract
Photoluminescence spectra have been investigated in Er3+ doped GaLaS(O) glasses. The samples demonstrate intense ‘‘green’’ emission bands centered at around 525 and 550 nm due to up-conversion processes in Er3+ ions. The theoretical description of up-conversion intensity as a function of excitation intensity has been offered. It is based on a solution of a system of rate equations taking into account three up-conversion transitions.
I Introduction
Rare-earth doped chalcogenide glasses demonstrating effective up-conversion are attractive for many practical applications including up-conversion fiber optical lasers Scheps , up-converters for solar cells to convert Sun’s IR radiation into visible Kharel and others. These glasses may also be used as doped glasses where, due to their exceptionally low phonon energy, the up-conversion effects may investigated at its fullest.
In the present paper we investigate the intense visible green and red up-conversion in gallium lanthanum sulphide-oxide glass GaLaS(O) doped with trivalent Er3+ erbium ions Ravagli . These glasses may demonstrate high efficiency up-conversion as well as high quantum yield of ‘‘regular’’ photoluminescence (PL) presumably due to insignificant non-radiative losses which are typical for these glasses. The addition of oxygen into the well studied glass matrix GaLaS Hewak shifts the optical absorption edge towards higher energies further improving up-conversion conditions by suppressing losses due to energy exchange between electron subsystem of chalcogenide matrix and excited levels of the erbium ion Tverjanovich .
Luminescent properties of ions with discreet sets of energy levels may be reasonably well described theoretically by a set of rate equations Carroll taking into account several lower energy levels. In reality, these levels may be complicated manifolds consisting of overlapping Stark levels broadened by the presence of a non-crystalline matrix. In the present paper, we offer a simple phenomenological method to calculate the PL intensity by using the appropriate functions. We stick to ten energy level ionic system which has been proven to be good for the trivalent erbium ion. Under external laser induced excitation, this system shows four upward transitions: one transition from the ground state and three transitions using excited state absorption (ESA). The method, which is developed in the present paper, is used to describe the experimentally observed spectra of up-conversion PL in Er3+ ions embedded in a gallium lanthanum sulphide-oxide glass.
II Experimental details
The Er3+ doped gallium lanthanum sulphide-oxide glass was prepared by melt quenching of raw materials mixed in the following proportions: 72.5% Ga2S3, 27% La2O3 and doped with 0.5% Er2O3. All percent are molar. Melting took place in a vitreous carbon crucible for 24 hours in dry flowing argon followed by annealing at 500∘C, ramping up and down at 1∘ per minute.
The PL was excited by laser diode operating at a wavelength of 808 nm which coincides with the 4I15/2 –4I9/2 absorption band of Er3+. Glass samples doped with Er3+ showed bright green emission well seen by naked eye under regular ambient daylight illumination. The transmittance and PL spectra in the 400-1700 nm range were measured using a 600 mm single-grating spectrometer equipped with Si and InGaAs CCDs. The spectra were taken at room temperature and corrected for the system response.
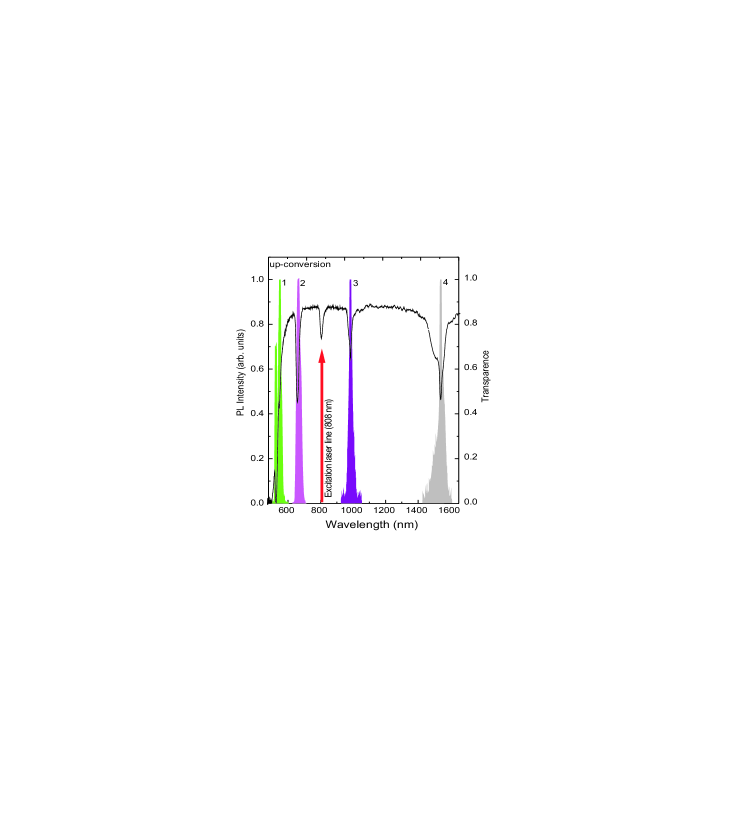
Figure 1 gives an overview of the experimental results. Under 808 nm excitation several PL bands with Stokes and anti-Stokes shifts have been observed. Two bands centered at 980 nm and 1535 nm have demonstrated ‘‘normal’’ Stokes shift and are easily assigned to 4I11/2 –4I15/2 and 4I13/2 –4I15/2 transitions, respectively. The bands with anti-Stokes shift show a ‘‘red’’ peak centered at around 664 nm due to, presumably, 4F9/2 –4I15/2 transition and a ‘‘green’’ band consisting of two peaks centered at 525 and 550 nm which may be related to 2H11/2 –4I15/2 and 4S3/2 –4I15/2 transitions, respectively.
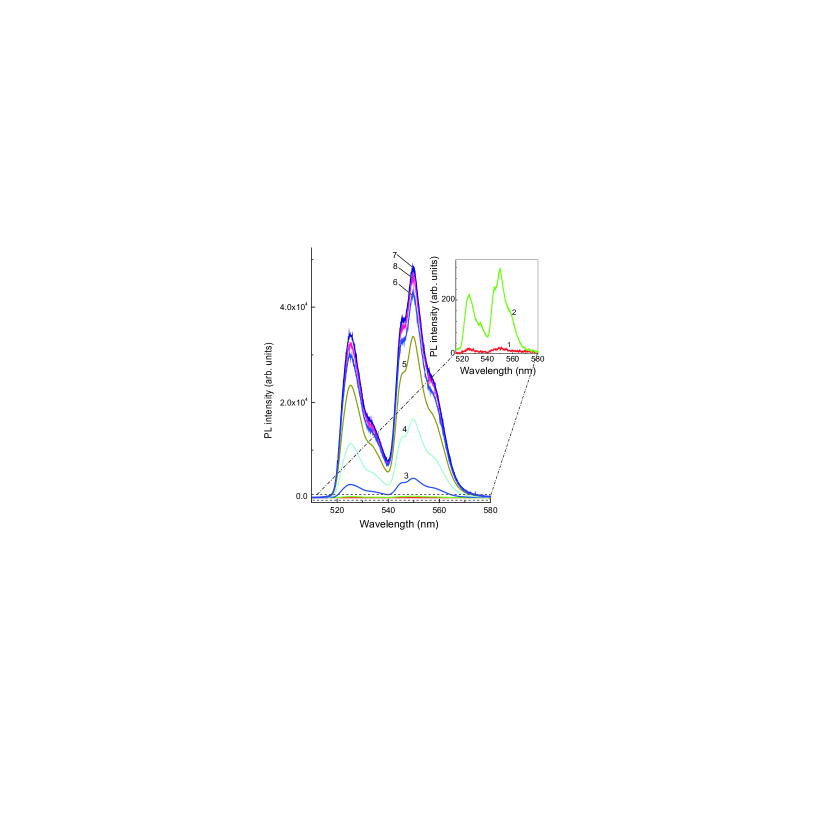
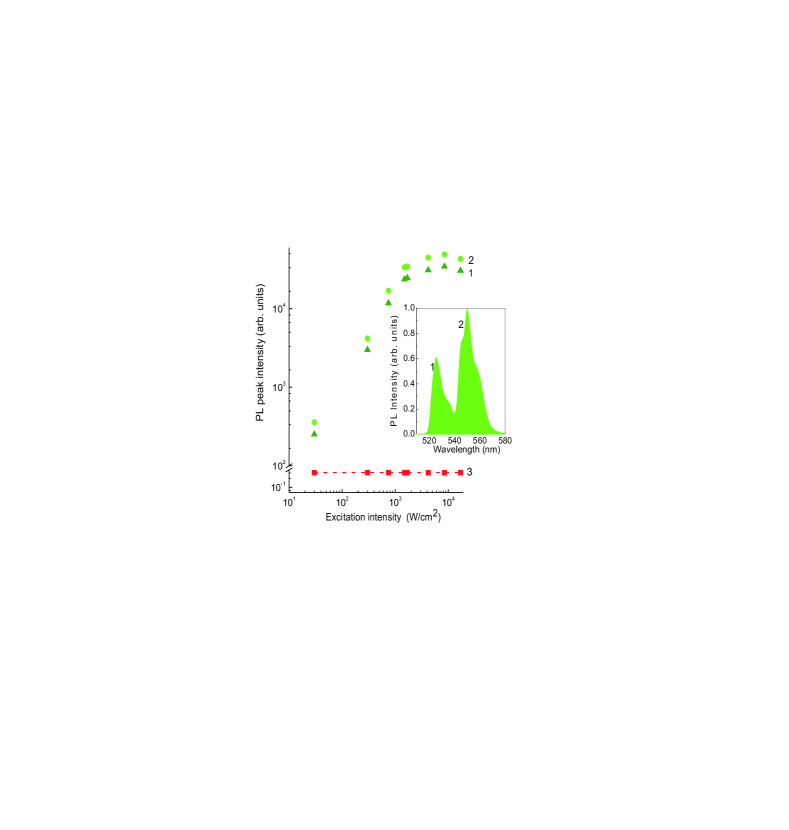
Figure 2 demonstrates the influence of excitation intensity () on the line shape and intensity of the ‘‘green’’ line. It is worth noting that the line shape remains virtually unchanged as well as the ratio of peak intensities of emission bands corresponding to 2H11/2 –4I15/2 and 4S3/2 –4I15/2 transitions as confirmed by Figure 3. Figure 3 also shows that the intensities of both above mentioned bands experience monotonous increase with the increase of excitation intensity up to 2000 W/cm2 followed by eventual saturation.
III Theoretical analysis and discussion
Figure 4 shows the schematic diagram of ten discreet level model used to explain experimental data. One of the key question of this approach (which is usually omitted) is the validity of presentation of involved Er3+ ion manifolds by discreet levels. This can be valid if ‘‘the time required to establish a thermal distribution within each manifold is short compared with the lifetime of this manifold’’ Miniscalco . The later assumption may be easily verified by testing the validity of the McCumber relation between emission () and absorption () cross-sections which is derived assuming a thermal equilibrium within the manifold
here is a temperature dependent excitation energy, is the photon energy McCumber . It is interesting to note that the above relation turns out to be valid not only for all separated manifolds involved in our model but it holds also for a group of manifolds of 4S3/2 and 2H11/2. Additionally, this approach is supported by the independence of line shape of ‘‘green’’ band from excitation intensity (Figure 2) and, hence, the stability of the ratio of peak intensities corresponding to 2H11/2 –4I15/2 and 4S3/2 –4I15/2 transitions as shown in Figure 3.
The pumping is considered to be to the manifold 4I9/2 corresponding to the 808 nm excitation used in experiments. Figure 4 shows the existence of three possible up-conversion transitions (based on the ESA mechanism) via excited states 4I13/2, 4I11/2 and 4I9/2. It shows also a set of radiative transitions part of which was observed experimentally as PL spectra (see Figure 1). Other long wavelengths transitions fall outside of the sensitivity range of our experimental installation while the transitions from 2H9/2, 4F3/2 and 4F5/2 are disguised or/and suppressed by strong matrix absorption. We could not observe the 4I9/2 –4I15/2 emission band, which strongly overlaps the excitation spectrum.

In general, finding the relation between the intensity of up-converted PL and excitation intensity starts with the creation of a system of rate equations describing the radiative and non-radiate transitions between various energy levels. The solution of this system gives the populations of all levels involved under consideration, which allows the calculation of the intensities of all spectral lines corresponding to optical transitions. Deeper analysis may involve the laborious decomposition of PL spectra into a set of Gaussians corresponding to transitions between individual Stark levels (similar to what was done in Koughia . Each of the above Gaussians is in fact an envelope of individual Lorentzians (in crystalline host material) or individual Gaussians (in non-crystalline host material). Even more detailed calculations should include induced transitions and modification of emission spectra due to absorption and spatial non-uniformity of specimen relative permittivity.
Schematic diagram of Er3+ ion manifolds Gruber and interlevel transitions used in the theoretical model. Diagram shows the optical transition from ground state (GSA), three up-conversion transitions using ESA as well as experimentally observed emission transitions. Term ‘‘strong absorption’’ shows the energy at which absorption coefficient of matrix glass exceeds at least two times the strongest absorption band of Er3+.
In the present paper, we limit the model by calculating the intensities of up-conversion PL bands as a function of excitation intensity (). We offer a theoretical description of experimental results by analyzing a set of radiative and non-radiative transitions within nine excited and one ground level simulating manifolds of Er3+ ion (Figure 4). The corresponding system of rate equations along with additional equation of conservation of total number of electrons may be presented in a matrix form as where the vectors and are defined as , . Matrix has dimensions , that allows us to solve the system of equations by using the Cramer rule. This approach potentially allows us to calculate the coefficients included in the expressions for optical transition intensities. However, in multilevel ionic systems, dozens or even hundreds of addends must be taken into account, with every addend being a product of several parameters such as generation and relaxation rates. This type of calculation is quite sensitive to uncertainties of above mentioned parameters and may lead to considerable discrepancies. Instead, general equations for level populations may be represented by ratios of polynomials (4th or 3rd orders), which may be simplified further by taking into account the small numbers of addends at zeroth and first degrees of generation rate. As a result, the general equation for radiative transition intensity J may be reduced to
| (1) |
where I is the pumping intensity and A, B, C, D, E and F are numerical coefficients. Moreover, for optical transitions involving lower three levels, the coefficient A is simply 0, while for higher levels with a high accuracy C is equal to 0. Figure 5 demonstrates the quality of this approximation for two up-conversion bands in GaLaS(O):Er glass. The appropriate adjustable parameters are summarized in the caption to Figure 5.
The advantage of this approach is that one may directly use Eq. (1) to fit the interpolation curve through well-established experimental points and to use optimized parameters for further predictions. Therefore, it seems reasonable to establish some general features of function which may be done by calculating and zeroing first and second derivatives, and by finding the number of possible solutions, which leads to
Mathematically, the function may be very ‘‘versatile’’: i) it may be monotonic, monotonically reaching saturation; ii) it may have only one maximum; iii) it may have two extrema (local minimum and (local) maximum). Besides, it may have up to three inflection points or have none.
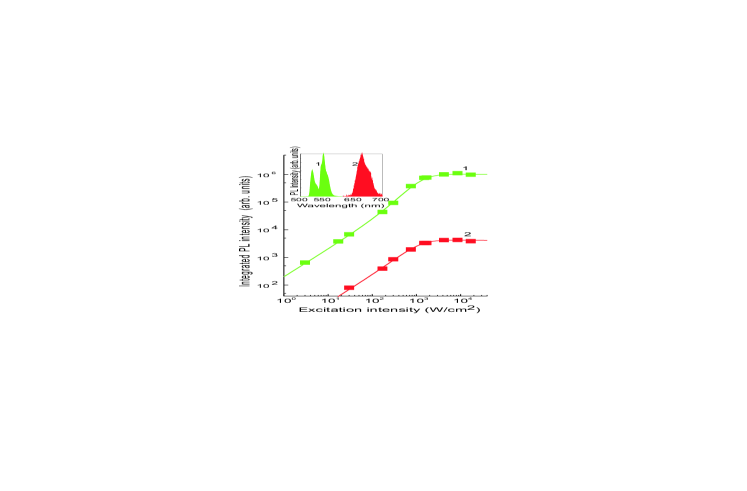
For transitions from upper levels (marked 4, 5,…9 in Figure 4) at ; for transitions from lower levels (marked 1, 2, 3 in Figure 4) at . Therefore, mathematically, there are several potentially possible scenarios while investigating PL in these multilevel ionic systems. Physically, non-monotonic behavior is connected with the existence of several up-conversion transitions involving ESA. Those may also explain saturation (assuming negligible induced emission) at exceeding 2000 W/cm2 which is observed experimentally (Figure 5).
IV Conclusion
Intensive green red up-conversion has been detected in Er3+ doped GaLaS(O) glass under laser diode excitation at 808 nm. The dependence of up-conversion intensity as a function of pumping intensity has been investigated. This dependence may be described by applying a phenomenological method developed in the present paper. The method uses analytical expressions derived from rate equations taking into account radiative and non-radiative interlevel transitions (including excited state absorption). The coefficients entering these analytical expressions are defined by interpolation through several well-established experimental points.
Acknowledgements.
Authors from Ioffe Institute thank the State assignment no. 0040-2019-0012 for financial support.References
- (1) R. Scheps, Upconversion laser processes, Prog. Quantum Electron., 20 271-358 (1996).
- (2) P. L. Kharel, F. P. Zamborini and B. W. Alphenaar, J. Electroch. Soc.,165, H52 (2018).
- (3) A. Ravagli, C. Craig, G. A. Alzaidy, P. Bastock and D. W. Hewak, Advanced Materials, 29, 1606329 (2017).
- (4) C. C. Ye, D. W. Hewak, M. Hempstead, B. N. Samson and D. N. Payne, J. Non. Cryst. Solids, 208, 56 (1996).
- (5) A. Tverjanovich, Y. G. Grigoriev, S. V. Degtyarev, A. V. Kurochkin, A. A. Man’shina, T. Yu. Ivanova, A. Povolotskiy, Yu. S. Tveryanovich, J. Non-Cryst. Solids, 326&327, 311 (2003).
- (6) J. E. Carroll, Rate equations in semiconductor electronics, (Cambridge University Press, Cambridge, 1985) p. 192.
- (7) W. J. Miniscalco, R. S. Quimby, Optics Letters, 16, 258 (1991).
- (8) D. E. McCumber, Phys. Rev., 134 A299 (1964).
- (9) C. Koughia, M. G. Brik, G. Soundararajan, S. Kasap, J. Non-Cryst. Solids, 377, 90 (2013).
- (10) J. B. Gruber, G. W. Burdick, S. Chandra, D. K. Sardar, J. of Appl. Phys., 108, 023109 (2010).