Modeling the spin-Peierls transition of spin- chains with correlated states: model, CuGeO3 and TTF-CuS4C4(CF3)4
Abstract
The spin-Peierls transition at of spin- chains with isotropic exchange interactions has previously been modeled as correlated for and mean field for . We use correlated states throughout in the model with antiferromagnetic exchange and between first and second neighbors, respectively, and variable frustration . The thermodynamic limit is reached at high by exact diagonalization of short chains and at low by density matrix renormalization group calculations of progressively longer chains. In contrast to mean field results, correlated states of 1D models with linear spin-phonon coupling and a harmonic adiabatic lattice provide an internally consistent description in which the parameter yields both the stiffness and the lattice dimerization . The relation between and , the gap induced by dimerization, depends strongly on and deviates from the BCS gap relation that holds in uncorrelated spin chains. Correlated states account quantitatively for the magnetic susceptibility of TTF-CuS4C4(CF3)4 crystals ( K, , K) and CuGeO3 crystals ( K, , K). The same parameters describe the specific heat anomaly of CuGeO3 and inelastic neutron scattering. Modeling the spin-Peierls transition with correlated states exploits the fact that limits the range of spin correlations at while limits the range at .
I Introduction
Jacobs et al. Jacobs et al. (1976) identified the spin-Peierls transition at K in the organic crystal TTF-CuS4C4(CF3)4. The spin- chain at has equally spaced cation radicals TTF+ and is dimerized at lower . They analyzed the magnetic susceptibility using the linear Heisenberg antiferromagnet with equal exchange to both neighbors for and alternating exchange in the dimerized phase. The dependence of followed the BCS gap equation of superconductors. Subsequently, Hase et al. Hase et al. (1993a); *haseprb1993 identified the inorganic spin-Peierls crystal CuGeO3 with K based on spin- chains of Cu(II) ions. The magnetic susceptibility at indicated Riera and Dobry (1995) exchange with between second neighbors in addition to . However, did not follow BCS and extensive CuGeO3 studies have been inconclusive Uchinokura (2002) with respect to frustration . These prototypical spin-Peierls (SP) crystals have been analyzed with correlated states for but only as uncorrelated or mean field for .
Spin- chains have been long studied theoretically as simple 1D systems with two states, and , per site. The linear Heisenberg antiferromagnet (HAF) is the limit of the model, Eq. 4 below. The HAF may well be the best characterized many-body system, and the model also has an extensive literature.
The electronic problem for SP transitions is to obtain the thermodynamic limit of the free energy per site at temperature and dimerization . In reduced () units, we have
| (1) |
The thermodynamic limit is known for free fermions but not for correlated systems such as the HAF or the model. SP modeling has consequently been approximate and subject to revision due to computational advances. In particular, we show below that for the HAF does follow BCS.
We model both transitions with a recent method that combines exact diagonalization (ED) of short chains with density matrix renormalization group (DMRG) calculations of progressively longer chains Saha et al. (2019). The premise is that the full spectrum of large systems is never needed. Since limits the range of spin correlations, ED is sufficient once the system size exceeds the correlation length. Bonner-Fisher results Bonner and Fisher (1964) to were used Jacobs et al. (1976) for of TTF+ chains at . ED to is now accessible. DMRG for larger yields the spectrum up to some cutoff , thereby extending thermodynamics to lower . The hybrid approach is particularly well suited for SP systems because dimerization opens a gap that limits spin correlations at .
The driving force for dimerization is the partial derivative that is opposed by the lattice. The simplest lattice model is used in conventional approaches Su et al. (1980); Beni and Pincus (1972); Del Freo et al. (2002) to the Peierls or SP instability: the coupling is linear, the potential energy per site is harmonic, and the stiffness is independent of . The equilibrium dimerization is
| (2) |
At , is the ground state energy per site. DMRG returns the derivative of large systems and the extrapolated limit . Dimerization decreases and vanishes at , where . In principle, the observed is the model parameter that specifies both the stiffness and . To emphasize the point, we refer to the equilibrium susceptibility as over the entire range. Moreover, the driving force is a property of the electronic system that is balanced by whatever model is adopted for the lattice.
The equilibrium dimerization is explicitly known for free fermions; for a half-filled tight-binding band is given by
| (3) | ||||
The stiffness is half as large for spinless fermions, which corresponds to the XY spin- chain. The band gap opens as and goes as in the weak coupling limit. The spinless fermion representation of the HAF has interactions between first neighbors. The HAF is correlated. Although not exact, the HAF gap opens Barnes et al. (1999) as based on diverse numerical studies collected in Ref. Johnston et al., 2000. The DMRG exponent in the range is Kumar et al. (2007) .
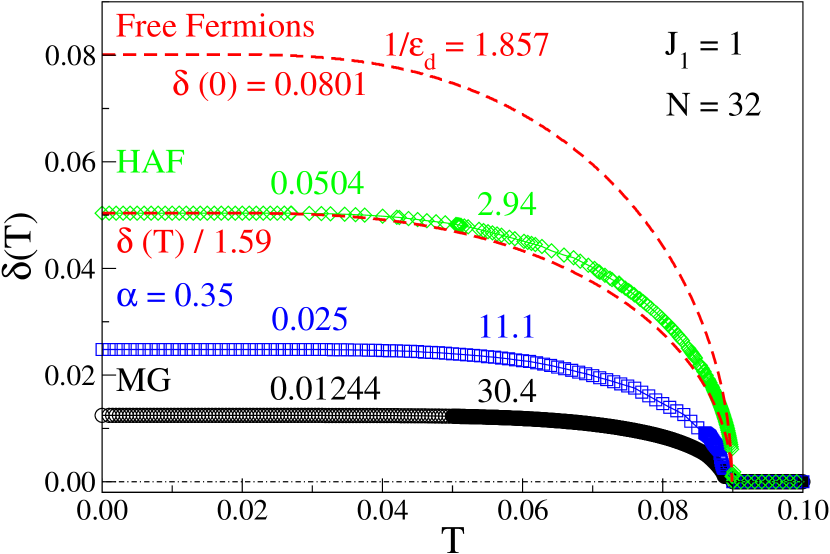
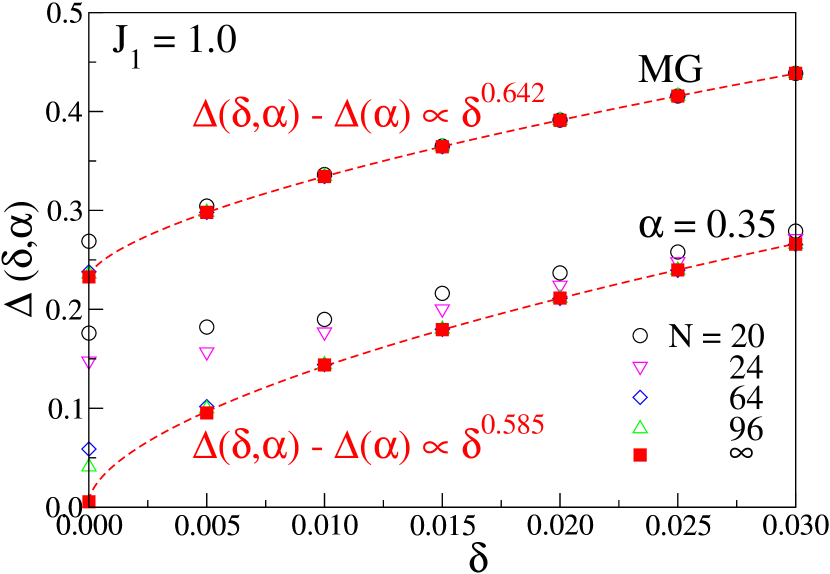
To illustrate correlations and frustration, we show in Fig. 1 the dimerization of spin chains with (or ). The fermion curve is Eq. 3 with instead of ; the band gap is within of the BCS gap relation. The other curves are for models with in Eq. 4, periodic boundary conditions and (HAF), and (MG). The fermion scaled by is the dashed line through the HAF points; the scaled dependence is nearly BCS. The stiffness increases by an order of magnitude from the HAF to MG while decreases by a factor of four and clearly deviates from free fermions.
We analyze SP transitions of the model with frustration . Under some conditions, numerical advances have made accessible the thermodynamic limit of correlated states of 1D systems. The influential but approximate HAF analysis Bray et al. (1983); Jacobs et al. (1976) of TTF-CuS4C4(CF3)4 was widely thought to apply to the larger data set made possible by sizeable CuGeO3 crystals. But CuGeO3 turned out to be different and has largely resisted modeling. Correlated states provide a consistent description of both SP transitions.
The paper is organized as follows. Section II presents the calculation of in models with frustration and the criterion for the thermodynamic limit. We model in Section III the magnetic susceptibility of TTF-CuS4C4(CF3)4 with two parameters, K and K. The CuGeO3 parameters K, and K account for both and the specific heat anomaly, . In Section IV we discuss the CuGeO3 excitations probed by inelastic neutron scattering, not modeled previously, that give an independent determination of . We also study the Majumdar-Ghosh (MG) point Majumdar and Ghosh (1969), , where the exact ground state is known. Aspects and limitations of 1D models are mentioned in the Discussion.
II Dimerized model
The model has isotropic exchange interactions , between first and second neighbors of a regular () spin- chain. The dimerized model has alternating along the chain. We consider finite chains with spins, periodic boundary conditions and as the unit of energy. The electronic Hamiltonian is
| (4) |
The HAF is the special case . The ground state of is nondegenerate for , the quantum critical point Okamoto and Nomura (1992) that separates a gapless phase from the gapped dimer phase with a doubly degenerate ground state. The exact ground state is known at , the MG point Majumdar and Ghosh (1969), that marks the onset of an incommensurate phase. Finite breaks inversion symmetry at sites and increases the singlet-triplet gap but does not change the length in systems with periodic boundary conditions. The analysis does not depend on the index which is suppressed below.
We consider the equilibrium Eq. 2 with increasing system size to obtain the thermodynamic limit at finite and then evaluate in models with . The free energy per spin of finite chains is
| (5) |
The Boltzmann sum in is over the spin states with energies . Exact diagonalization (ED) yields the full spectrum of short chains. The equilibrium dimerization requires the partial derivative that we approximate as
| (6) |
The numerator is accurate to three decimal places for . We find that the size dependence of is considerably weaker than that of , presumably due to cancellations in the numerator.
The hybrid ED/DMRG method Saha et al. (2019) follows the size dependence of the quantity of interest, here the driving force . Since reduces the range of spin correlations, ED up to for or for returns the thermodynamic limit at high . DMRG with periodic boundary conditions Dey et al. (2016) is then used to obtain the lowest few thousand states of larger systems. The spectrum up to a cutoff defines a truncated partition function and hence a truncated entropy per site, . Finite size gaps reduce compared to the actual entropy at low while truncation reduces it at high . Since converges from below with increasing , its maximum at is the best choice for a given cutoff . The cutoff is increased until is independent or almost independent of . The thermodynamic limit of at is approximated by DMRG at system size .
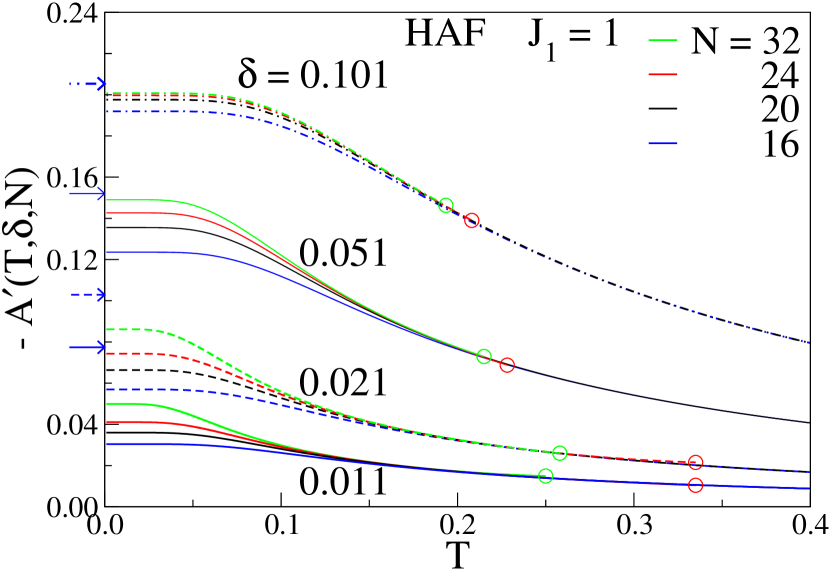
Fig. 2 illustrates the dependence of of the HAF. As expected for any , decreases with and increases to the thermodynamic limit. The and lines are exact. DMRG results for extend to the points , the maxima of that are shown as open circles. Finite size gaps are evident around where is constant. Arrows indicate the intercepts, , that are obtained by extrapolation of ground-state DMRG calculations Kumar et al. (2007) at constant . Since opens a magnetic gap in the infinite chain, the size dependence decreases as seen at . Convergence to the thermodynamic limit is found by , The general criterion based on is evidently conservative for , which is seen to converge at lower .
The size dependence of in the dimer phase is shown in Fig. 3 for and in Eq. 4. The MG ground states are the two Kekulé VB diagrams with singlet pairing either between all sites , or all sites , . The energy per site is for even in Eq. 4 and is exact Saha et al. to order . The thermodynamic limit is reached by for . The size dependence at is intermediate. The ground state is degenerate in the thermodynamic limit but not for finite . The intercept decreases with to in the thermodynamic limit, where is the amplitude of the bond order wave Kumar et al. (2010). The size dependence again decreases with .
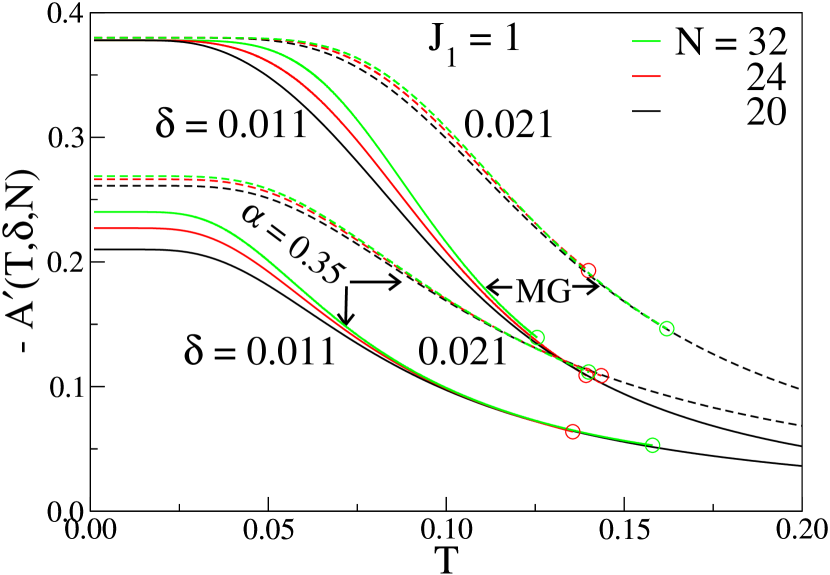
Fig. 2 and Fig. 3 indicate how approaches the thermodynamic limit. The convergence depends on the model and the largest system ,
| (7) |
is the maximum of of the largest system considered. We have performed DMRG calculations up to , but smaller may be sufficient and convergence at typically also holds for . The system size is eventually limited Saha et al. (2019) by the numerical accuracy of the dense energy spectrum, which is of course model dependent. Although the mathematically interesting at is out of reach, modeling SP transitions merely requires . The equilibrium Eq. 2 then gives in the thermodynamic limit.
Fig. 4 shows vs. for models with and (HAF) or (MG). These curves lower and upper bounds of for models with . The intercept at decreases from at to zero at where Cross and Fisher (1979); Kumar et al. (2007) . The HAF result Kumar et al. (2007) is . The graphical solutions of Eq. 2 are the intersections in Fig. 4 of with dashed lines at the indicated stiffness. The chains are unconditionally unstable for finite since is finite at for while diverges at for . The cusp at in the dimer phase leads to the flatter two curves Saha et al. in Fig. 1.
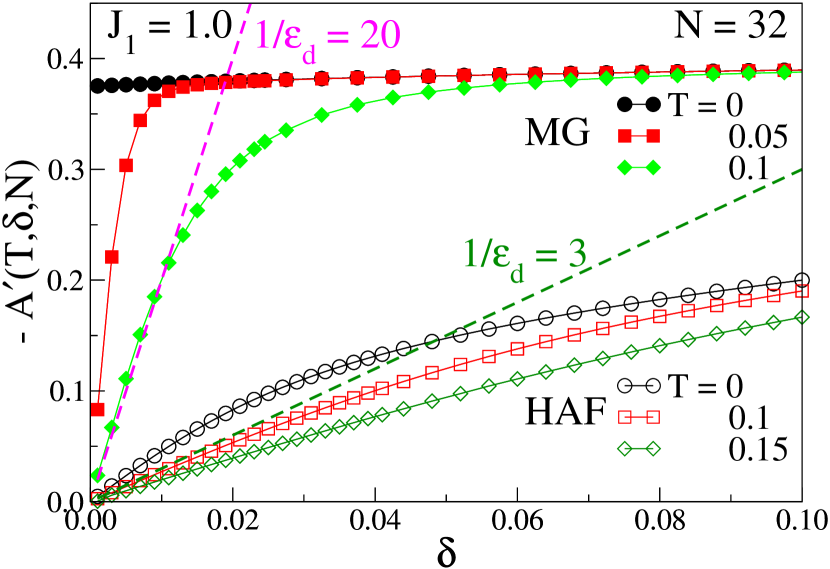
We conclude that the thermodynamic limit can be reached in finite chains at when or at when . The range is more accessible numerically for large that in turn generates large . The relation between and is strongly model dependent as seen in Fig.1.
III Magnetic susceptibility and specific heat
A sudden decrease of the molar magnetic susceptibility at is a direct manifestation of an SP transition. Fig. 5 shows published data for Jacobs et al. (1976) TTF-CuS4C4(CF3)4 and Fabricius et al. (1998); Hase et al. (1993a) CuGeO3 on a log scale that emphasizes low . The excellent TTF+ fit shown in Fig. 5 of Ref. Jacobs et al., 1976 or Fig. 10 of Ref. Bray et al., 1983 is based on the HAF with K and for K. The value is within the range given by electron spin resonance (esr) with the applied magnetic field along the axis. The limit is shown as slightly positive ( emu/mol).
We included this -independent contribution in the correlated fit shown with K, K and . The curve above is ED for and DMRG for with in Eq. 4. In the dimerized phase, we calculated for at the equilibrium given by Eq. 2. The correlated fit is equally quantitative. It has one fewer parameter and is internally consistent: and determine both the stiffness and . The previous was based Jacobs et al. (1976) on a mean field for the dependence and required an adjustable that, as noted, Jacobs et al. (1976) leads to rather than K.
The range of spin correlations is reduced at low by substantial dimerization . The thermodynamic limit is reached in relatively short chains that are now amenable to quantitative analysis. Correlated states clarify the SP transition of TTF-CuS4C4(CF3)4. Contrary to long held expectations, the HAF dimerization does not follow free fermions or BCS.
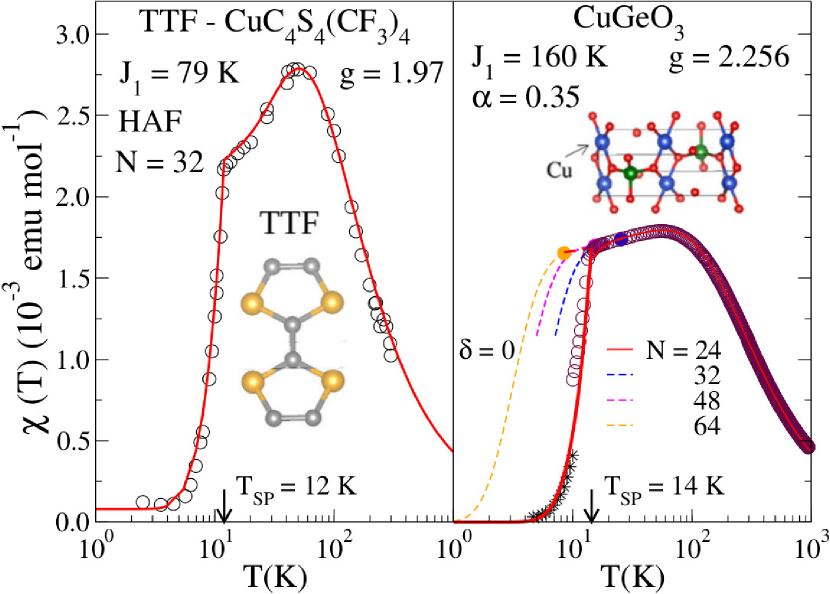
The data for CuGeO3 are from Ref. Hase et al., 1993a; *haseprb1993 up to K ( K) and from Ref. Fabricius et al., 1998 from to K ( K), kindly provided in digital form by Professor Lorenz. There is a mismatch at K. The range ( K) of reported reflect variations of growth conditions that are discussed in Ref. Hidaka et al., 1997. We retained the previous parameters Fabricius et al. (1998) based on ED for and the maximum at K: K, frustration in Eq. 4, from esr. The fit is quantitative for K (). The points on the curve are the maxima of truncated calculations at system size . The resulting for is consistent with the available data and corresponds to . We extend Fabricius et al. (1998) or improve Castilla et al. (1995); Bouzerar et al. (1999) previous fits.
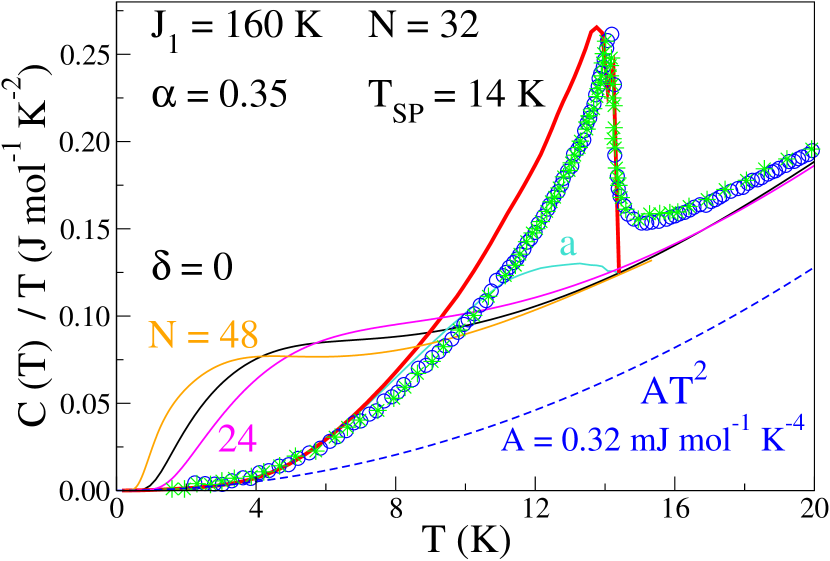
Sizeable single crystals of CuGeO3 made possible other measurements. The specific heat to K is shown in Fig. 6 as the entropy derivative in Refs. Lorenz et al., 1996; Liu et al., 1995. The dashed line is the reported lattice (Debye) contribution Liu et al. (1995), , with mJ/mol K4. The specific heat has not been modeled aside from the initial exponential increase with . The anomaly is sharper and better resolved than in small TTF-CuS4C4(CF3)4 crystals Wei et al. (1977).
The equilibrium has two contributions Saha et al. below ,
| (8) | ||||
is the internal energy per site, with . The first term is evaluated at along the equilibrium line in Fig. 1, which can be fit quantitatively as
| (9) |
with and . We used Eq. 9 to evaluate . The calculated is the bold red line shown in Fig. 6. The low- behavior of chains is a finite size effect. Since gaps initially decrease , entropy conservation requires increased before converging from above to the thermodynamic limit. The and gaps are smaller and larger, respectively, than , which is in the thermodynamic limit for K.
The part of Eq. 8 is the curve labeled (a) in Fig. 6. The derivative is mainly responsible for the sharp anomaly. The area under up to is within of the accurately known area. The adiabatic and mean field approximations for the lattice enforce for ; this general problem for any transition has long been recognized. The agreement between theory and experiment by K implies equal area under the measured, dimerized and curves in Fig. 6. Lattice fluctuations observed above must be offset by reduced below . Overall, the anomaly is fit rather well considering these approximations.
IV Inelastic neutron scattering
Dimerization opens a gap in gapless spin chains or increases the gap in gapped chains. The gap is from the singlet () ground state to the lowest energy triplet (). The opening of the HAF gap Barnes et al. (1999); Johnston et al. (2000) or of at the critical point Cross and Fisher (1979); Kumar et al. (2007) has been extensively discussed using field theory and numerical methods; is finite in the dimer phase, exponentially small just above and substantial at . We obtained the thermodynamic limit of gaps in Fig. 7 by extrapolation of DMRG calculations up to . As expected, size convergence is rapid for . The gap opens as
| (10) |
with , and for . The dependence is given by . The large MG gap is .
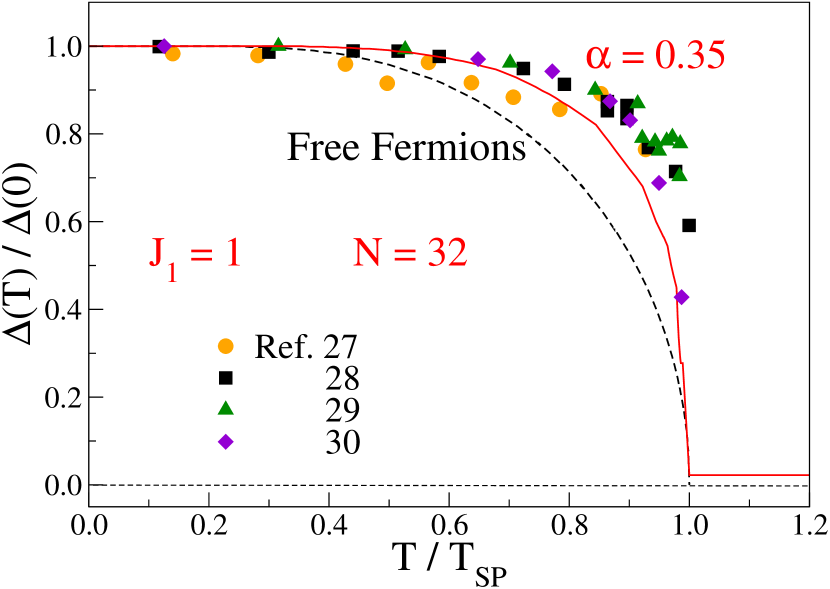
Inelastic neutron scattering (INS) at is exclusively to triplets in models with isotropic exchange. Fig. 8 shows the scaled gap vs. . The solid line is the calculated in Eq. 10 with in Eq. 9 or the curve in Fig. 1. The gap K is almost an order of magnitude below INS resolution and scales to for and . The dashed line is the gap ratio for free fermions in Fig. 1. INS studies of CuGeO3 crystals in Refs. Nishi et al. (1994); Lussier et al. (1996); Martin et al. (1996); Regnault et al. (1996) have reported the dependence of the singlet-triplet gap . (The organic crystals are unsuitably small Regnault et al. (1996).) Large deviations from the free fermions or BCS were unexpected and unexplained. Correlated states are consistent with these data, and how quantitatively remains to be seen.
The calculation of the INS spectrum is straightforward in finite systems with periodic boundary conditions. Triplets at relative to the singlet ground state are required. At , the INS intensity for energy transfer and momentum transfer is Müller et al. (1981)
| (11) | ||||
The or components of also yield . The lowest triplet of is The INS intensity at finite is the thermal average Müller et al. (1981) of Eq. 11 over excited states as well as . The static structure factor at is given by ground-state spin correlation functions
| (12) |
The total INS intensity per spin is for chains with a singlet ground state. The thermal average of in Eq. 12 is far less tedious since it only requires the dependence of correlation functions.
The Bethe ansatz Bethe (1931); *hulthen38 has provided the exact ground state of the HAF and the so-called Class states with that can be solved exactly. Faddeev and Takhtajan Faddeev and Takhtajan (1981) obtained the double spinon continuum in the thermodynamic limits. The lower and upper boundaries at wave vector are
| (13) | ||||
Each state is four-fold degenerate, two spinons forming a triplet or a singlet. The boundaries up to are the dashed lines in the HAF panel of Fig. 9. The spectrum is symmetric about . The singlet-triplet gap was found earlier by des Cloizeaux and Pearson des Cloizeaux and Pearson (1962).
The almost quantitative calculation of intensities in the thermodynamic limit has recently been achieved Karbach et al. (1997). Mourigal et al. Mourigal et al. (2013) have confirmed theory in detail on a Cu(II) spin chain with K; the INS analysis in Fig. 1d of Ref. Mourigal et al., 2013 was carried out at finite using both two and four-spinon calculations. is continuous in the thermodynamic limit. Fig. 1d is color coded according to intensity and impressive agreement between theory and experiment is shown, as in Fig. 9, side by side with and .
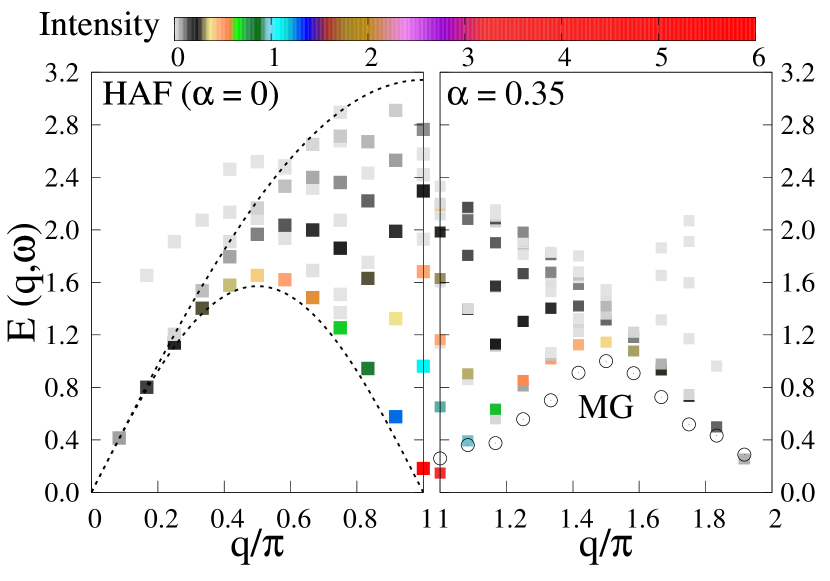
When total spin is conserved, a system of spins has triplets out of which only are in Class Bethe (1931); *hulthen38 and have excitation energy between and in the thermodynamic limit. The spectra in the HAF panel of Fig. 9 are and . The color coding is according to the intensity . There are a few triplets not in Class , but of the total intensity is between the dashed lines. The discrete spectra are close to the thermodynamic limit for both excitations and intensities.
The spectra in the panel of Fig. 9 are for , and color coded according to . ED returns the full spectrum. The special feature of the triplets shown is greater intensity than over other triplets. The triplets account for of the total intensity and, again with a few outliers, resemble the spinons in the left panel.
Frustration decreases the dispersion of the lowest triplet, as shown by open circles in the MG () curve. The HAF triplets are slightly above , which at is entirely due to finite size. The , gap is mainly due to finite size while the gap is close the thermodynamic limit of in Fig. 7. The HAF dispersion has previously been used to infer from the measured .
Arai et al. Arai et al. (1996) reported the spectrum of CuGeO3 and interpreted it using the HAF while also pointing out differences. At K, the observed intensity peaks at and are at meV ( K). The peaks for , in Fig. 9 are at reduced energy , or K for K. The agreement is well within the combined accuracy. The , and gaps extrapolated as return in the thermodynamic limit. The weak size dependence is typical of large gaps. The upper limit of the INS spectrum extends Arai et al. (1996) to meV at at both and K. The calculated spectrum with appreciable also extends to .
The calculations in Fig. 9 approximate the unknown at in the same sense that approximates the HAF spectrum. at or of CuGeO3 has a noticeably narrower Arai et al. (1996) energy spread than the spinon spread . The correlated states in Fig. 9 capture this narrowing at compared to . Indeed, the width is entirely suppressed at where INS at or is a -function at . This exact result for a triplet, not reported previously, is derived in the Appendix.
The INS data in Fig. 10, upper panel, for the static structure factor of CuGeO3 is rescaled Fig. 2 of Ref. Arai et al., 1996. Large differences from HAF were noted Arai et al. (1996). The dashed line is the exact at , , where finite size simply leads to discrete . Although depends on and the area under does not. The K data are almost as broad as the MG curve before considering the resolution in .
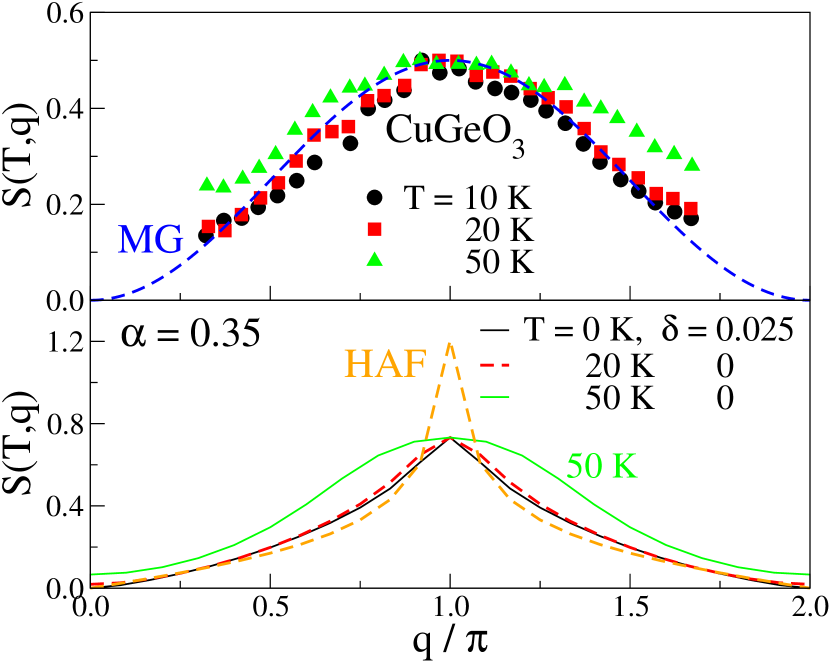
The calculated in the lower panel of Fig. 10 are for the HAF and for CuGeO3 parameters: K, and K. The HAF structure factor for , is strongly peaked at and diverges in the thermodynamic limit, but the size dependence elsewhere is small since the area is conserved Kumar et al. (2015). The curves at and K () are for and and , respectively. We obtained explicitly the dependence of the spin correlation functions in . The and K curves illustrate similar spin correlations at , and , , as seen in experiment. Convolution with a broadening function in will be needed to match the observed peaks that depend on resolution in . The K () line is based on , since the thermodynamic limit is reached at lower . We understand the modest broadening at K by noting that K is large. We conclude that a 1D model with correlated states accounts reasonably well for these INS data.
V Discussion
Structural changes at Peierls or SP transitions as well as thermal expansion or contraction have been probed by elastic X-ray or neutron scattering, as discussed in reviews of widely different classes of quasi-1D crystals Jérome (2004); Pouget et al. (2017); Painelli and Girlando (2017). We note that 3D changes are always found that in some cases exceed those of the 1D chain. While delicate growth conditions leave open the definitive CuGeO3 structure, the largest change below is along the axis rather than the dimerization of the chain along the axis Harris et al. (1994). Small displacement of Cu ions along is consistent with the small calculated in the correlated model; they are related by the linear spin-phonon coupling constant. Elastic scattering below from superlattice points is due to structural changes, not just dimerization, that are all initiated at but do not necessarily vary identically with . Elastic superlattice scattering and coupling to 3D lattices are beyond the scope of this paper.
We have applied the hybrid ED/DMRG method to the best characterized SP transitions and to the model, Eq. 4, with frustration and isotropic exchange , between first and second neighbors. We exploit the fact that limits the range of spin correlations at while finite limits the range at . Internal consistency requires to govern both the stiffness and dimerization . The relevant system size depends on , about spins for the transitions modeled. When the thermodynamic limit can be reached, the SP transition becomes essentially model exact. On the other hand, the SP instability at is mathematically motivated and beyond the hybrid method. The general problem is the SP transition at arbitrary while we have modeled specific systems with known .
Correlated states account quantitatively for the magnetic susceptibility of both crystals. On the theoretical side, of that HAF deviates from free fermions or BCS, contrary to previous expectations based on mean field. We place CuGeO3 in the dimer phase with on the basis of , the specific heat, the ratio of the singlet-triplet gap and INS data that provide an independent determination of K. The first inorganic SP system is also, to the best of our knowledge, the first physical realization of the dimer phase of the model.
Isotropic exchange between near neighbors is the dominant magnetic interaction that governs the thermodynamics of spin chains. However, such 1D models are approximate and incomplete. Approximate because spin-orbit coupling generates corrections to isotropic exchange and factors that are more important in Cu(II) systems than for organic radicals. Incomplete because dipolar interaction between spins are neglected, as well as hyperfine interactions with nuclear spins and all interchain interactions. More detailed analysis of specific quasi-1D systems beyond, for example, the model will certainly be needed at low . Neutron Nishi et al. (1994); Lussier et al. (1996); Martin et al. (1996); Regnault et al. (1996) and esr Honda et al. (1996) data indicate between chains and corrections to isotropic exchange, respectively, in CuGeO3. The present results establish that the model is the proper starting point for finer low- modeling.
A static magnetic field can readily be added to Eq. 4 as where is the total spin component along and is the Bohr magneton. Since total is conserved, the energy spectrum of correlated states has resolved Zeeman energies when , and the tensor may often be taken as a scalar. Multiple studies of the SP transition of CuGeO3 in applied fields a few Tesla have been reviewed Uchinokura (2002). The field dependence has been successfully modeled. We anticipate at most minor changes on analyzing magnetic field effects using correlated states.
We are computing correlation functions of spin- chains as functions of and and separation between spins. One goal is to quantify , the dependence of the static structure factor, Eq. 12, in models with increasing frustration . A limitation of the hybrid method became apparent in connection with . While ED is computed in sectors with fixed and , DMRG is performed in sectors with fixed up to a cutoff . We can infer and , but the states below the cutoff cluster around is Fig. 9. The spectrum around that starts at is soon above with increasing system size.
In summary, we have modeled the SP transition of the HAF and model with in Eq. 4 using correlated states. The thermodynamic limit of finite chains is reached under conditions that are satisfied by of TTF-CuS4C4(CF3)4 and CuGeO3. The SP transition depends strongly on frustration because the phase is gapless with a nondegenerate ground state while is gapped with a doubly degenerate ground state.
Acknowledgements.
We thank T. Lorenz for providing us the data. ZGS thanks D. Huse for several clarifying discussions. SKS thanks DST-INSPIRE for financial support. MK thanks DST India for financial support through a Ramanujan fellowship.*
Appendix A
Choose the Kekulé diagram with singlet pairs at sites as the ground state at the MG point. The model reads
| (14) | ||||
describes isolated dimers , with singlet-triplet gap . The second term acts on adjacent singlets pairs in . Direct multiplication of spin functions shows that each term annihilates ; is exact.
Let be the product function with a triplet at sites and singlets at sites . The triplet degeneracy under is . The second term still annihilates when acting on adjacent singlets, but not when acting on the triplet and either adjacent singlet. Annihilation requires an out-of-phase linear combination of triplets that occurs at or ,
| (15) |
The normalized triplet is an exact excited state in the thermodynamic limit. In Eq. 11, we find that . All INS intensity at or is at . The other Kekulé diagram with singlet pairs gives the same result.
References
- Jacobs et al. (1976) I. S. Jacobs, J. W. Bray, H. R. Hart, L. V. Interrante, J. S. Kasper, G. D. Watkins, D. E. Prober, and J. C. Bonner, Phys. Rev. B 14, 3036 (1976).
- Hase et al. (1993a) M. Hase, I. Terasaki, and K. Uchinokura, Phys. Rev. Lett. 70, 3651 (1993a).
- Hase et al. (1993b) M. Hase, I. Terasaki, K. Uchinokura, M. Tokunaga, N. Miura, and H. Obara, Phys. Rev. B 48, 9616 (1993b).
- Riera and Dobry (1995) J. Riera and A. Dobry, Phys. Rev. B 51, 16098 (1995).
- Uchinokura (2002) K. Uchinokura, J. Phys.: Condens. Matter 14, R195 (2002).
- Saha et al. (2019) S. K. Saha, D. Dey, M. Kumar, and Z. G. Soos, Phys. Rev. B 99, 195144 (2019).
- Bonner and Fisher (1964) J. C. Bonner and M. E. Fisher, Phys. Rev. 135, A640 (1964).
- Su et al. (1980) W. P. Su, J. R. Schrieffer, and A. J. Heeger, Phys. Rev. B 22, 2099 (1980).
- Beni and Pincus (1972) G. Beni and P. Pincus, J. Chem. Phys. 57, 3531 (1972).
- Del Freo et al. (2002) L. Del Freo, A. Painelli, and Z. G. Soos, Phys. Rev. Lett. 89, 027402 (2002).
- Barnes et al. (1999) T. Barnes, J. Riera, and D. A. Tennant, Phys. Rev. B 59, 11384 (1999).
- Johnston et al. (2000) D. C. Johnston, R. K. Kremer, M. Troyer, X. Wang, A. Klümper, S. L. Bud’ko, A. F. Panchula, and P. C. Canfield, Phys. Rev. B 61, 9558 (2000).
- Kumar et al. (2007) M. Kumar, S. Ramasesha, D. Sen, and Z. G. Soos, Phys. Rev. B 75, 052404 (2007).
- Bray et al. (1983) J. W. Bray, L. V. Interrante, I. S. Jacobs, and J. C. Bonner, “The spin-peierls transition,” in Extended Linear Chain Compounds, Vol. 3, edited by J. S. Miller (Plenum Press, New York, 1983) pp. 353–416.
- Majumdar and Ghosh (1969) C. K. Majumdar and D. K. Ghosh, J. Math. Phys. 10, 1399 (1969).
- Okamoto and Nomura (1992) K. Okamoto and K. Nomura, Phys. Lett. A 169, 433 (1992).
- Dey et al. (2016) D. Dey, D. Maiti, and M. Kumar, Papers in Physics 8 (2016), 10.4279/pip.080006.
- (18) S. K. Saha, M. Kumar, and Z. G. Soos, arXiv:1907.03724 [cond-mat.str-el] .
- Kumar et al. (2010) M. Kumar, S. Ramasesha, and Z. G. Soos, Phys. Rev. B 81, 054413 (2010).
- Cross and Fisher (1979) M. C. Cross and D. S. Fisher, Phys. Rev. B 19, 402 (1979).
- Fabricius et al. (1998) K. Fabricius, A. Klümper, U. Löw, B. Büchner, T. Lorenz, G. Dhalenne, and A. Revcolevschi, Phys. Rev. B 57, 1102 (1998).
- Hidaka et al. (1997) M. Hidaka, M. Hatae, I. Yamada, M. Nishi, and J. Akimitsu, J. Phys.: Condens. Matter 9, 809 (1997).
- Castilla et al. (1995) G. Castilla, S. Chakravarty, and V. J. Emery, Phys. Rev. Lett. 75, 1823 (1995).
- Bouzerar et al. (1999) G. Bouzerar, O. Legeza, and T. Ziman, Phys. Rev. B 60, 15278 (1999).
- Lorenz et al. (1996) T. Lorenz, U. Ammerahl, R. Ziemes, B. Büchner, A. Revcolevschi, and G. Dhalenne, Phys. Rev. B 54, R15610 (1996).
- Liu et al. (1995) X. Liu, J. Wosnitza, H. Löhneysen, and R. Kremer, Z. Phys. B 98, 163 (1995).
- Wei et al. (1977) T. Wei, A. J. Heeger, M. B. Salamon, and G. E. Delker, Solid State Commun. 21, 595 (1977).
- Nishi et al. (1994) M. Nishi, O. Fujita, and J. Akimitsu, Phys. Rev. B 50, 6508 (1994).
- Lussier et al. (1996) J.-G. Lussier, S. M. Coad, D. F. McMorrow, and D. M. Paul, J. Phys.: Condens. Matter 8, L59 (1996).
- Martin et al. (1996) M. C. Martin, G. Shirane, Y. Fujii, M. Nishi, O. Fujita, J. Akimitsu, M. Hase, and K. Uchinokura, Phys. Rev. B 53, R14713 (1996).
- Regnault et al. (1996) L. P. Regnault, M. Aïn, B. Hennion, G. Dhalenne, and A. Revcolevschi, Phys. Rev. B 53, 5579 (1996).
- Müller et al. (1981) G. Müller, H. Thomas, H. Beck, and J. C. Bonner, Phys. Rev. B 24, 1429 (1981).
- Bethe (1931) H. Bethe, Z. Phys. 71, 205 (1931).
- Hulthén (1938) L. Hulthén, Ark. Mat. Astron. Fys. 26, 106 (1938).
- Faddeev and Takhtajan (1981) L. Faddeev and L. Takhtajan, Physics Letters A 85, 375 (1981).
- des Cloizeaux and Pearson (1962) J. des Cloizeaux and J. J. Pearson, Phys. Rev. 128, 2131 (1962).
- Karbach et al. (1997) M. Karbach, G. Müller, A. H. Bougourzi, A. Fledderjohann, and K.-H. Mütter, Phys. Rev. B 55, 12510 (1997).
- Mourigal et al. (2013) M. Mourigal, M. Enderle, A. Klöpperpieper, J.-S. Caux, A. Stunault, and H. M. Rønnow, Nature Physics 9, 435 (2013).
- Arai et al. (1996) M. Arai, M. Fujita, M. Motokawa, J. Akimitsu, and S. M. Bennington, Phys. Rev. Lett. 77, 3649 (1996).
- Kumar et al. (2015) M. Kumar, A. Parvej, and Z. G. Soos, Journal of Physics: Condensed Matter 27, 316001 (2015).
- Jérome (2004) D. Jérome, Chem. Rev. 104, 5565 (2004).
- Pouget et al. (2017) J.-P. Pouget, P. Foury-Leylekian, and M. Almeida, Magnetochemistry 3 (2017).
- Painelli and Girlando (2017) A. Painelli and A. Girlando, eds., The Neutral-Ionic Phase Transition (Crystals 7, 2017).
- Harris et al. (1994) Q. J. Harris, Q. Feng, R. J. Birgeneau, K. Hirota, K. Kakurai, J. E. Lorenzo, G. Shirane, M. Hase, K. Uchinokura, H. Kojima, I. Tanaka, and Y. Shibuya, Phys. Rev. B 50, 12606 (1994).
- Honda et al. (1996) M. Honda, T. Shibata, K. Kindo, S. Sugai, T. Takeuchi, and H. Hori, J. Phys. Soc. Jpn. 65, 691 (1996).