pnasresearcharticle \leadauthorMacKay \significancestatementIn many domains of science, one is faced with a directed network and wishes to determine to what extent the edges line up in an overall direction. The old concept of “trophic level” from ecology, and its more recent analogue “upstreamness” in economics, provided an answer but required basal or top nodes, respectively. We introduce a new notion of trophic level and trophic coherence, which does not require basal or top nodes, is as easy to compute as the old notion, and is connected in the same way with network properties such as normality, cycles and spectral radius. We expect this to be a valuable tool in domains from ecology and biochemistry to economics, social science and humanities. \authorcontributionsRSM obtained the grant for the project, came up with the improved notions of trophic level and incoherence and proved most of the results about them. SJ did tests on a variety of networks, the comparisons of the new notion of trophic incoherence with other quantifiers of network structure, the ensemble theory for them, and some of the other proofs. BS built the Matlab toolbox, and did many of the empirical tests reported here, including all those on supply networks and input-output networks. Each of us wrote parts of the text and contributed to its finalisation. \authordeclarationThe authors have no competing interests. \correspondingauthor1To whom correspondence should be addressed. E-mail: R.S.MacKay@warwick.ac.uk
How directed is a directed network?
Abstract
The trophic levels of nodes in directed networks can reveal their functional properties. Moreover, the trophic coherence of a network, defined in terms of trophic levels, is related to properties such as cycle structure, stability and percolation. The standard definition of trophic levels, however, borrowed from ecology, suffers from drawbacks such as requiring source nodes, which limit its applicability. Here we propose a simple new definition of trophic level that can be computed on any directed network. We demonstrate how the method can identify node function in examples including ecosystems, supply chain networks, gene expression, and global language networks. We also explore how trophic levels and coherence relate to other topological properties, such as non-normality and cycle structure, and show that our method reveals the extent to which the edges in a directed network are aligned in a global direction.
keywords:
Directed network Trophic level Trophic coherenceThis manuscript was compiled on
Many complex systems have an underlying network, whose nodes represent units of the system and whose edges indicate connections between the units (29). In some contexts the connections are symmetric, but in many they are directed, for example indicating flows from one unit to another or which units affect which other units (6).
In a directed network the ecological concept of “trophic level” (24) allows one to assign a height to each node in such a way that on average the height goes up by one along each edge. The trophic levels can help to associate function to nodes, for example, plant, herbivore, carnivore in a food web. The concept was reinvented in economics (2), where it is called “upstreamness”.
The standard deviation of the distribution of height differences along edges gives a measure of the extent to which the directed edges line up, called the trophic incoherence (16). The trophic incoherence is an indicator of network structure that has been related to stability, percolation, cycles, normality and various other system properties (18, 15, 20, 12, 21).
The standard definitions of trophic level and incoherence are limited in various ways, however. In particular, they require the network to have basal nodes (source nodes), they give too much emphasis to basal nodes if there is more than one, they are not symmetric with respect to reversing all the edges, they do not give a stable way to determine levels and incoherence for a piece of a network, and they do not give a natural notion of maximal incoherence.
In this paper we present improved definitions of trophic level and incoherence that overcome these limitations. We illustrate their application in a variety of domains. We show that the new levels continue to be a useful indicator of function in the network and that the new incoherence measure continues to be related to stability, cycles and normality. We compare the new notion with the old for cases that have basal nodes. And we show the robustness of our new trophic levels to truncation of a network.
1 The new notions of trophic level and incoherence
We consider directed networks (also known as directed graphs or digraphs) with set of nodes (also known as vertices) and set of directed edges (also known as links). We suppose that there is at most one edge from a node to a node , and denote the edge by . There can also be an edge from to . Each edge carries a weight . This can represent the strength of the edge. We write if there is no edge from to and we assemble the into a matrix . The edge weights could be set to , as is common in the literature, and the array is then called the adjacency matrix of the network, but the ability to represent the strength of the edge is a useful extension. If there were multiple edges from to then we would amalgamate them into a single edge by adding the weights. Self-edges (also called loops) are permitted.
For each node we define its in-weight and out-weight by
| (1) |
We define the weight of the node by
| (2) |
and the imbalance for node by
| (3) |
The (weighted) graph-Laplacian operator on functions is defined by
| (4) |
or in matrix form (where T denotes transpose),
| (5) |
Then our improved notion of trophic level is the solution of the linear system of equations
| (6) |
The equations [6] always have a solution (see the Supporting Information (SI)) but it is non-unique, because one can add an arbitrary constant in each connected component of the network. A connected component of a network is a maximal subset such that it is possible to get from any to any by a path of edges ignoring their directions. Thus to solve one can replace the equation for one node in each connected component by an equation for arbitrary constants , for example . Then there is a unique solution for , which can be found by any linear algebra package. Afterwards one can add an arbitrary constant to the levels in each component if desired, for example to make the lowest one be or to make the average level (with respect to the weights , for example) in be .
Our improved notion of trophic incoherence is
| (7) |
This has the nice features that if and only if all the level differences are , if and only if all the level differences are , and otherwise is strictly between and (see SI for a proof). We say a network is maximally coherent if it has , maximally incoherent if it has . We define the trophic coherence to be . In the SI we prove the trophic coherence can be expressed alternatively as the weighted mean difference in trophic levels between nodes along the edges of the network.
The motivation for our new definitions is to seek levels that minimise the trophic confusion
| (8) |
where the target level difference for each edge is set to . A vector of levels minimises if and only if (see SI). The resulting minimum value of is .
2 Illustrations
To illustrate the new notions of trophic level and incoherence, we begin with the classic context of food webs. Here the nodes are species and there is an edge from a species to each species that eats it. Figure 1 shows the Ythan estuary food web (10) with height in the layout corresponding to our new notion of trophic level.
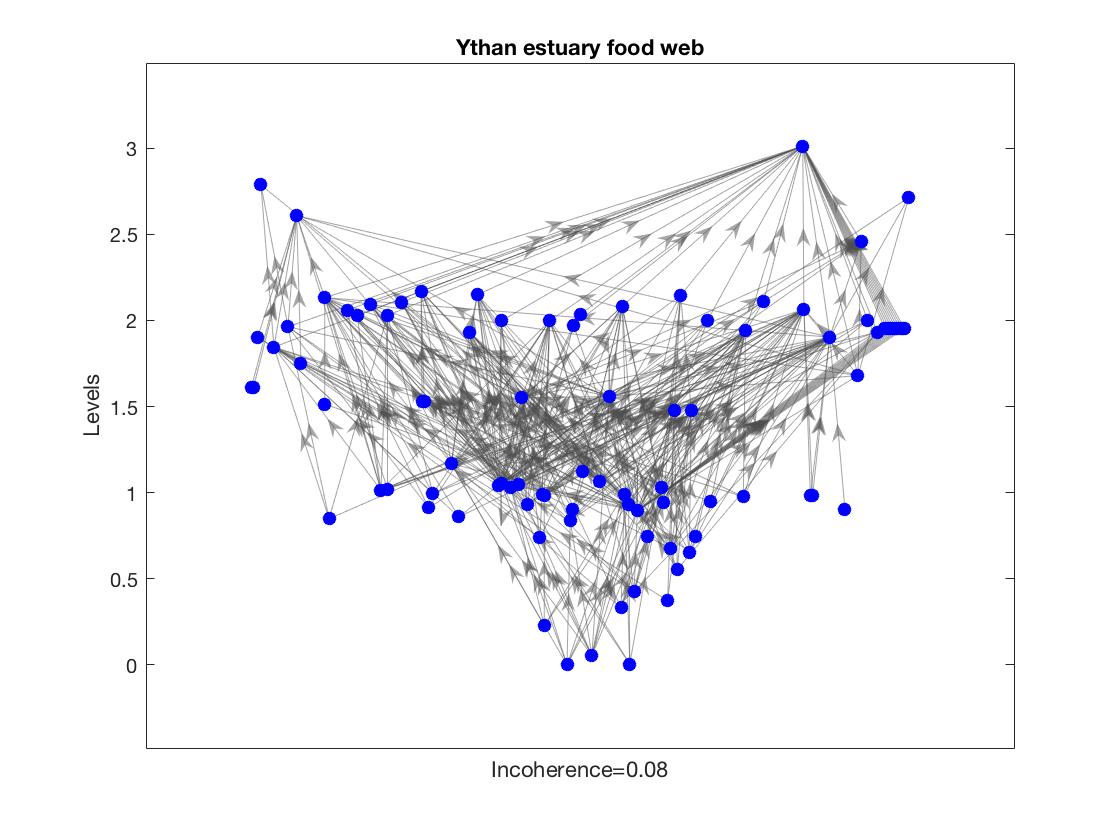
The network is fairly strongly layered; this is borne out by a small value of trophic incoherence .
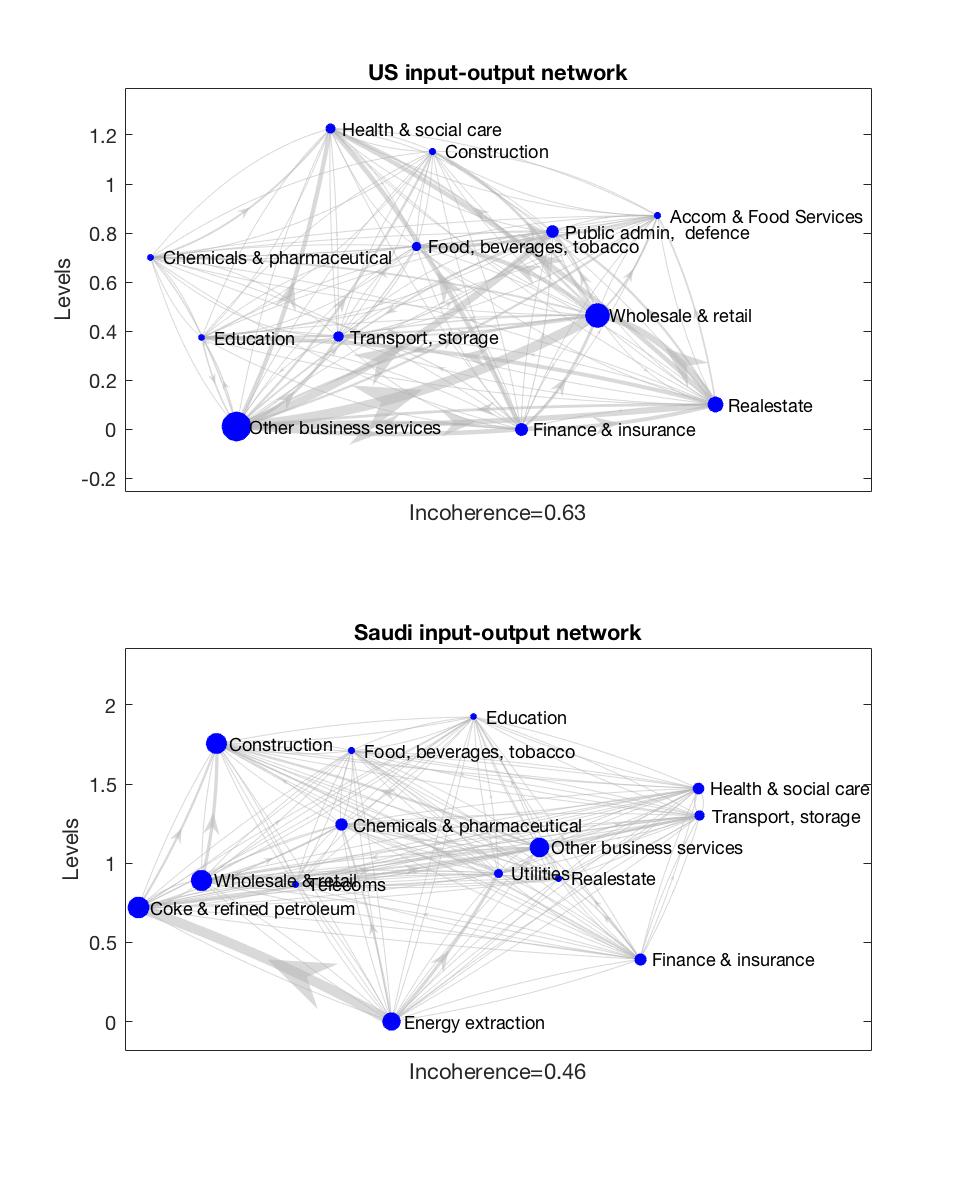
We continue with an example from economics where the ‘upstreamness’/‘downstreamness’ of firms, sectors and economies in production-chains is of wide relevance and interest (1, 5, 27). Figure 2 shows the inter-industrial flows of goods and services in the US and Saudi economies in 2015 (data taken from OECD input-output (IO) tables). Here the nodes represent economic sectors and weighted edges represent the dollar value of supplypurchase transactions between them (the full IO table had 35 sectors, but nodes with lower weight [2] were removed to allow presentation of a labeled network). This is an interesting application because there are no basal nodes (indeed the networks are fully connected, as is usual for IO relations, with every sector both supplying and buying from every other sector), so the old notions of trophic level and incoherence cannot be applied.
Unlike the Ythan food web, these IO networks are rather incoherent and this is borne out by much higher values of trophic incoherence ( and respectively). Nevertheless the new levels reveal the overall direction of flow in intermediate production: some sectors are key suppliers of intermediate inputs (for the US, financial, real estate and other business service sectors; for Saudi Arabia, energy extraction and finance) while other sectors are key users of inputs from other sectors (e.g. healthcare and construction).
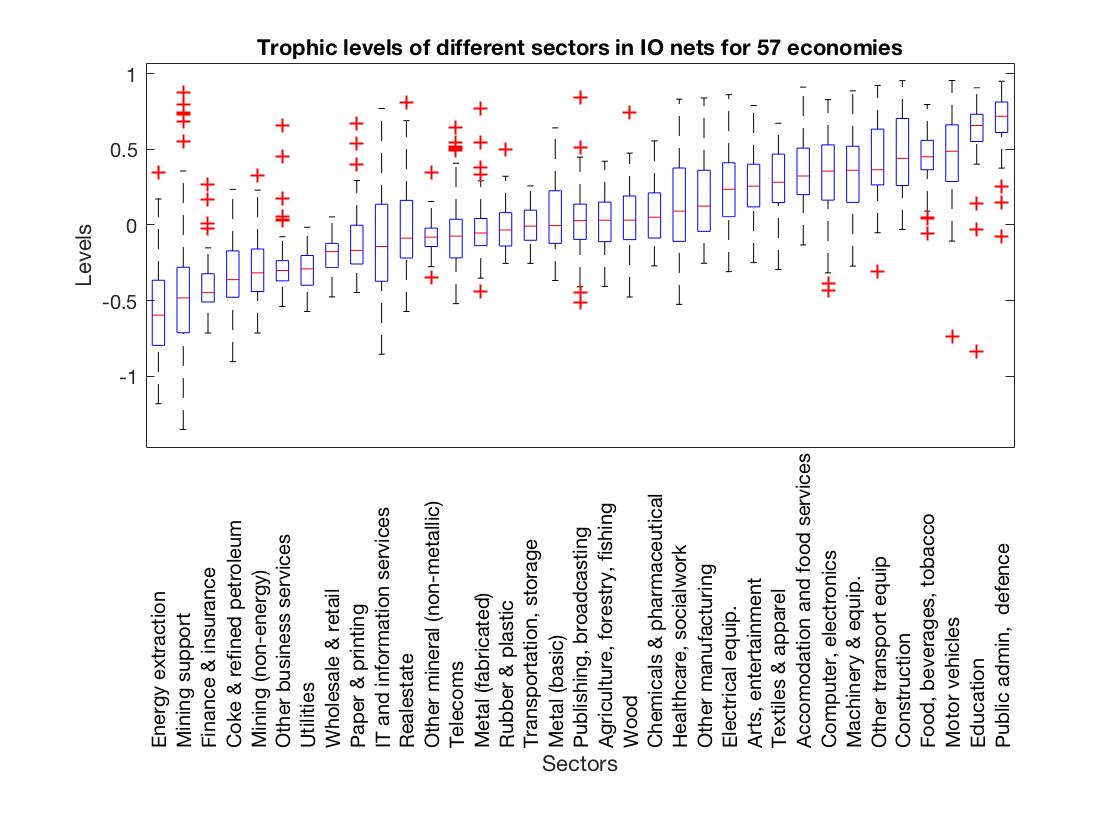
Figure 3 provides a more systematic and detailed analysis, presenting box-plots of the level of different sectors (using full 35 sector IO tables) for 57 countries (2015 data). Levels for each economy have been normalised to make the mean level (weighted by ) 0. While the size of different sectors varies across economies, there is considerable consistency of sector levels, which reveal the hierarchical architecture of value chains in the production process: we see an overall direction of flow from energy extraction and finance sectors; through other primary materials; then manufacturing industries; followed by sectors that supply final demand more directly, such as food makers, entertainment, and services; ending with education, public administration and defence sectors (that are overwhelmingly users more than suppliers of intermediate inputs).
There may be links to explore between sector levels and their role in economic performance - it is interesting for example to note that construction appears as a key user of inputs from other industries (implying strong backward-linkages) given the stylized business-cycle fact that house building leads the wider cycle (23). Meanwhile variation in the level of some sectors across different economies may also reveal interesting differences in production structure (e.g. finance occupies the same minimum position as energy extraction in China, but comes higher in the value chain for many other economies).
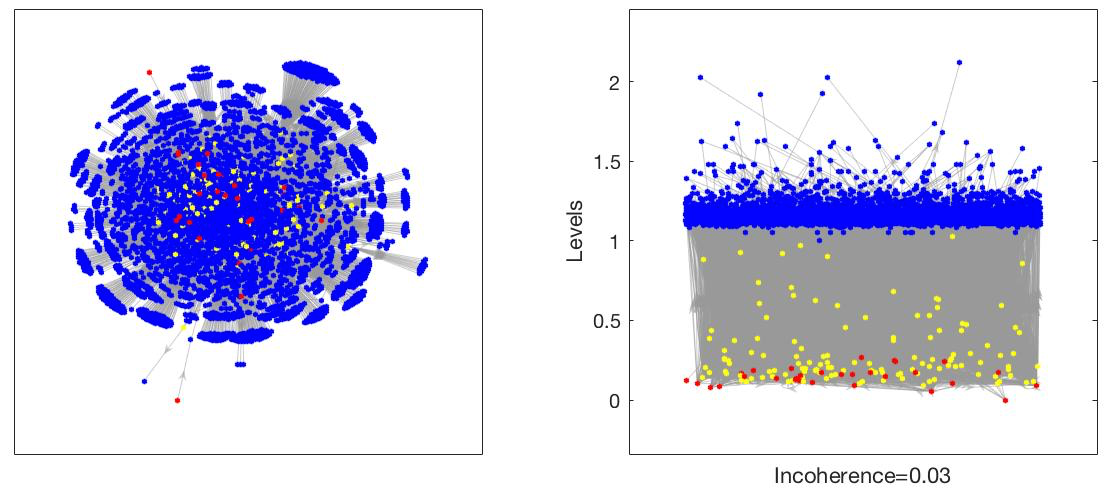
In biology, regulatory networks are sets of macromolecules that interact to control the level of expression of various genes in a given genome [Nature subjects: Regulatory networks]. Studies on regulatory networks have identified the existence of hierarchical structures and linked node levels to node properties, function (13, 17, 36) and the importance of regulators (8). Assigning hierarchical levels in cyclic networks, however, has presented a methodological challenge for this literature which our new levels overcome. Figure 4 shows an example transcription regulatory network (the yeast Saccharomyces cerevisiae (17)) plotted first with a force directed method (left), then according to the new levels (right). The new levels reveal a striking hierarchical structure. There are source (red), intermediate (yellow) and target (blue) nodes, but intermediate nodes do not form a distinct layer and the relevance of variation in their levels might be explored.
Flow-based hierarchies may also be important in social network settings (hierarchy and stratification are important concepts in sociology) and have been studied in e.g. online social networks (14, 25).
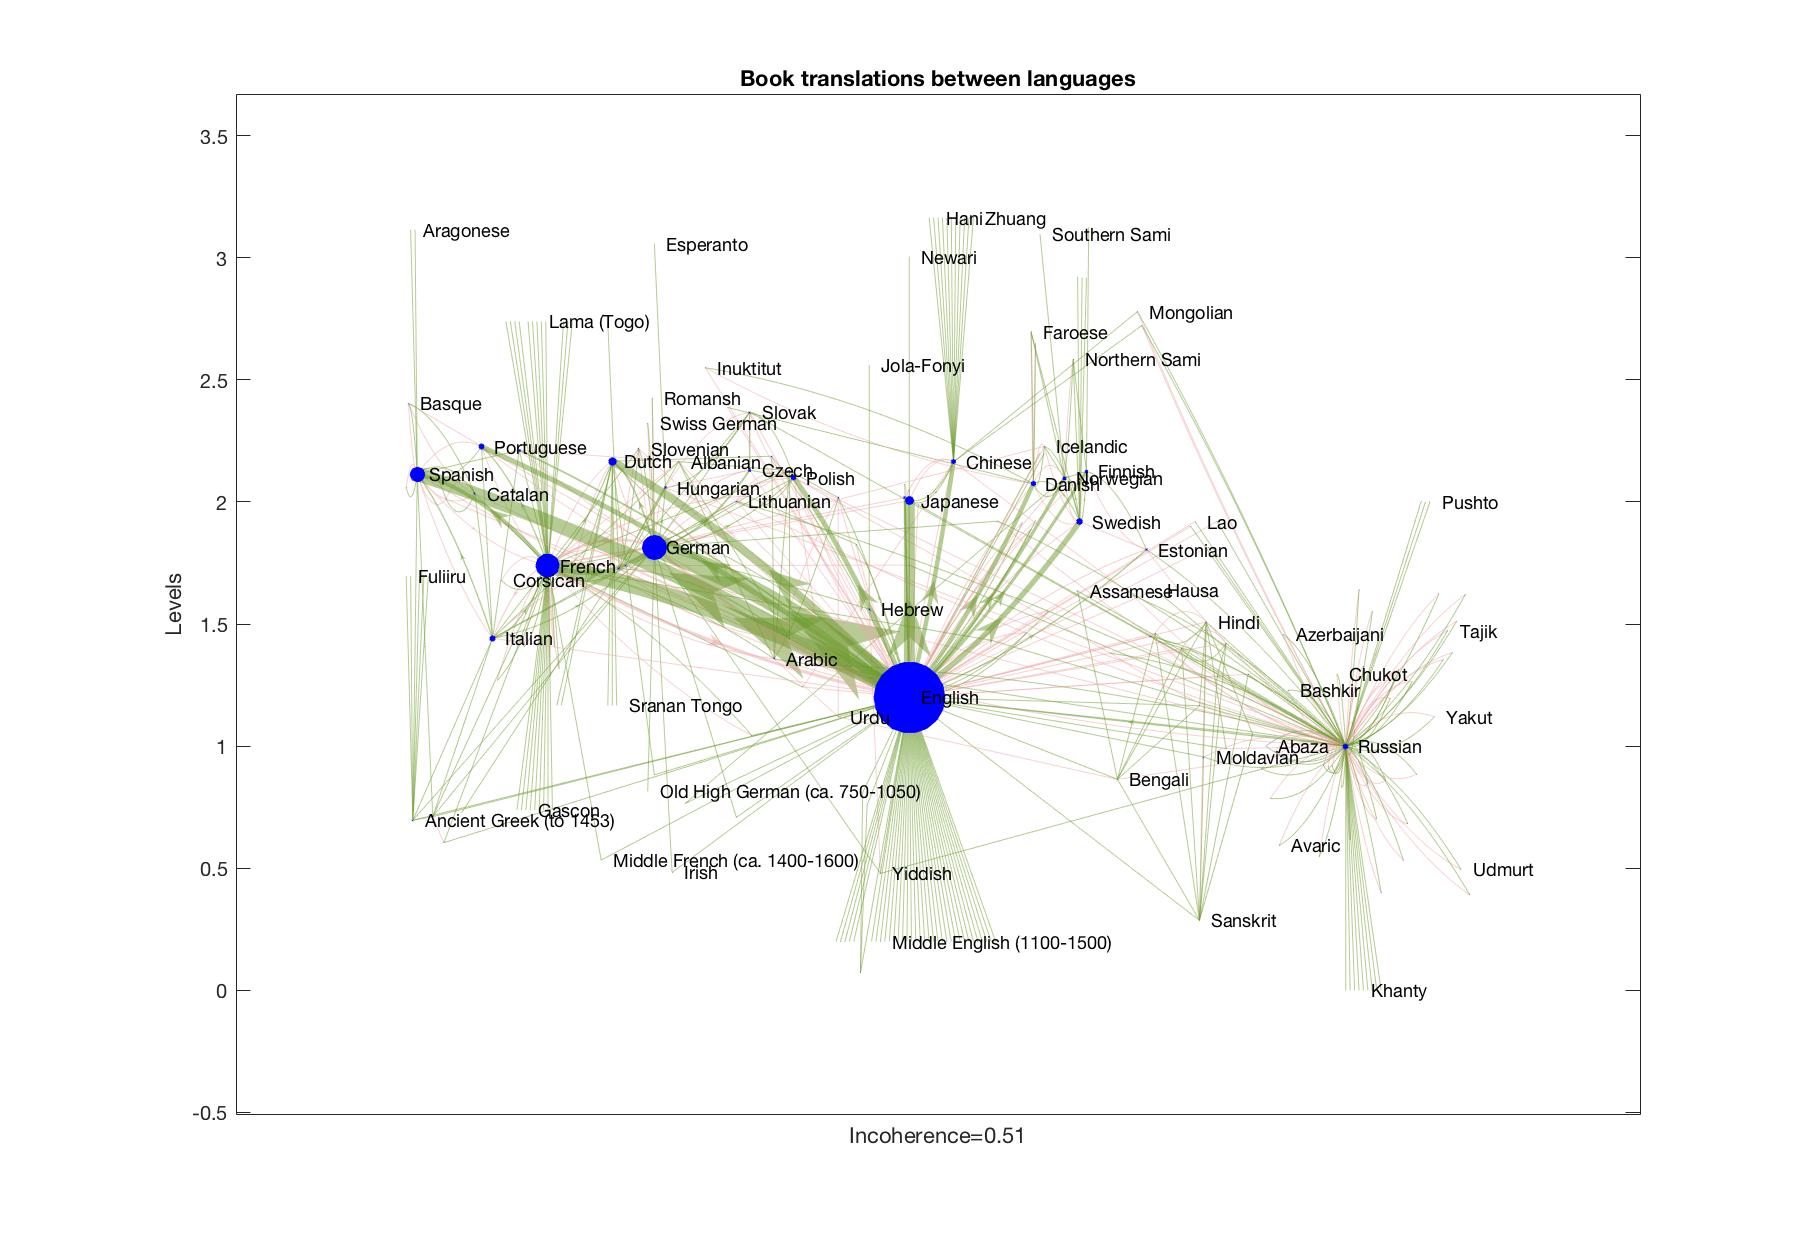
Figure 5 shows the trophic analysis of a network of book translations (32) based on a collection of more than 2.2 million book translations compiled by UNESCO’s Index Translationum project (35). Edge weights correspond to the number of books translated between source and target languages. Our new levels reveal interesting information on the position of different languages in this global network: at the bottom appear languages that are only source languages - unsurprisingly these include many ‘dead languages’ (Ancient Greek, Middle French and English, Sanskrit etc.). At the top appear languages nobody translates (these include minority and other languages that are small by number of speakers such as Faroese, Sami, and Mongolian). In the middle we find languages that are both target and source languages. The central role of English is striking: whilst translated into and out of, English is more important as a source language (lower in the hierarchy than any other major languages) and there are large flows from English into French, German, Spanish and Japanese. In this data-set only English is translated into Chinese which is in turn only a source language for minority languages in China (such as Hani and Zhuang). Russian is rather isolated in the global language network but forms an interesting community of bi-directional links with languages in its region.
Overall the network is surprisingly coherent (). While it is unlikely individual books flow along paths in this network (given books are presumably translated from original source language) its structure may be important in the flow of knowledge and ideas (32), and trophic analysis helps shed light on the strongly hierarchical structure in the global language network.
3 Comparison with old notions
The established concept of trophic level (24) requires the network to have at least one basal node, that is a node with no incoming edges. Then the height (to use Levine’s symbol) was set to a common value of for all basal nodes , though nowadays it is more common to set it to . The heights of the other nodes in connected components with basal nodes were determined by solving
| (9) |
for all non-basal , where each sum is over the nodes having edges to . Levine normalised the weights coming into each node so that , which makes no change to [9]. In matrix form, the equation for the heights (with the convention for basal nodes) can be written as
| (10) |
where
| (11) |
and
| (12) |
The same concept was introduced in economics by (2), but fixing top nodes (those with no outgoing edges) to a common height. It is equivalent to Levine’s after reversing all the edges.
Then (16) defined the trophic incoherence of the network to be the standard deviation of the height differences over edges. They took edge weights all , but a natural generalisation is to weight the height differences by the edge weights. The edge-weighted mean difference of Levine’s heights is precisely (24), so Johnson et al’s definition of trophic incoherence becomes
| (13) |
Indeed, Levine defined “trophic specialisation” of a node as
| (14) |
So is the average of weighted by .
Our equation for trophic heights can be seen as a symmetrised version of Levine’s, without the fix for basal nodes. Thus our definition doesn’t need any basal nodes and does not force them all to the same level if there is more than one basal node.
Our definition of trophic incoherence is the same as but using our new heights instead of Levine’s. It represents, in roughly the same way, the failure of the height differences to all be . A distinction to bear in mind, however, is that for our new levels, the edge-weighted mean height difference
| (15) |
is not necessarily . In fact, we prove in the SI that . So is not in general the (edge-weighted) variance of the height differences. To obtain the variance of the height differences one has to subtract from . Thus there is a case for considering alternative measures of incoherence to , such as the ratio , which evaluates to
| (16) |
and is the appropriate replacement for . In the other direction, the analogue of is .
Figure 6 shows some comparisons of trophic levels for two networks with basal nodes, determined by the two methods. They are both supply networks, extracted from Bloomberg by taking all suppliers and buyers within 3 hops of a given firm (a hop being an edge in either direction). The nodes represent firms and a directed edge represents that the first firm supplies goods or services to the second.
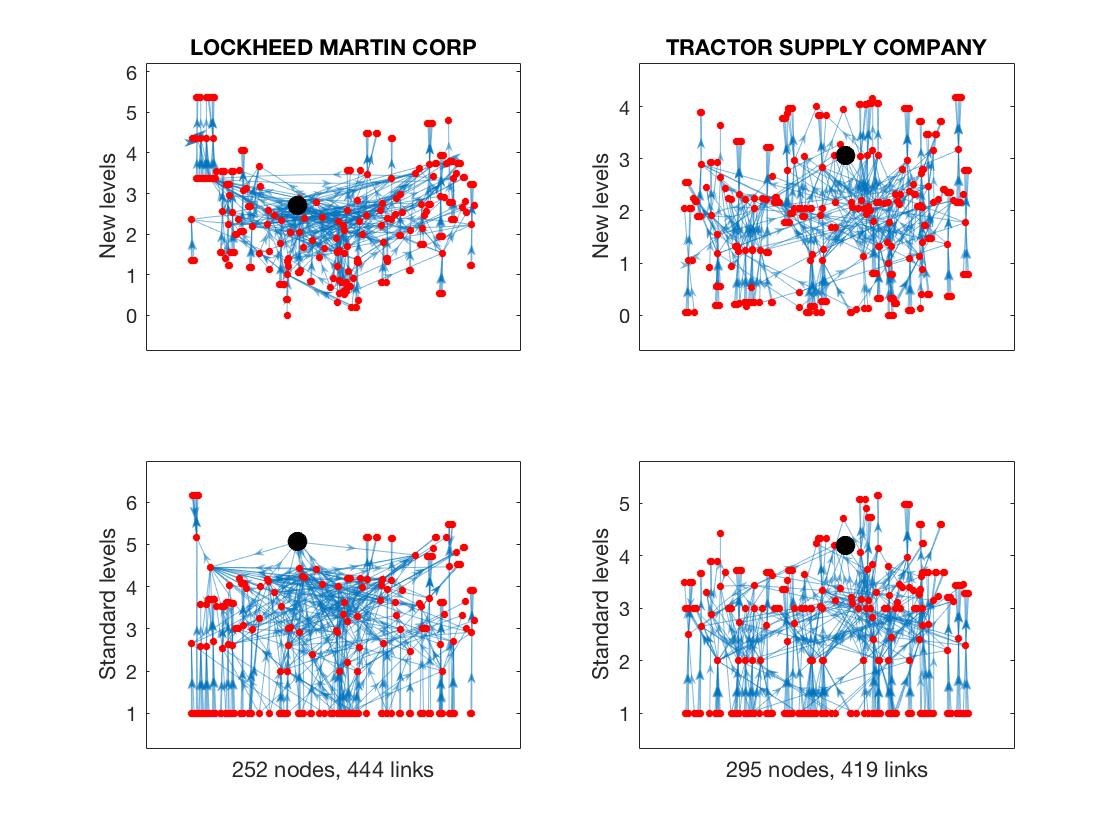
We see that the requirement of the standard approach to put all basal nodes at a common level makes an artificial distortion of the levels in the lefthand case, though less so on the right.
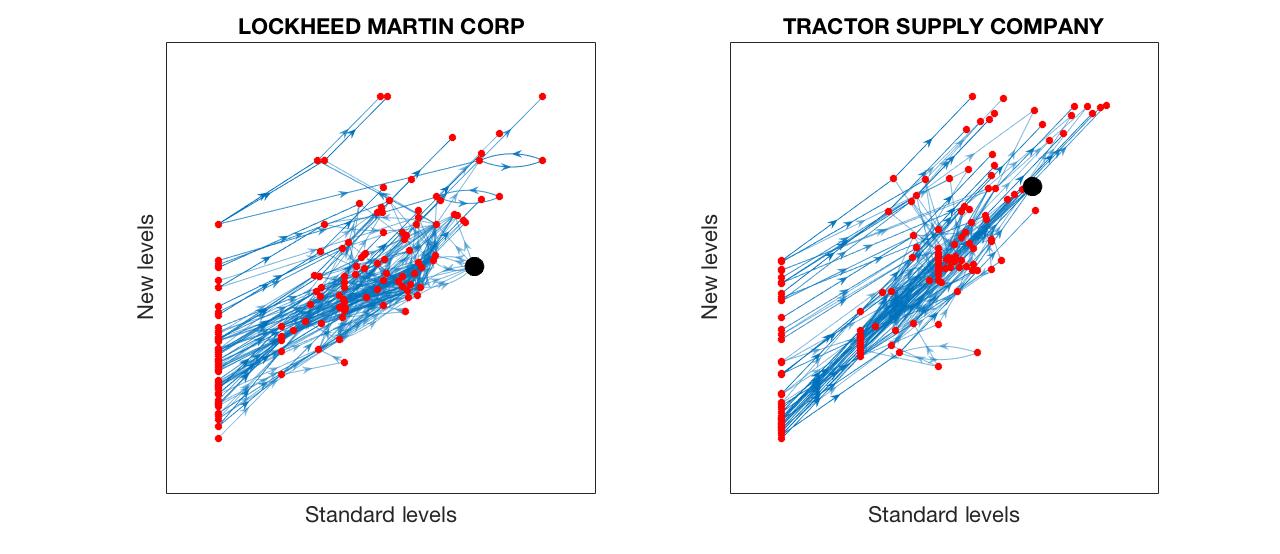
As an alternative comparison, in Figure 7 we plot (for the same two supply networks as Figure 6) the old levels against the new levels.
If one reverses all the edges then with our new definition one obtains the reflection of the trophic levels, up to an overall shift depending on the convention used to fix the zero of the levels. The trophic incoherence is unchanged. For example, for a supply network, instead of the flows of goods and services one could instead consider the flows of payment, which are more or less the reverses of the flows of goods and services.
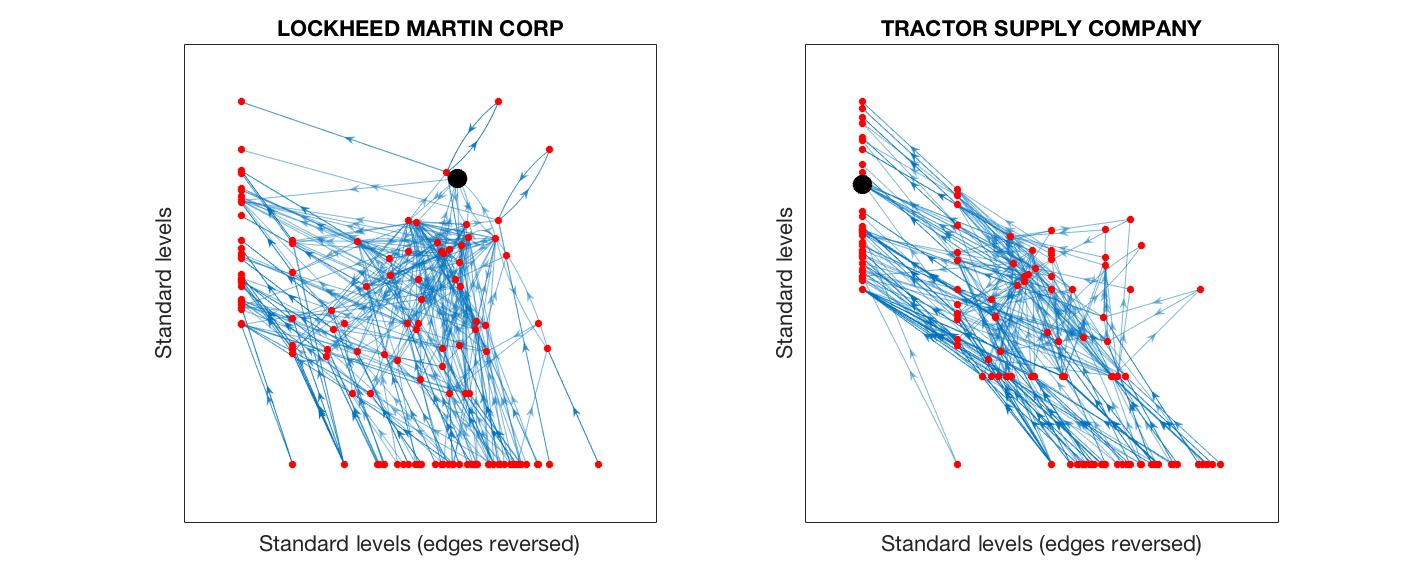
In contrast, the old notion of trophic level is usually not symmetric with respect to change of direction of all the edges. Figure 8 shows the trophic levels of firms in our two example supply networks obtained according to the old notion, (i) when edges are directed from supplier to buyer (showing the direction of material and service flows), and (ii) under the reverse interpretation (showing the direction of payment flows from buyers to sellers). It is apparent that with the old notion there is a big change in levels, the relevance of which is unclear. Unless there is a good reason to favour basal nodes, we propose that our symmetric notion is better.
There have been some other approaches to rectifying the limitations of the original notion of trophic level. Dominguez et al (12) obtain a ‘basal set’ of nodes and eliminate all edges within that set. Moutsinas et al (28) define levels using a pseudo-inverse of . These solutions allow application to networks without basal nodes but they don’t possess symmetry with respect to reversal of edge directions nor a natural notion of maximal incoherence. Another way to quantify trophic incoherence is to find the smallest number of edges to delete to obtain an acyclic graph (33), but it has some defects (22). The smallest number is called the “agony” of the network. Our trophic analysis provides a useful upper bound for agony, given by the number of edges with negative height difference, and could provide a useful heuristic for its exact computation.
In a very recent paper, (19) decompose flows on a network into the sum of a potential part and a circulating part. This looks a very nice approach, though it requires specifying conductivities for each edge as well as the flow on it, instead of specifying a target height difference for each edge. The analysis has strong connections with ours, in particular the minimisation principle to determine the potential and an electrical interpretation (see SI). Further work is required to make comparisons.
4 Robustness of local computation
If we determine trophic levels on a piece of a network by truncating the network at some distance from a chosen node, measured for example by the number of edges in either direction, how robust is the outcome to the truncation?
First we take care of the arbitrariness of the zero of trophic levels. The simplest way to do that is to take the chosen node to be always at height zero.
Next, we refine the question because the trophic levels near the boundary of the piece of the network may change significantly with the truncation. We ask how much the trophic levels change on a connected subset of the network containing the chosen node, which we will call zone 1, given a buffer zone 2 chosen so that there are no direct edges in either direction between zone 1 and the outside, called zone 3. We choose the buffer zone so that in addition the union of zones 1 and 2 is connected (the only way this can not be satisfied is if zone 2 contains nodes which are not connected to zone 1 by a path in zone 2, in which case one can just throw them out).
Figure 9 shows the outcome of a test, taking zone 1 to be the set of suppliers and buyers of General Motors (GM) 2 hops from GM, and computing the effects on the trophic levels in zone 1 of truncation of the network at 3, 4 and 5-hops respectively (i.e. allowing a zone 2 buffer), compared to truncating at 7-hops. One can see that the trophic levels on zone 1 stabilise quite rapidly.
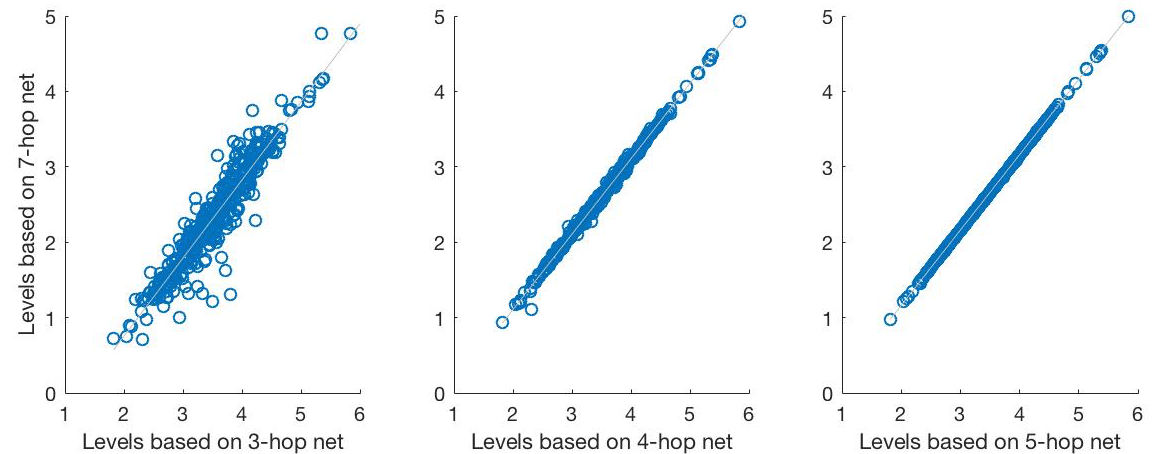
In the SI, we give some theoretical analysis to support the general conclusion that the levels on zone 1 are robust to changes on zone 3.
5 Connections to other network properties
A large part of the interest of the original notion of trophic coherence was its relation to network properties such as the stability of equilibria of Lotka-Volterra dynamics on the network (16), the dynamics of spreading processes (20), prevalence of cycles (18), other motifs (21), intervality (12) and normality (15). We show here that the new notion of trophic coherence has similar connections, even stronger, and it enlarges the scope of application because it does not require basal nodes. We examine three of the properties.
5.1 Normality
A directed network is said to be normal if its weight matrix commutes with its transpose :
| (17) |
Note that represents the same weighted network but with all the edges reversed. Empirical directed networks are often highly non-normal (4). The term “normal” came from people who spent their lives with self-adjoint operators and unitary operators, both of which are normal, but people working in stability of ordinary differential equations are fully cognizant that most matrices are not normal.
For the unweighted case of an adjacency matrix , normality implies the imbalance vector . This is because is the number of sources in common to nodes and , and is the number of sinks in common. In particular, and , so implies that and .
When we say a network is balanced. A network is balanced if and only if its trophic incoherence (see SI). So normal unweighted networks are maximally incoherent.
Another special case of normality is symmetric networks . If is symmetric then the imbalance vector . So symmetry implies maximal incoherence.
The concept of normality is broader than either of these, however. Normality of is equivalent to existence of a unitary matrix such that is diagonal (34) (a unitary matrix is a complex-valued matrix such that , where is the complex conjugate of the transpose of ). The diagonal elements of are the eigenvalues of (with multiplicity). From this we obtain the following extension of the result for symmetric networks: if is normal and has all eigenvalues real then (see SI). Perhaps the restriction to real eigenvalues is not necessary but we did not succeed in proving that.
Maximal incoherence, however, is not equivalent to normality. There are non-normal networks with and hence maximal incoherence, e.g.
| (18) |
Nevertheless, the extent to which a network is normal seems to be positively correlated with its trophic incoherence . The degree of normality of a network can be quantified by
| (19) |
where is called the Frobenius norm of , and are the eigenvalues of (with multiplicity). The literature uses as a quantifier of non-normality, but we consider it simpler to use . The normality of lies in the interval , with if and only if is normal (34). If is maximally coherent () then all its eigenvalues are 0 (SI), so and it is maximally non-normal. But one can have without , for example the feed-forward motif (see Figure 10) with
| (20) |
for which and .
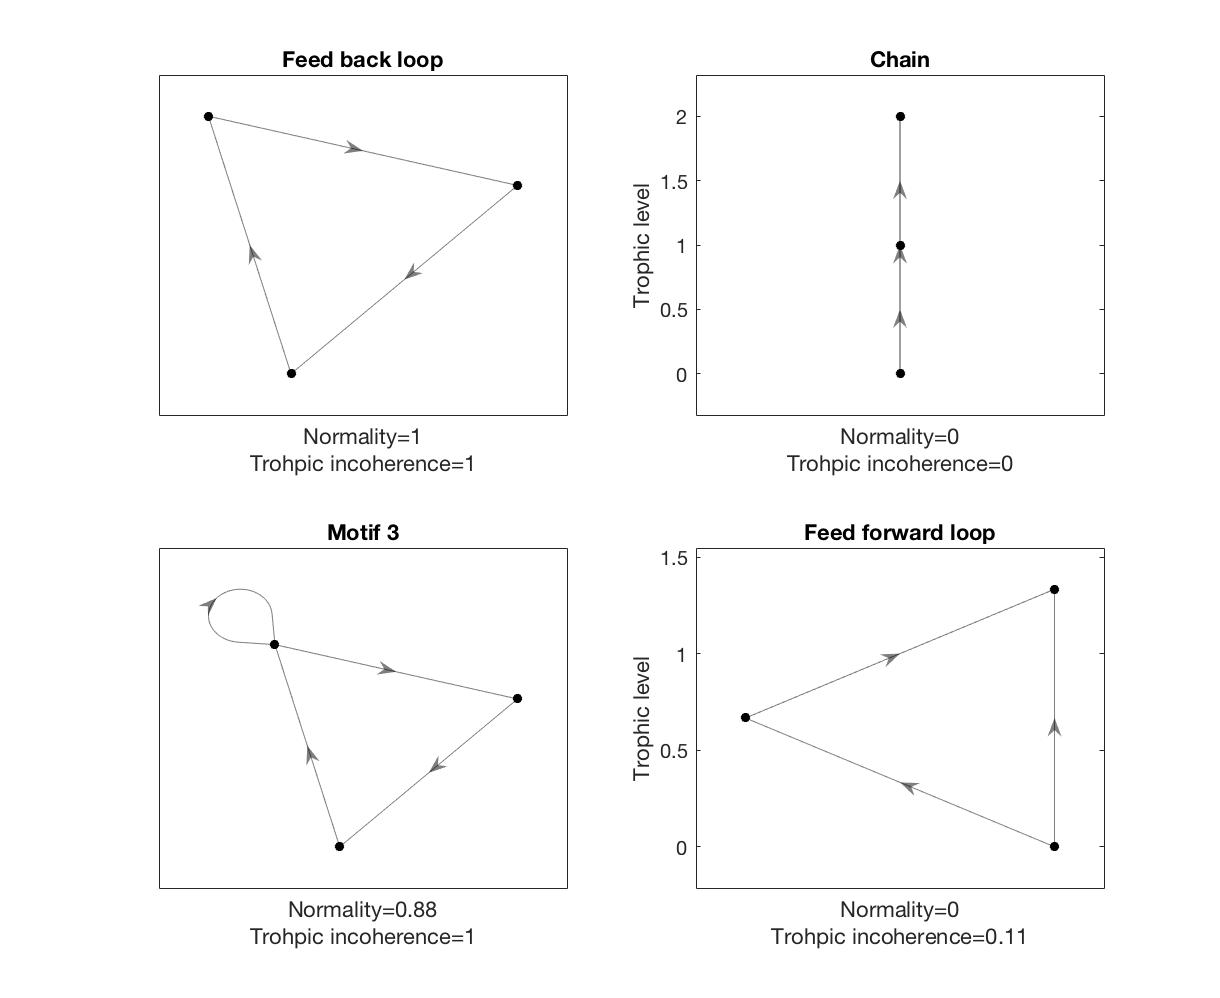
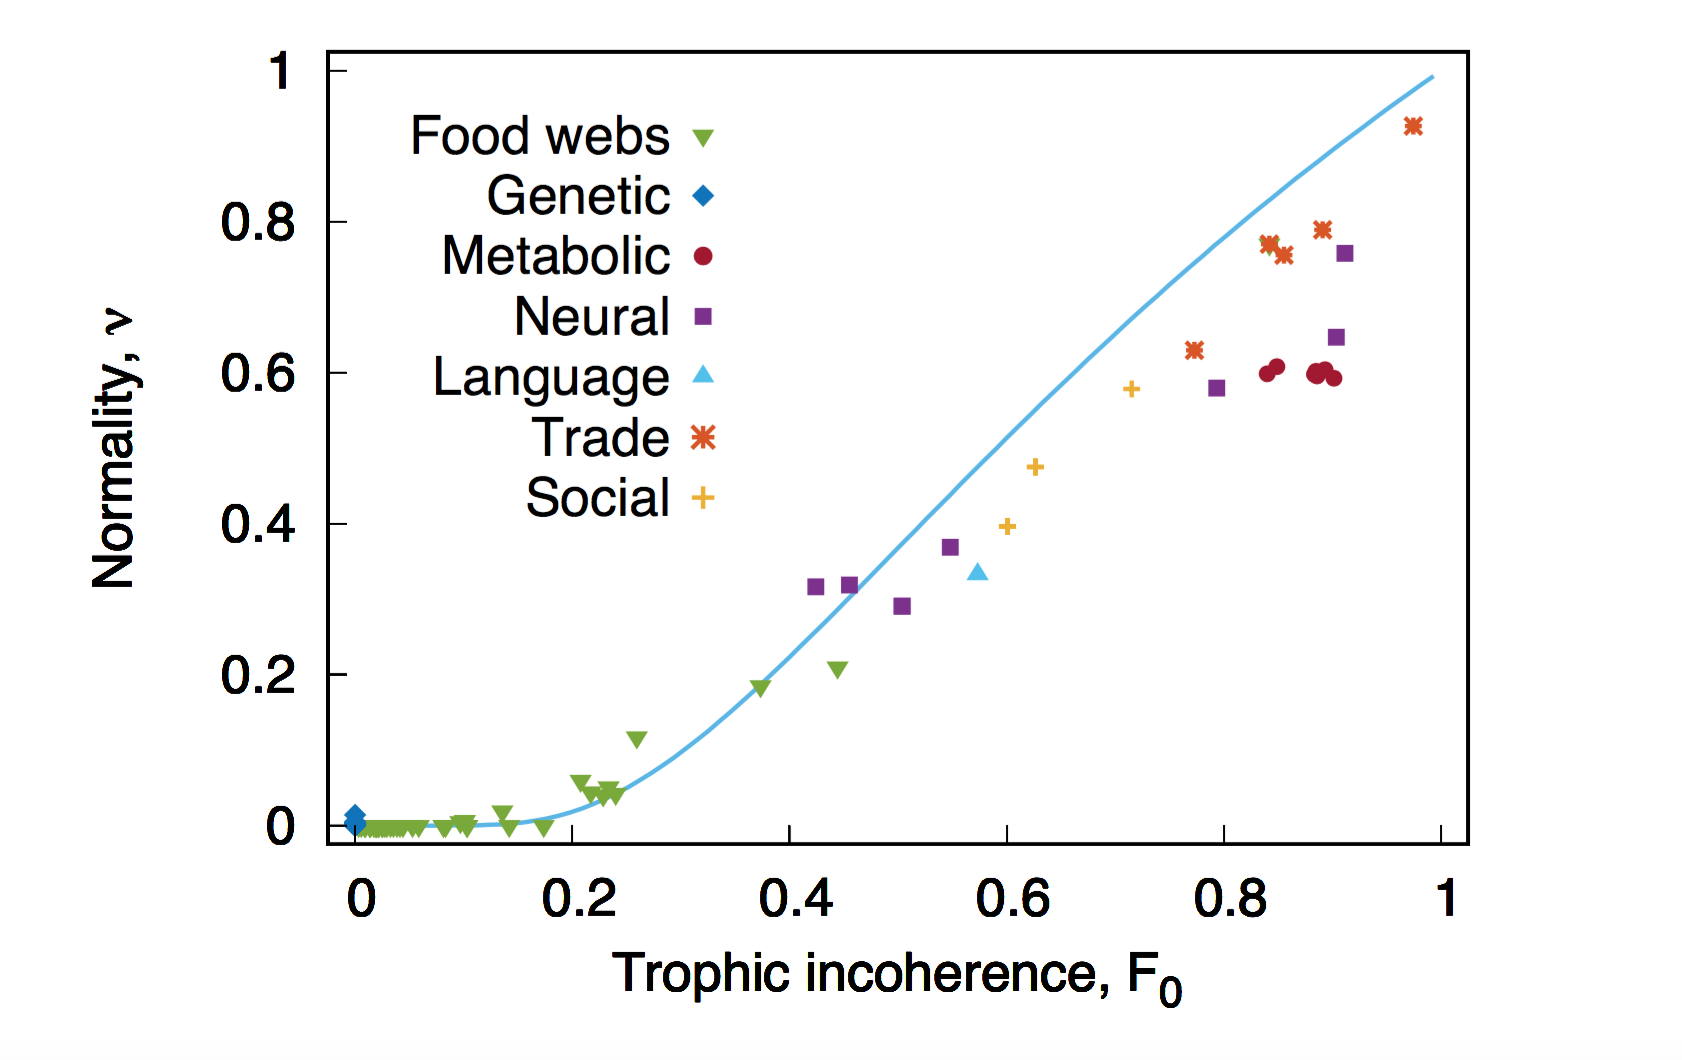
Figure 11 shows normality against trophic incoherence for some real networks. We see that normality increases with , but not linearly. In the SI we present heuristic arguments in favour of a relationship between them of the form . This is consistent with a relationship between normality and the old notion of trophic coherence (15).
5.2 Stability
Next we discuss how dynamical processes on networks are affected by their trophic coherence.
A simple dynamical model for contagion on a weighted network in discrete time is
| (21) |
where represents the amount of infection at node at some time, the amount at the subsequent time, and is a reduction factor. We wish to know whether the total infection on the network will grow or decay. In vector-matrix form the solution after time is
| (22) |
The answer (see SI) is that if then as , whereas if and condition : for some node in or leading to a “key” communicating class – then , where the spectral radius of is the largest absolute value of the eigenvalues of . Actually, because has all entries non-negative, it has a real positive eigenvalue of maximum modulus, so that is . Indeed, under condition ,
| (23) |
We have already mentioned that a maximally coherent network has all its eigenvalues 0, so implies . This suggests that , scaled by a suitable measure of the strength of , might correlate positively with . The strength of can be measured by any norm, for example the 2-norm . This can be defined in various ways, of which perhaps the simplest is that is the largest eigenvalue of (which is necessarily real and non-negative and is equal to that for ). For any operator-norm, . Thus is contained in , like . An advantage of the particular choice of the 2-norm is that if is normal. So we define the scaled spectral radius
| (24) |
Then we deduce from the subsection on normality various cases with simultaneously and .
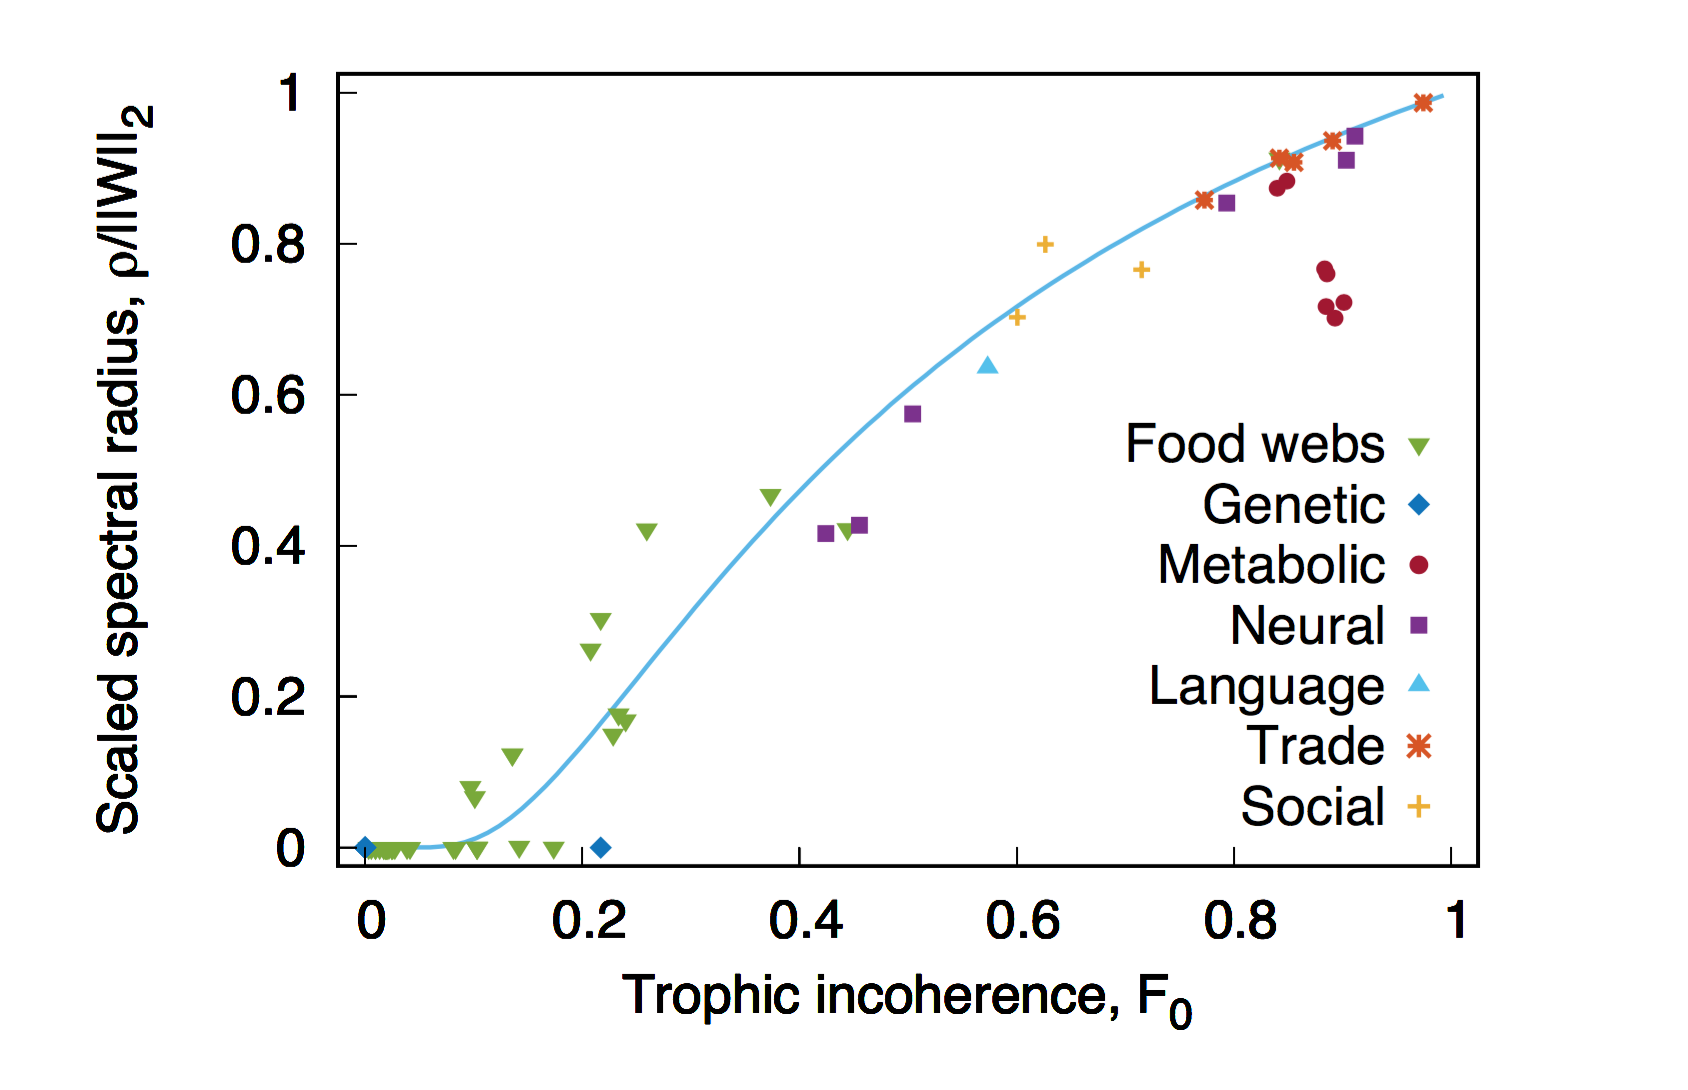
Thus we look at how correlates with the scaled spectral radius in Figure 12. In the SI we give heuristic arguments in favour of a relation .
We can also consider a simple dynamical model for contagion in continuous time:
| (25) |
with a recovery rate. The solution can be written in vector-matrix form as
| (26) |
Again one can ask whether the total infection grows or decays. This is now a question of the maximal real part of the eigenvalues of , but because is non-negative, the maximal real part of eigenvalues is actually . So the answer is growth for , decay for . So again it is interesting to link with .
Some other dynamics on networks is discussed in the SI.
5.3 Cycles
A cycle in a directed network is a closed walk in it. In contrast to some of the literature, we allow repeated edges and repeated nodes. In particular, we allow a cycle to be a periodic repetition of a shorter cycle. The weight of a cycle is the product of the weights along its edges.
A maximally coherent network () has no cycles, because it has height difference for every edge whereas along a cycle the nett change in height has to be zero. There are acyclic graphs with , however, for example the feedforward motif [20].
A maximally incoherent network () must have cycles. This is because it is balanced and so some of the flow that leaves a node must eventually come back to it (see SI). In fact, we deduce that every edge is in at least one cycle.
So these results suggest some relation between trophic incoherence and a quantifier of cyclicity.
The total weight of cycles of length is given by the trace of the power of : , because and the trace of a matrix is the sum of its diagonal entries. One might expect it to behave asymptotically exponentially as , but for example if points in a circle are each connected to just their clockwise neighbour by an edge of weight , then when is a multiple of , otherwise. The tidy way to study the sequence is to form the zeta function
| (27) |
for complex close enough to (some authors define to be the reciprocal of this). Then a notion of the cyclicity of is the reciprocal of the radius of convergence of the power series. This is just . Using , the zeta-function can equivalently be written as . The reciprocal of its radius of convergence is the spectral radius . So actually, the appropriate measure of cyclicity is relative to some measure of the size of . We take again for the latter. Thus cyclicity is related to exactly as is the stability of our simple contagion processes. In particular it is 1 for any normal network.
In the SI, we relate to the prime cycles, those which are not repetitions of a shorter cycle, and furthermore to the elementary cycles, those which do not repeat a node.
6 Discussion
We have improved the definitions of trophic level and incoherence so that they can be applied to any directed network, not just those with basal nodes, to remove a bias from basal nodes, to make incoherence have a natural range from perfect coherence to maximal incoherence, and to make it possible to compute them locally in a network without having to compute them for the whole network.
We anticipate our improved notions being useful in many domains, from ecology, gene expression, neuroscience, supply networks and financial networks to linguistics and social networks. The scope is enormous.
A further issue to address is the effect of splitting or merging nodes. It may be appropriate to develop a refined notion of trophic level to allow the target height differences between nodes to be specified rather than all being taken .
Mathematical Analysis
Proofs of the mathematical results presented here are included in the SI.
Data Sources
The data used to produce Figure 1 was downloaded from (9) and can be accessed from: https://datadryad.org/stash/dataset/doi:10.5061/dryad.1mv20r6. The data used to produce Figures 2 and 3 are from the OECD Input-Output Tables described and available here: http://www.oecd.org/sti/ind/input-outputtables.htm, from the OECD website. The data for Figure 4 was downloaded from (17) here: https://www.ncbi.nlm.nih.gov/pmc/articles/PMC2736650/. The data for Figure 5 published in (32) was downloaded from http://language.media.mit.edu/data. The supply network data-sets presented in Figures 6-7 and used for the analysis presented in Figure 9 are based on supply-chain relationships compiled from Bloomberg L.P. supply chain function. Bloomberg’s database compiles information from a wide variety of sources to provide a view of global supply chains at the firm level. More information on this data can be obtained from Bloomberg L.P. or (11). To construct our networks of supplier–buyer relationships, starting from a focal firm of interest we then followed links identified by the Bloomberg database. These data-sets could with Bloomberg’s permission be made available on request, or re-compiled from Bloomberg. The data used for Figures 11 and 12 can be downloaded from https://www.samuel-johnson.org/data, along with a list with references to the original sources. All code used to make empirical and computational analysis of public data and data-files is available for download at this Github repository, where we also provide a Matlab toolbox for the easy implementation of the methods we have introduced and related analysis.
The support of the Economic and Social Research Council (UK), through grant ES/R00787X/1, is gratefully acknowledged. This was awarded via a call from the Instability hub of the Rebuilding Macroeconomics programme of the National Institute for Economic and Social Research (NIESR). We are grateful to other members of our project team for their comments, especially Nicholas Beale for asking for a quantification of coherence that does not depend on having basal nodes and has a clear maximum and minimum, and to other members of the Instability hub for their comments and interest. We are also grateful to Giannis Moutsinas for sharing their approach to the subject, and to Mark Pollicott for useful discussion about the zeta function. SJ and RSM acknowledge support of the Alan Turing Institute under EPSRC grant EP/N510129/1 and Fellowship grant TU/B/000101.
References
- (1) Antràs P, Chor D, On the Measurement of Upstreamness and Downstreamness in Global Value Chains, NBER Working Paper Series No.24185 (2018).
- (2) Antràs P, Chor D, Fally T, Hillberry R, Measuring the upstreamness of production and trade flows, Amer Econ Rev 102:3 (2012) 412–6.
- (3) Artuso R, Aurell E, Cvitanovic P, Recycling of strange sets: I. Cycle expansions, Nonlinearity 3 (1990) 325–359.
- (4) Asllani M, Lambiotte R, Carletti T, Structure and dynamical behavior of non-normal networks, Science Advances 4:12 (2018) eaau9403
- (5) Backer K, Miroudot S, Mapping Global Value Chains, ECB Working Paper Series No.1677 (2014)
- (6) Bang-Jensen J, Gutin GZ, Digraphs: theory, algorithms and applications (Springer, 2008).
- (7) Berman A, Plemmons RJ, Nonnegative matrices in the Mathematical Sciences (SIAM, 1994).
- (8) Bhardwaj N, Kim PM, Gerstein MB, Rewiring of transcriptional regulatory networks: hierarchy, rather than connectivity, better reflects the importance of regulators, Sci Signal (2010) 3:79.
- (9) Cirtwill, Alyssa R.; Eklöf, Anna, Data from: Feeding environment and other traits shape species’ roles in marine food webs, Dryad, Dataset,(2018).
- (10) Cohen et al, Food webs are more than the sum of their tritrophic parts, PNAS 52 (2009) 22335-22340.
- (11) Davenport, Richard, Bloomberg’s Supply Chain Algorithm: Providing Insight into Company https://www.overleaf.com/project/5df787ec7e70160001def6ed Relationships, Bloomberg Terminal. 18 Aug (2012)
- (12) Dominguez-Garcia V, Johnson S, Muñoz MA, Intervality and coherence in complex networks, Chaos 26 (2016) 065308.
- (13) Gerstein MB, Kundaje A, Hariharan M, Landt SG, Yan K, Cheng C, Grubert F, Architecture of the human regulatory network derived from ENCODE data. Nature, 488:7414 (2012) 91–100.
- (14) Gupte M, Finding Hierarchy in Directed Online Social Networks, Proc. of WWW’11 (2011) 557–566.
- (15) Johnson S, Digraphs are different: Why directionality matters in complex systems, arXiv:1908.07025 (2019)
- (16) Johnson S, Dominguez-Garcia V, Donetti L, Muñoz MA, Trophic coherence determines food-web stability, Proc Natl Acad Sci USA 111:50 (2014) 17923–8.
- (17) Jothi, R, Balaji, S, Wuster, A, Grochow, JA, Gsponer, J, Przytycka, TM, … Babu, MM, Genomic analysis reveals a tight link between transcription factor dynamics and regulatory network architecture, Molecular Systems Biology, 5:294 (2009)
- (18) Johnson S, Jones NS, Looplessness in networks is linked to trophic coherence, Proc Natl Acad Sci USA 114:22 (2017) 5618–23.
- (19) Kichikawa Y, Iyetomi H, Iino T, Inoue H, Community structure based on circular flow in a large-scale transaction network, Applied Network Sci 4 (2019) 92
- KJ (1) Klaise J, Johnson S, From neurons to epidemics: how trophic coherence affects spreading processes, Chaos 26 (2016) 065310
- KJ (2) Klaise J, Johnson S, The origin of motif families in food webs, Sci Rep 7 (2017) 16197
- (22) Leticia E, Barucca P, Lillo F, Resolution of ranking hierarchies in directed networks, PLoS ONE 13:2 (2014) e0191604
- (23) Leamer EE, Housing Is the Business Cycle, NBER Working Paper Series No.13428 (2007)
- (24) Levine S, Several measures of trophic structure applicable to complex food webs, J Theor Biol 83 (1980) 195–207.
- (25) Lu C, Yu JX, Li R, Wei H, Exploring Hierarchies in Online Social Networks, IEEE Transactions on Knowledge and Data Engineering 28:8 (2016) 2086–2100.
- (26) Moran J, Bouchaud J-P, May’s instability in large economies, Phys Rev E 100 (2019) 032307
- (27) McNerney J, Savoie C, Caravelli F, Farmer D, How production networks amplify economic growth, arXiv:1810.07774
- (28) Moutsinas G, Shuaib HC, Guo W, Jarvis S, Generalised trophic levels and graph hierarchy, arXiv:1908.04358 (2019)
- (29) Newman MEJ, The structure and function of complex networks, SIAM Review 45 (2003) 167–256.
- (30) Pollicott M, Dynamical zeta functions and the distribution of orbits, to appear in: Handbook of Group actions vol.V (International Press)
- (31) Reed M, Simon B, Functional analysis (Academic Press, 1980).
- (32) Ronen S, Gonçalves B, Hu KZ, Vespignani A, Pinker S, Hidalgo CA, Links that speak: The global language network and its association with global fame, PNAS 111:52 (2014) E5616–E5622.
- (33) Tatti N, Faster way to Agony, in: ECML PKDD 2014 Pt III, ed Calders T et al, Lect Notes Comp Sci 8726 (2014) 163–78.
- (34) Trefethen LN, Embree M, Spectra and pseudospectra: the behavior of nonnormal matrices and operators (Princeton U Press, 2005).
- (35) UNESCO, Index Translationum: World Bibliography of Translation. Available at www.unesco.org/xtrans/bsform.aspx.
- (36) Yu H, Gerstein M, Genomic analysis of the hierarchical structure of regulatory networks, PNAS 103(40) (2006) 14724–14731.
Supporting Information
Solutions of
The graph Laplacian is not invertible: for any constant vector , . Indeed for any that is constant on connected components of the network, , and the kernel of is precisely this set of . Similarly, for any , the components of on each connected component of the network add up to zero, and this property characterises the range of . Now the imbalance vector has the special property that the sum of its components over any connected component of the network is zero. Thus it follows that always has a solution , and the general solution is given by adding any vector that is constant on each connected component.
Range for trophic incoherence
Here we prove that with iff all height differences and iff all height differences are .
First, we explain that the trophic heights solving correspond to the minima of the trophic confusion function
| (28) |
over all possible assignments of heights . This is because the second derivative of is positive semi-definite, so all critical points are minima, and by differentiating with respect to each , the equation for critical points is . Furthermore, the minimum value of this expression is .
Since for all , we see that . Furthermore, iff all height differences are . Next, putting all heights equal, say to 0, denoted by , gives , so . Now if at some then because and the second derivative of is positive semi-definite with null space given by constants on each connected component, then must be in this nullspace, i.e. is constant on each connected component. Thus all height differences along edges are zero.
Mean height difference
The mean height difference
| (29) |
is . To prove this, write the trophic confusion function as
| (30) |
with
| (31) |
If minimises then must be minimised over at . But
| (32) |
which has unique minimum at (unless ). Thus . But . So , hence . If , we see that and hence is satisfied in that case too.
Electrical interpretation
Our new notion of trophic levels can be given an electrical interpretation. The edge weights are conductivities of bidirectional connectors between nodes. Current is injected into (or extracted from, according to sign) each node . The resulting voltages (modulo an arbitrary overall shift) are the trophic heights . One could imagine the currents as being generated by making a copy of all the incoming and outgoing edges of node and imposing a voltage difference of on all its input nodes and on all its output nodes, relative to .
Robustness of trophic levels to truncation of the network
We recall that we choose a connected subset called zone 1 and fix the height of one of its nodes (or the weighted average of its nodes) to be . We choose a buffer zone 2 so that there are no direct connections between zone 1 and the outside, called zone 3, and so that the union of zones 1 and 2 is connected.
Then the equation for the heights can be broken into the block form
| (33) | |||||
| (34) | |||||
| (35) |
Changes to the outside zone 3 can affect and the diagonal part of . Let us suppose that the total weights of connections in each direction between zone 3 and each node of 2 are given. Thus and are fixed. Let be the solution for the reference case where all of zone 3 is amalgamated to a single node. By the connectedness assumption, exists and is unique up to an overall shift. Let with the solution for the true zone 3, subtracting the single number from each element of . Then
| (36) | |||||
| (37) |
By the connectedness of zone 1, is invertible modulo overall shifts, on the subspace such that the sum of the components is zero. We have taken care of overall shifts by fixing a node of zone 1 to be at height 0. The sum of the components of is automatically zero, because taking the sum of (36) over components in zone 1, gives . So
| (38) |
Similarly, by connectedness of the union of zones 1 and 2, and substituting the above,
| (39) |
Thus the desired answer is
| (40) |
Thus by taking norms throughout (for example the weighted sum and the corresponding operator norm), we obtain a bound on the changes to the levels on zone 1 in terms of a bound on the changes to the levels on the part of zone 3 connecting directly to zone 2:
| (41) |
The latter is unknown in general, but the formula gives some idea of how much the levels change on zone 1 on incorporating more detail about zone 3. In particular, if zone 1 is well connected in the sense that is not large, and zones 1 and 2 are well connected in the sense that is not large then is not very sensitive to changes to the levels in zone 3.
An alternative to fixing the height of a node in zone 1 is to consider height vectors as equivalent if they differ by an overall shift and use a norm that pays attention only to height differences, e.g. .
Balanced iff maximally incoherent
If then so is constant on connected components, so . Conversely, if then is constant on connected components, so .
Note that it follows that maximally incoherent networks have no basal nodes (more precisely, any basal node is connected to no other nodes).
Normal with all eigenvalues real implies maximally incoherent
A normal matrix can be written as for some unitary matrix , where is the diagonal matrix of the eigenvalues of (repeated according to multiplicity). Then (using for the complex conjugate of )
| (42) | |||||
| (43) |
But and hence is real so we can take the complex conjugate of the second equation and deduce that
| (44) |
From this we see that if all the eigenvalues are real then . Then from the preceding item, .
Maximal coherence implies normality zero
If is maximally coherent then the level difference for each edge is so, arranging the nodes in order of height, the matrix is upper triangular with zero diagonal. It follows that all its eigenvalues are 0. Hence .
Stability of contagion processes
For , we have
| (45) |
using the induced operator-norm on , so
| (46) |
But for any operator-norm on , as (31). So if then as .
In the other direction, we need theory for non-negative matrices , e.g. (7). A node in a directed graph is recurrent if there is a cycle through it. Two recurrent nodes communicate if there is a cycle through both. The set of recurrent nodes can be decomposed into communicating classes, subsets in which each pair of nodes communicate and between which no pair of nodes communicate. The eigenvalues of consist of the eigenvalues of its restrictions to each communicating class and an eigenvalue 0 for each non-recurrent node. The period of a communicating class is the highest common factor of the lengths of all cycles in it. The communicating class can be decomposed into cyclic classes, whose nodes can only be reached from each other in a multiple of steps. They can be labelled so that one can get from to only in a number of steps congruent to modulo .
On each cyclic class , the restriction of is irreducible and aperiodic. So by Perron-Frobenius theory (7) it has a simple positive eigenvalue with positive eigenvector, and the remaining eigenvalues satisfy . Throughout this item, we consider left eigenvectors because we are interested in the action of on row-vectors . The eigenvalues of on the cyclic classes of are related as follows. If with supported on and non-zero, then is supported on and , so either is an eigenvector for on with the same eigenvalue or it is zero. If then so . Thus have the same eigenvalues apart from possible 0s. If the cyclic classes have different sizes, eigenvalues 0 must occur for all but the smallest ones.
From the non-zero eigenvalues of we deduce that the non-zero eigenvalues of are the (complex) roots of as follows. Take an eigenvector on for . Let be any root of . Then is an eigenvector of with eigenvalue , where the components in the vector are grouped according to the cyclic classes . So the eigenvalues of are the roots of the non-zero eigenvalues of , augmented by 0s. The eigenvectors of can be extended to eigenvectors of on the whole network with the same eigenvalue.
If is positive on some node of a cyclic class of a communicating class then by Perron-Frobenius theory,
| (47) |
for some , where is the Perron-Frobenius eigenvector on and its eigenvector. Furthermore . Including the rest of the edges,
| (48) |
We say a communicating class is “key” if its . There is always at least one such. Thus if is positive on some node of a key communicating class, then, combining with [46] and [48],
| (49) |
Similarly, if is positive on a node leading to a key communicating class then in finitely many steps is positive on some node of that class and hence the same result follows.
Other dynamics
The context in which trophic coherence was first proposed (16) is that of Lotka-Volterra dynamics for populations of species in an ecosystem. This is somewhat difficult to treat because if quantifies how much one species eats of another this does not give a complete specification of the population dynamics. But as in (16), one can propose
| (50) |
where is a natural birth or death rate (according to sign) for species , the negative sum accounts for species being eaten, the positive sum accounts for the enhancement of population of species from what it eats, with an efficiency factor , and the final term accounts for effects of intraspecies competition not included in cannibalism (). Write it in the form
| (51) |
where stands for the vector with components .
One first question is whether this has any positive equilibria. The equilibria are given by choosing any subset of species to be extinct and the rest to satisfy where the rows and columns corresponding to extinct species have been deleted. To be physical the remaining components of must all be positive.
Given a positive equilibrium , possibly of a subsystem given by deleting extinct species, a second question is whether it is stable. The linearised equations for deviations from an equilibrium are
| (52) |
So even if we know , the linearised equations are not completely determined because we need to know the equilibrium .
Similarly, economic dynamics can be proposed on supply networks (26) and the question arises whether there is a relation between stability and trophic coherence.
Ensemble relation of normality to incoherence
It is possible to relate trophic coherence with various other topological features by considering ensembles of random graphs (18). The ‘coherence ensemble’ is the set of all unweighted, directed networks with given in- and out-degree sequences and given trophic coherence. For example, using the standard definition of trophic incoherence , the expected value of the spectral radius in the coherence ensemble is
| (53) |
where
| (54) |
(and we use a bar to represent coherence-ensemble expectation). Here, is the expected trophic incoherence in the ‘basal ensemble’, and is the branching factor, but for current purposes we need not discuss these magnitudes in detail. In previous work the trophic coherence was measured with the incoherence parameter , which corresponds to the standard deviation over trophic differences when the average trophic difference is . Using the new definition of levels we are proposing here, the equivalent of this magnitude is
| (55) |
as given in the main text.
We note that the ratio between the expected spectral radius for a given coherence, , and the value corresponding to a maximally incoherent network,
| (56) |
depends only on trophic coherence:
| (57) |
In the main text we measure normality with
| (58) |
A normal network (if unweighted) is, as described in the main text, a balanced network, which is maximally incoherent (). In this case, we have . On the other hand, the greatest deviation from normality is achieved when for all , which is the case of maximally coherent networks (). For networks in the coherence ensemble with , we postulate that
| (59) |
which amounts to assuming that the distribution of eigenvalues of within the spectral radius does not depend on trophic coherence. This argument uses (i) , which in turn is the sum of the eigenvalues of , (ii) for normal the eigenvalues of are precisely the squares of the absolute values of the eigenvalues of , and (iii) normality is almost equivalent to maximal incoherence, as already discussed. Combining this expression with Eqs. [55], [57] and [58], we have an approximate expression for the expected normality in the coherence ensemble:
| (60) |
Figure 11 in the main text shows against for our set of empirical networks, alongside Eq. [60]. The empirical values fall fairly close to the ensemble expectations, with high coherence corresponding to a maximal non-normality, and incoherence being associated with greater normality. In many cases the real networks are somewhat less normal than the ensemble prediction. This might be because these are relatively small networks in which statistical fluctuations play a large role, and at intermediate values of trophic coherence there are more ways of being non-normal than normal.
Ensemble relation with scaled spectral radius
Using the results for the coherence ensemble again, in particular Eqns [57] and [55], we obtain that
| (61) |
Here, no assumption on the distribution of the eigenvalues of is required, simply the fact that for maximally incoherent networks.
The fit in Figure 12 is again reasonable.
Maximal incoherence implies cycles
A maximally incoherent network is balanced. Make a measure-preserving dynamical system in continuous time by converting each edge to a tube of volume of incompressible fluid with flow rate from to , splitting the resulting flow into in any way between the out-edges of consistent with their weights. If none of the fluid originally in tube comes back to that tube then after time , tube has ejected a volume of fluid that has to fit in the volume of the other tubes. But that is finite, so for large enough we get a contradiction. Hence there is a cycle through . So each edge of a maximally incoherent network is on a cycle.
One could allow the nodes to have volume too. The same argument works for infinite networks, by choosing the volumes to have a finite sum.
Zeta function
The zeta function of the main text is a weighted version of the Bowen-Lanford zeta function (described in section 3.1 of (30)). It can be related to the prime cycles, those which are not repetitions of a shorter cycle. We consider two prime cycles to be the same if they differ only by a cyclic permutation. We denote by the set of prime cycles. The formula is
| (62) |
where is the length of and its weight.
Here is a proof of the identity (cf. (30)).
| (63) |
because every cycle is a repetition of some prime cycle , say times, its weight is and there are cyclic permutations of it. The last expression is , concluding the proof.
Eq. [62] can be reduced to one in terms of “elementary cycles”, those which do not repeat a node before closing. They are prime and for a finite network there are only finitely many of them. The formula is
| (64) |
where the sum is over non-empty collections of disjoint elementary cycles. This provides a clean case of Cvitanovic’s cycle expansion (3).
To prove [64], use and the formula
| (65) |
for an matrix , where is the group of permutations of and is the sign of the permutation ( if can be written as an even number of transpositions, for an odd number). For , the only permutations for which the product in [65] is non-zero are those which can be written as a product of disjoint cyclic permutations corresponding to elementary cycles of period at least 2 in the network and the identity permutation on the remaining nodes. The contribution of a collection (possibly empty) of disjoint elementary cycles of period at least 2 is
| (66) |
where is the set of nodes not in . If there are no self-edges then for all and there are no cycles of period 1, so adding in the case of the empty collection, we obtain [64] when there are no self-edges.
If there are some self-edges then expand out [66] to
| (67) |
where the sum is over collections of disjoint elementary cycles formed by adding any 1-cycles to , including the case of adding no 1-cycles. Lastly, the contribution of the identity permutation is
| (68) |
where the sum is over non-empty collections of disjoint 1-cycles. Adding together [67] and [68], we obtain the result [64] for the general case.