]Now at Korea Astronomy and Space Science Institute, Daejeon 34055, Republic of Korea
Axion Dark Matter Search around 6.7 eV
Abstract
An axion dark matter search with the CAPP-8TB haloscope is reported. Our results are sensitive to axion-photon coupling down to the QCD axion band over the axion mass range between 6.62 and 6.82 eV at a 90% confidence level, which is the most sensitive result in the mass range to date.
Precision cosmological measurements strongly favor the standard model of Big Bang cosmology where about 85% of the matter in the Universe is cold dark matter (CDM) PLANCK . However, CDM itself is beyond the standard model of particle physics (SM), and accordingly the nature of about 85% of the matter in the Universe is still unknown to date. One of the most promising CDM candidates is the axion AXION , provided its mass is light enough, above 1 eV CDM_LOW and below 3 meV SN1987 . The axion is the result of the breakdown of a new symmetry which was proposed by Peccei and Quinn PQ to solve the strong problem in the SM strongCP . A consequence of the axion production mechanisms in the early Universe CDM_LOW ; AXION_PROD2 ; AXION_PROD3 ; AXION_PROD4 is that the axion mass range is very broad: the range mentioned above is the optimum for CDM. On the other hand, the open axion mass range can be much broader according to more recent works AXION_PROD5 .
The axion haloscope search proposed by Sikivie sikivie involves the resonant conversion of axions to photons in a microwave cavity permeated by a static magnetic field. The conversion power corresponding to the axion signal should be enhanced when the axion mass matches the resonant frequency of the resonator mode , . This makes the axion haloscope one of the most promising methods for axion dark matter searches in the microwave region which approximately fits the CDM region. The resonated power to be detected as the axion signal in SI units is as
| (1) |
where is the axion-photon coupling strength. The two most popular benchmark models are Kim-Shifman-Vainshtein-Zakharov (KSVZ) KSVZ for axions that couple to beyond the SM heavy quarks, and Dine-Fischler-Srednicki-Zhitnitskii (DFSZ) DFSZ for axions that couple to the SM quarks and leptons, at tree levels. GeV/cm3 is the local dark matter density, , and is energy stored in a magnetic field over the resonator volume , where is a static magnetic field provided by magnets in the axion haloscopes. The resonator-mode-dependent form factor whose general definition can be found in Ref. EMFF_BRKO and loaded quality factor are also shown in Eq. (1), where is the unloaded quality factor of the resonator mode and denotes the resonator mode coupling to the load. Assuming the axions have an isothermal distribution, the signal power given in Eq. (1) would then distribute over a boosted Maxwellian shape with an axion rms velocity of about 270 km/s and the Earth rms velocity of 230 km/s with respect to the galaxy frame AXION_SHAPE , respectively, which is the model adopted in this Letter.
Here, we report an axion dark matter search with the CAPP-8TB haloscope at the Institute for Basic Science (IBS) Center for Axion and Precision Physics Research (CAPP) CAPP . The 8TB stands for our solenoid specifications, the central magnetic field of 8 T and the relatively Big bore of 165 mm.
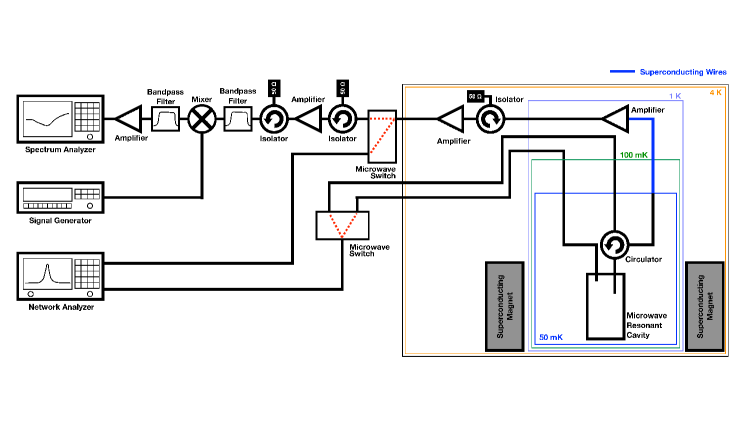
The CAPP-8TB haloscope has a tunable copper cylindrical cavity as a resonator, a cryogen-free NbTi superconductor solenoid AMI , and a typical heterodyne receiver chain equipped with a state-of-the-art High-Electron-Mobility Transistor (HEMT) LNF-LNC0.6_2A LNF as the first amplifier. The experiment maintains the physical temperature of the cavity at about 47 mK using a cryogen-free dilution refrigerator BF-LD400 BlueFors . The details of the CAPP-8TB apparatus will be discussed in the coming publication 8TBLong1 . Here we provide an overview shown in Fig. 1.
Our cavity is a 3.47 L copper cylinder whose inner diameter and height are 134 and 246 mm, respectively. The frequency tuning mechanism is comprised of a fully alumina based tuning rod system, a locomotive shaft to link the tuning rod axle and a rotational stepper motor. The motor is operated at room temperature, and the link between the locomotive shaft and the motor is achieved using Carbon Fiber Reinforced Polymer (CFRP) tubes. All the rotational axles in the cavity and the tuning mechanism systems are supported by ball bearings to minimize friction in the experiment. We found that the locomotive frequency tuning mechanism, which we developed in this research, does not introduce any significant heat whenever we tune the resonant frequencies of the cavity. This eliminates dead time between the cavity property measurement and power measurement. The quasi-TM010 (QTM010) modes of the cavity, which return the best form factors for axion haloscope searches with cylindrical geometry, are tuned by rotating the frequency tuning rod system. A linear stepper motor operated at room temperature and an antenna are linked with CFRP tubes to adjust between 1.8 and 2.0. A fixed antenna minimally coupled to the cavity is also employed. The values of the QTM010 modes were obtained over the frequency range between 1.60 and 1.65 GHz; they were about 30,000. Based on the values of the QTM010 modes, the discrete frequency step was chosen to be less than half of the smallest cavity linewidth, i.e., 20 kHz. The form factors of the QTM010 modes were numerically evaluated with the magnetic field map of the magnet and the electric field maps of the QTM010 modes from simulations CST ; COMSOL , and they are about 0.52 over the frequency range. The field map of the magnet also returned a of 7.3 T over the cavity volume.
Our receiver chain consists of a single data acquisition channel. As shown in Fig. 1, power from the cavity goes through the circulator, the first HEMT amplifier, and the other following microwave components, and is then measured by a spectrum analyzer at the end. Cavity parameters, , , and are measured with a network analyzer by toggling microwave switches. Having maintained the physical temperature of the first HEMT amplifier, the gain of the receiver chain is
| (2) |
where and are the power measured by the CAPP-8TB haloscope with cavity temperatures of 50 mK () and 200 mK (), respectively, and is the Boltzmann constant and is the resolution bandwidth (RBW). We kept the physical temperature of the first HEMT amplifier as cold as possible by attaching it to the 1 K stage H_HEMT as shown in Fig. 1, which results in a physical temperature of about 1.2 K. The measured gains are about 132 dB taking into account all the attenuation in our receiver chain, over the frequency range between 1.60 and 1.65 GHz. The noise temperatures of the receiver chain were obtained using the background parameterization discussed below.

The signal-to-noise ratio (SNR) in this work is defined by the axion signal power in Eq. (1) with the coupling , where is the standard KSVZ axion coupling with the neutral heavy quark QCD_AXION , thus is
| (3) |
according to the radiometer equation DICKE , where and are the noise power and its fluctuation, respectively. The coupling meets the QCD axion QCD_AXION , is the number of power spectra, is the system noise temperature, which is a sum of the noise temperatures of the cavity and the receiver chain, and is the axion signal window, which is about 5 kHz for the axion masses considered in this Letter. We acquired data from September 25 to November 11 in 2019 including a week of system maintenance. A total of 2,501 resonant frequencies were scanned for a search window of 50 MHz, with frequency steps of 20 kHz. In every resonant frequency, we collected a total 12,000 power spectra with an RBW of 20 Hz, and averaged them to reach an SNR in Eq. (3) of about 4, which resulted in an SNR of 5 or higher at the end.
Our overall analysis basically follows the previous axion haloscope search analyses haloscope4 ; HAYSTAC . We took power spectra over a frequency span of 60.48 kHz and an RBW of 20 Hz. They were chosen to maximize the SNR with our frequency steps of 20 kHz and our spectrum analyzer performance, respectively. The five nonoverlapping frequency bins in the individual power spectra are then merged so that the RBW becomes 100 Hz from 20 Hz. The power spectra with the RBW of 100 Hz went through a filtering procedure similar to the one developed by the Haloscope at Yale Sensitive to Axion CDM (HAYSTAC) HAYSTAC , where the background was subtracted with a five-parameter fit developed by the Axion Dark Matter eXperiment (ADMX) haloscope4 . The efficiency of the filtering was estimated to be 99.7% using the simulated axion experiments described below. This background parameterization itself was also used to obtain system noise temperature from the total power and the gain calculated in Eq. (2), as mentioned earlier. It was about 1 K over the frequency range considered in this Letter, which is consistent with the first HEMT amplifier specifications LNF . The five nonoverlapping frequency bins in each background-subtracted power spectrum were again merged so that the RBW became 500 Hz from 100 Hz. We found the signal efficiency with the misalignment between the axion signal and an RBW of 500 Hz was 99.9%. All the power spectra were then combined as a single power spectrum, taking into account the overlaps among the power spectra. From the combined spectrum, we constructed our “grand power spectrum” by co-adding haloscope4 10 adjacent 500 Hz power spectral lines that possess 99.9% signal power if axions are there, where each power spectral line was weighted according to the axion signal shape HAYSTAC . The grand power spectrum was further normalized by which was also weighted according to the axion signal shape HAYSTAC . Using 5,000 simulated axion haloscope search experiments with CAPP-8TB backgrounds over a search window of 50 MHz and axion signals at a particular frequency, the correlation coefficient matrices between the frequency bins participating in the co-adding were fully constructed and incorporated into the for the first time in axion haloscope searches. The correlations were induced from the background subtraction haloscope4 ; HAYSTAC ; ACTION . After employing the correlation coefficient matrices, Fig. 2 (a) shows that the distribution of the normalized power excess from all frequency bins in the normalized grand power spectrum from the CAPP-8TB experiment followed the standard Gaussian distribution, i.e., the width of the triangles is unity. The simulated experiments also resulted in distributions shown as inverted triangles, from all the frequency bins, and solid circles from a particular frequency bin where we put the simulated axion signals. These are shown as (b), (c), and (d) in Fig. 2, respectively. Figure 2 (b) was obtained after the background subtraction using the simulation input background functions, i.e., perfect fit. (c) and (d) were obtained with a five-parameter fit. (d) incorporates the correlations between the co-adding frequency bins, and thus follows the standard Gaussian, while (c) does not, as reported in Refs. haloscope4 ; HAYSTAC ; ACTION . The SNR of the CAPP-8TB experiment in each frequency bin corresponding to the grand power spectrum bin was also calculated. From the distributions of solid circles in Figs. 2 (b), (c), and (d), the five-parameter fit efficiencies with and without the correlation coefficient matrices turn out to be about 90.7% and 84.0%, respectively. The SNR degradation from the five-parameter fit, the filtering for the individual power spectrum, and the misalignment with the RBW of 500 Hz was reflected in the final SNR.

We found 36 grand power spectrum bins that exceeded a threshold of 3.718. The 36 excess frequency bins were re-scanned with sufficient high statistics and no bins survived. Hence, we set the 90% upper limits of for eV. Figure 3 shows the excluded parameter space at a 90% confidence level from the CAPP-8TB experiment. Our result is the most sensitive in the relevant axion mass ranges to date.
In summary, we reported an axion dark matter search using the CAPP-8TB haloscope. The CAPP-8TB experiment incorporated a developed locomotive frequency tuning mechanism which generated negligible friction and also improved the SNR in the axion haloscope search analysis procedure. With this improvement, the CAPP-8TB experiment achieved the results sensitive to axion-photon coupling down to the QCD axion band QCD_AXION over the axion mass range between 6.62 and 6.82 eV at a 90% confidence level, which is the most sensitive result in the mass range to date. We expect to run the CAPP-8TB haloscope with a quantum-noise-limited superconducting amplifier and superconducting cavity CAPP to reach the standard KSVZ axion coupling in the near future.
Acknowledgements.
This work was supported by IBS-R017-D1-2020-a00.References
- (1) P. A. R. Ade et al. (Planck Collaboration), Astron. Astrophys. 594, A13 (2016).
- (2) S. Weinberg, Phys. Rev. Lett. 40, 223 (1978); F. Wilczek, Phys. Rev. Lett. 40, 279 (1978).
- (3) J. Preskill, M. B. Wise, and F. Wilczek, Phys. Lett. B 120, 127 (1983); L. F. Abbott and P. Sikivie, Phys. Lett. B 120, 133 (1983); M. Dine and W. Fischler, Phys. Lett. B 120, 137 (1983).
- (4) John Ellis and K. A. Olive, Phys. Lett. B 193, 525 (1987); Georg Raffelt and David Seckel, Phys. Rev. Lett. 60, 1793 (1988); Michael S. Turner, Phys. Rev. Lett. 60, 1797 (1988); Hans-Thomas Janka, Wolfgang Keil, Georg Raffelt, and David Seckel, Phys. Rev. Lett. 76, 2621 (1996); Wolfgang Keil, Hans-Thomas Janka, David N. Schramm, Gnter Sigl, Michael S. Turner, and John Ellis, Phys. Rev. D 56, 2419 (1997).
- (5) R. D. Peccei and H. R. Quinn, Phys. Rev. Lett. 38, 1440 (1977).
- (6) G. ’t Hooft, Phys. Rev. Lett, 37, 8 (1976); G. ’t Hooft, Phys. Rev. D 14, 3432 (1976) [Erratum-ibid. D 18, 2199 (1978)]; J. H. Smith, E. M. Purcell, and N. F. Ramsey, Phys. Rev. 108, 120 (1957); W. B. Dress, P. D. Miller, J. M. Pendlebury, P. Perrin, and N. F. Ramsey, Phys. Rev. D 15, 9 (1977); I. S. Altarev et al., Nucl. Phys. A 341, 269 (1980).
- (7) R. L. Davis, Phys. Rev. D 32, 3172 (1985); R. L. Davis, Phys. Lett. B 180, 225 (1986); D. Harari and P. Sikivie, Phys. Lett. B 195, 361 (1987); A. Vilenkin and T. Vachaspati, Phys. Rev. D 35, 1138 (1987); R. L. Davis and E. P. S. Shellard, Nucl. Phys. B 324, 167 (1989); A. Dabholkar and J. M. Quashnock, Nucl. Phys. B 333, 815 (1990); R. A. Battye and E. P. S. Shellard, Nucl. Phys. B 423, 260 (1994); R. A. Battye and E. P. S. Shellard, Phys. Rev. Lett. 73, 2954 (1994); M. Yamaguchi, M. Kawasaki, and J. Yokoyama, Phys. Rev. Lett. 82, 4578 (1999); S. Chang, C. Hagmann, and P. Sikivie, Phys. Rev. D 59, 023505 (1999); C. Hagmann, S. Chang, and P. Sikivie, Phys. Rev. D 63, 125018 (2001).
- (8) D. H. Lyth, Phys. Lett. B 275, 279 (1992); M. Nagasawa and M. Kawasaki, Phys. Rev. D 50, 4821 (1994).
- (9) A. S. Sakharov and M. Y. Khlopov, Yad. Fiz. 57, 514 (1994) [Phys. At. Nucl. 57, 485 (1994)]; A. S. Sakharov, D. D. Sokoloff, and M. Y. Khlopov, Yad. Fiz. 59N6, 1050 (1996) [Phys. At. Nucl. 59, 1005 (1996)]; M. Y. Khlopov, A. S. Sakharov, and D. D. Sokoloff, Nucl. Phys. B, Proc. Suppl. 72, 105 (1999).
- (10) Fuminobu Takahashi, Wen Yin, and Alan H. Guth, Phys. Rev. D 98, 015042 (2018); Peter W. Graham and Adam Scherlis, Phys. Rev. D 98, 035017 (2018).
- (11) P. Sikivie, Phys. Rev. Lett. 51, 1415 (1983); Phys. Rev. D 32, 2988 (1985).
- (12) J. E. Kim, Phys. Rev. Lett. 43, 103 (1979); M. A. Shifman, A. I. Vainshtein, and V. I. Zakharov, Nucl. Phys. B 166, 493 (1980).
- (13) A. R. Zhitnitskii, Yad. Fiz. 31, 497 (1980) [Sov. J. Nucl. Phys. 31, 260 (1980)]; M. Dine, W. Fischler, and M. Srednicki, Phys. Lett. B 140, 199 (1981).
- (14) B. R. Ko, H. Themann, W. Jang, J. Choi, D. Kim, M. J. Lee, J. Lee, E. Won, and Y. K. Semertzidis, Phys. Rev. D 94, 111702(R) (2016).
- (15) Michael S. Turner, Phys. Rev. D 42, 3572 (1990).
- (16) Yannis K. Semertzidis et al., arXiv:1910.11591
- (17) www.americanmagnetics.com
- (18) www.lownoisefactory.com
- (19) www.bluefors.com
- (20) J. Choi et al., in preparation.
- (21) www.cst.com
- (22) www.comsol.com
- (23) The HEMT amplifier generates heat power about 14 mW. Applying such heat power to the 100 mK stage or below does not let us operate the dilution fridge properly.
- (24) S. L. Cheng, C. Q. Geng, and W.-T. Ni, Phys. Rev D 52, 3132 (1995).
- (25) R. H. Dicke, Rev. Sci. Instrum. 17, 268 (1946).
- (26) C. Hagmann et al., Phys. Rev. Lett. 80, 2043 (1998); S. J. Asztalos et al., Phys. Rev. D 64, 092003 (2001).
- (27) B. M. Brubaker et al., Phys. Rev. Lett. 118, 061302 (2017); B. M. Brubaker, L. Zhong, S. K. Lamoreaux, K. W. Lehnert, and K. A. van Bibber, Phys. Rev D 96, 123008 (2017).
- (28) J. Choi, H. Themann, M. J. Lee, B. R. Ko, and Y. K. Semertzidis, Phys. Rev D 96, 061102(R) (2017).
- (29) S. DePanfilis, A. C. Melissinos, B. E. Moskowitz, J. T. Rogers, Y. K. Semertzidis, W. U. Wuensch, H. J. Halama, A. G. Prodell, W. B. Fowler, and F. A. Nezrick, Phys. Rev. Lett. 59, 839 (1987); W. U. Wuensch, S. De Panfilis-Wuensch, Y. K. Semertzidis, J. T. Rogers, A. C. Melissinos, H. J. Halama, B. E. Moskowitz, A. G. Prodell, W. B. Fowler, and F. A. Nezrick, Phys. Rev. D 40, 3153 (1989).
- (30) C. Hagmann, P. Sikivie, N. S. Sullivan, and D. B. Tanner, Phys. Rev. D 42, 1297 (1990).
- (31) S. J. Asztalos et al., Astrophys. J. Lett. 571, L27 (2002); S. J. Asztalos et al., Phys. Rev. D 69, 011101(R) (2004); S. J. Asztalos et al., Phys. Rev. Lett. 104, 041301 (2010).
- (32) N. Du et al. (ADMX Collaboration), Phys. Rev. Lett. 120, 151301 (2018).
- (33) C. Boutan et al. (ADMX Collaboration), Phys. Rev. Lett. 121, 261302 (2018).
- (34) L. Zhong et al., Phys. Rev. D 97, 092001 (2018).
- (35) D. Alesini et al., Phys. Rev. D 99, 101101(R) (2019).