Peter Pan Disks: Long-lived Accretion Disks Around Young M Stars
Abstract
WISEA J080822.18-644357.3, an M star in the Carina association, exhibits extreme infrared excess and accretion activity at an age greater than the expected accretion disk lifetime. We consider J0808 as the prototypical example of a class of M star accretion disks at ages Myr, which we call “Peter Pan” disks, since they apparently refuse to grow up. We present four new Peter Pan disk candidates identified via the Disk Detective citizen science project, coupled with Gaia astrometry. We find that WISEA J044634.16-262756.1 and WISEA J094900.65-713803.1 both exhibit significant infrared excess after accounting for nearby stars within the 2MASS beams. The J0446 system has likelihood of Columba membership. The J0949 system shows likelihood of Carina membership. We present new GMOS optical spectra of all four objects, showing possible accretion signatures on all four stars. We present ground-based and TESS lightcurves of J0808 and 2MASS J0501-4337, including a large flare and aperiodic dipping activity on J0808, and strong periodicity on J0501. We find Pa and Br emission indicating ongoing accretion in near-IR spectroscopy of J0808. Using observed characteristics of these systems, we discuss mechanisms that lead to accretion disks at ages Myr, and find that these objects most plausibly represent long-lived CO-poor primordial disks, or “hybrid” disks, exhibiting both debris- and primordial-disk features. The question remains: why have gas-rich disks persisted so long around these particular stars?
1 Introduction
Primordial disks around solar-mass stars have been shown to dissipate rapidly over time in Spitzer disk surveys. The From Molecular Cores to Planet-Forming Disks (c2d) project observed 188 classical and weak T Tauri stars (CTTS; WTTS) spanning spectral types G5-M5 in the Taurus, Lupus, Ophiuchus, and Chamaeleon star-forming regions (Padgett et al., 2006) and found that no studied weak-lined T Tauri stars (WTTS) exhibited a disk beyond an age of 10 Myr (Wahhaj et al., 2010). The Formation and Evolution of Planetary Systems (FEPS) project surveyed approximately solar-mass () stars from ages 3 Myr to 3 Gyr and found that only of stars surveyed younger than 10 Myr exhibited a primordial disk, and only of stars surveyed between 10 and 30 Myr exhibited such a disk (Carpenter et al., 2009).
Studies of large young clusters and associations have also shown that disks around high-mass star disks dissipate more quickly than those around solar-mass stars (Carpenter et al., 2006). Pecaut & Mamajek (2016) performed a census of disks around K stars in the Scorpius-Centaurus complex and determined disk fractions for each component of Sco-Cen, finding full disk fractions of for the Myr Upper Scorpius association, for the Myr Upper Centaurus-Lupus (UCL) association, and for the Myr Lower Centaurus-Crux (LCC) association. Using these fractions, they inferred that the characteristic (-folding) timescale for primordial disk lifetimes around K-type stars was 4.7 Myr—that is, only 1/ of the primordial disks around K-type stars in this association have not dissipated in a 4.7-Myr span.
Given that K-type stars have higher primordial disk fractions than solar-type stars in the same associations, one might expect that M dwarf primordial disks would have an even longer lifetime. However, there is to date only one detailed study of M dwarf disks in only one association, the disk census of Upper Scorpius by Esplin et al. (2018). This study did find that the frequency of M dwarf primordial disks in Upper Sco is higher than the frequency of primordial disks around all earlier-type stars in the same association, which could indicate a longer disk lifetime; however, further studies of additional associations at different ages (e.g. a similar census of LCC and UCL) are needed to confirm that this is the case.
In contrast to the prevalence of M star and brown dwarf primordial disks in young associations, M dwarf debris disks are detected much less frequently than their counterparts around higher-mass stars. Debris disks are clouds of primarily rock and dust, thought to be a later stage of disk evolution than primordial disks (e.g. Hughes et al., 2018). The occurrence rate around field M dwarfs is , based on surveys with the Spitzer Space Telescope and the WISE All-Sky Catalog (Plavchan et al., 2005, 2009; Avenhaus et al., 2012). These systems are more commonly detected in younger systems; Forbrich et al. (2008) found significant 24m excess around 4.3% of M dwarfs in the 30-40 Myr cluster NGC 2547, while Binks & Jeffries (2017) found significant 22 m excess around of -Myr M dwarfs. These detection rates are still significantly lower than the detection rates of their earlier-type A-star counterparts (Greaves, 2010). While some argue that this could be due to the sensitivity of WISE, with dust material harder to detect due to the low intrinsic luminosity of the host stars (e.g. Heng & Malik, 2013), the low detection rate of debris disks around older M dwarfs could also indicate rapid clearing by stellar wind (e.g. Wyatt, 2008) or stellar activity (e.g. AU Mic; Grady et al. 2019, in prep).
The Disk Detective citizen science project (Kuchner et al., 2016), a joint program of NASA and the Zooniverse Project (Lintott et al., 2008), identifies circumstellar disk candidates in data from NASA’s WISE mission, via visual inspection of candidates in the AllWISE catalog. Silverberg et al. (2016) identified WISEA J080822.18-644357.3 (J0808), a disk candidate discovered by Disk Detective citizen scientists, as a likely member of the 45-Myr Carina association (Bell et al., 2015) based on its kinematics. J0808 exhibits a large fractional infrared luminosity (), surprising given its age, as such a high is typically only seen in primordial disks. Silverberg et al. (2016) initially characterized this as one of the oldest dM-type debris disk systems. Murphy et al. (2018) confirmed membership of J0808 in Carina based on its radial velocity and lithium absorption detected in optical spectroscopy, and noted broad, variable H emission indicative of active accretion, suggesting that the system is instead a gas-rich primordial disk. They also identified correlated variability in the W1 and W2 single-epoch photometry of the object consistent with a variable hot disk component, and listed three other systems from the literature that exhibited emission indicative of accretion (2MASS J0041353-562112, J02265658-5327032, and 2MASS J05010082-4337102, hereafter J0041, J0226, and J0501; Reiners, 2009; Boucher et al., 2016) in the Tucana-Horologium (THA), Columba (COL), and Carina (CAR) associations, which formerly made up the Great Austral Young Association (GAYA) complex (Torres et al., 2008). While these groups have all been thought to have ages Myr (Bell et al., 2015), recent work suggests that Carina may have an age closer to that of the -Myr Beta Pictoris Moving Group (Schneider et al., 2019). Flaherty et al. (2019) recently published ALMA observations of J0808, in which they detected continuum dust emission consistent with a third disk component (in addition to those identified in the WISE data), but did not detect cold CO gas.
In this paper, we discuss the characteristics of the known examples of a class of disk we name “Peter Pan” disks: disks around low-mass stars and brown dwarfs that exhibit characteristics of a gas-rich disk at unexpectedly high ages—that is, accretion disks that seem to “never grow up” (Barrie, 1904). In Section 2, we present identifications of four new examples of this phenomenon in two systems, based on astrometry and kinematic information from the second data release of Gaia. In Section 3, we summarize follow-up spectroscopy of these systems with Gemini/GMOS. In Section 4, we combine the observed photometry, Gaia astrometry, and GMOS spectra of these targets to assess their ages and accretion properties. In Section 5, we summarize our observations of the previously-known Peter Pan disks, including ground- and space-based high-cadence photometry and near-infrared spectroscopy. In Section 6, we present high-cadence optical photometry of J0808, which exhibits variability indicative of accretion as well as a high-amplitude classical flare, and J0501, which indicates strong periodicity and a classical flare. In Section 7, we present near-IR spectroscopy of J0808, which identifies the short-wavelength end of the W1/2 excess identified by Murphy et al. (2018) and shows variable accretion. In Section 8, we examine a possible definition of the class of Peter Pan disks, consider what other known systems might belong in this class, and discuss potential formation mechanisms for these systems. We summarize our findings in Section 9.
2 Two New Peter Pan Disk Systems
As part of our ongoing work to build a publicly-accessible database for Disk Detective through the Mikulski Archive for Space Telescopes at the Space Telescope Science Institute111Accessible through the portal at https://mast.stsci.edu., we cross-matched the Gaia DR2 catalog with the Disk Detective input catalog. Rather than exclusively using the matches provided in DR2, we projected objects in DR2 back to their expected WISE positions using the proper motion data in DR2, then found the nearest WISE source to that position. Our cross-match did not explicitly take into account the position of nearby objects in the Gaia data. We ran the results of this crossmatch through the BANYAN (Gagné et al., 2018) tool to identify potential new moving group members, specifically with an eye toward identifying new Peter Pan disks. This produced two late-type systems with a high probability of membership in a -Myr moving group, based on their parallax and proper motion from Gaia. WISEA J044634.16-262756.1 has a 96.9% likelihood of membership in the -Myr Columba association (COL). WISEA J094900.65-713803.1 has a 99.2% likelihood of membership in the Carina association. Note that these initial probabilities do not reflect radial velocity measurements, which we discuss below.
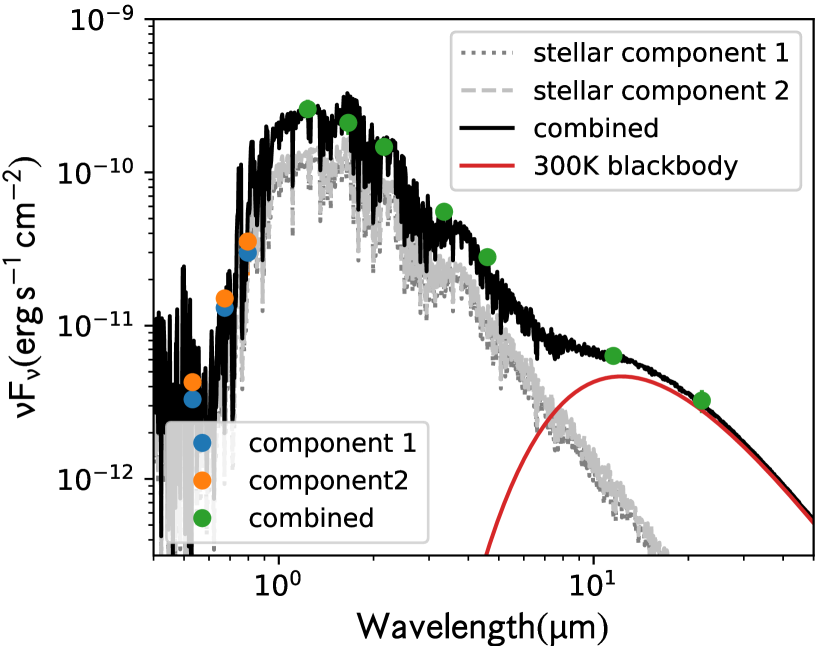
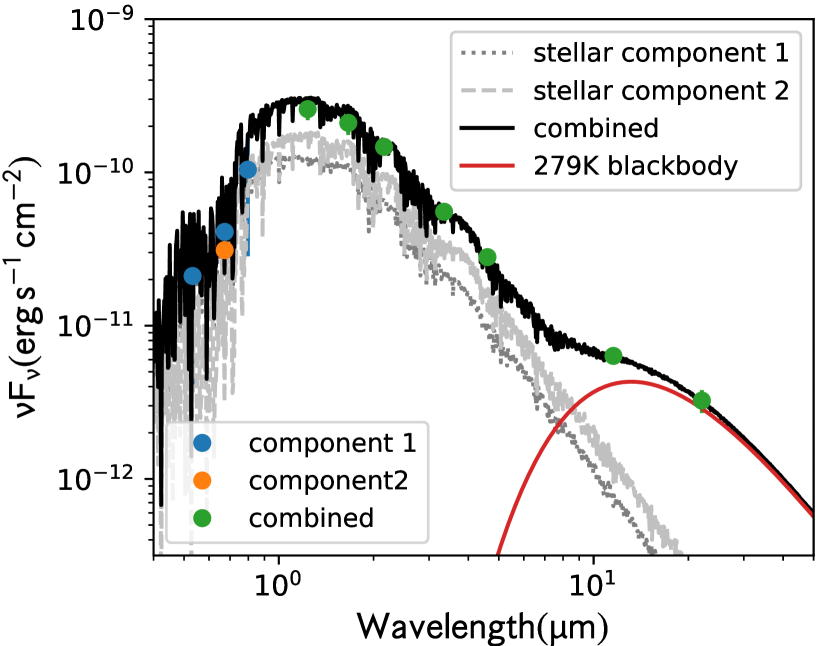
Each of these systems is an apparent visual double, based on data from Pan-STARRS DR1 and Gaia DR2. The two stars in J0446 have angular separation , while the two stars in J0949 have angular separation ; both of these separations are within the beam size of both 2MASS and WISE. To characterize these systems as a whole, we fit stellar models to the observed photometry for the systems, using the Gaia photometry for each component and the 2MASS/WISE photometry that blends both components. Three of the targets have Gaia photometry in all three bands (G, Bp, Rp), while J0949B only has G-band photometry. These initial fits to the spectral energy distributions (SEDs) of the systems indicated that both J0446 and J0949 exhibited significant excess at W3 and W4 after accounting for both stellar components. Additionally, BANYAN indicated that the two nearby targets were also possible moving group members. SED fits of the systems are shown in in Figure 1.
3 Follow-up Spectroscopy of New Peter Pan Disk Systems
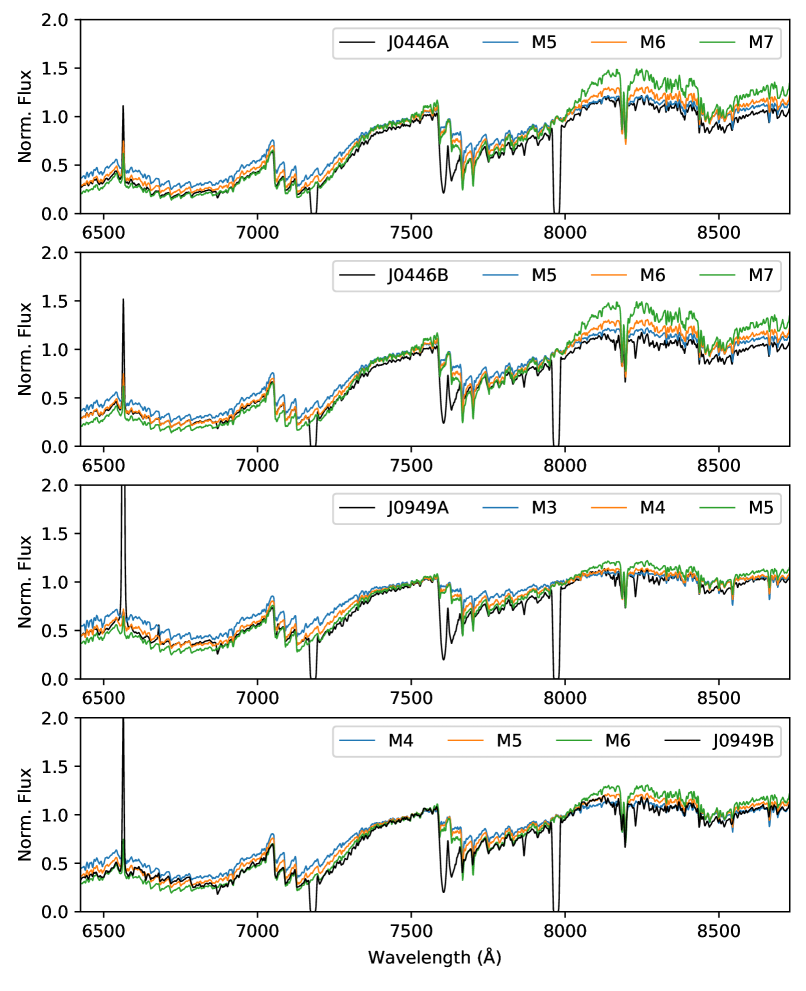
We obtained spectra of these two new candidate Peter Pan disk systems during 2018 November with the Gemini Multi-Object Spectrograph (GMOS-S) at the Gemini-South observatory through Program GS-2018B-FT-106 in queue mode, to check moving group memberships and further characterize the systems. We observed both objects in each apparent visual double. We acquired three spectra of each target in sequence to mitigate cosmic rays, using the longslit with the R831 grating centered at 7570 Å to achieve resolving power , with wavelength coverage of 6394-8736 Å. We used the GG455 filter to block second-order light. Quartz/halogen flats were taken after each set of science observations, and master arcs for the project were taken using Cu-Ar lamps on 2018 November 8. We used the flux standard LTT 1020, observed on 2018 October 3, to calibrate our result spectra. Exposure times ranged from 12-100 seconds, based on expected brightness, yielding spectra with SNR 14-25 at H. Spectra were reduced using version 2.16 of the Gemini package in PyRAF, using standard techniques. Table 3 lists the four components as J0446A, J0446B, J0949A, and J0949B, along with separate equatorial positions for each target, astrometric information, Gaia photometry, and data derived from the spectra. The spectra are plotted in Figure 2.
| Designation | J0446A | J0446B | J0949A | J0949B | References |
|---|---|---|---|---|---|
| R.A. (h:m:s) | 04:46:34.105362 | 04:46:34.249381 | 09:49:00.752604 | 09:49:00.441275 | 1 |
| DEC (d:m:s) | -26:27:56.83936 | -26:27:55.57007 | -71:38:02.94748 | -71:38:03.15884 | 1 |
| Separation (pc) | 2 | ||||
| Spectral Type | M6 | M6 | M4 | M5 | 2 |
| Group | COL | COL | CAR | CAR | 3 |
| EW[H] (Å) | 2 | ||||
| [H] (km s-1) | 2 | ||||
| aaRight ascension and declination are the stellar positions at epoch J2015.5, the Gaia reference epoch. | 2 | ||||
| EW[Li I 6707.8] (mÅ) | 2 | ||||
| Parallax (mas) | 1 | ||||
| (mas/yr) | 1 | ||||
| (mas/yr) | 1 | ||||
| Radial velocity () | 2 | ||||
| Excess ([W1]-[W3]) | 2 | ||||
| Excess ([W1]-[W4]) | 2 | ||||
| Stellar temperature | 4 | ||||
| Warm disk temperature (K) | 2 | ||||
| 2 | |||||
4 Analysis of New Peter Pan Disk Systems
4.1 Spectral types
We used the PyHammer package (Kesseli et al., 2017) to classify our four GMOS-S spectra. Given the proximity of the four targets to the Sun, we assumed solar metallicity for all four cases. We adopt spectral types of M6 for both components of J0446, and find that J0949 consists of an M4 and an M5. The four spectra, with comparison spectral standards, are shown in Figure 2.
4.2 Age estimates and radial velocity measurements
To confirm the membership of these specific objects in moving groups, we must measure the stellar heliocentric radial velocity (to ensure that its full kinematics match those of the group), and identify an independent age constraint.
We determined radial velocities for each of the four targets based on Gaussian fitting of four prominent lines (H, K I 7669, Na I 8183, and Ti I 8435) to determine their observed central wavelengths. Uncertainties for each measurement reflect the 68% confidence interval of the line profile as determined using emcee (Foreman-Mackey et al., 2013), the modest resolution of the spectrograph, and instrumental uncertainty due to telescope flexure across nights. These measurements are listed in Table 3. Within the uncertainties, the measured radial velocities are consistent with membership in their assigned moving groups.
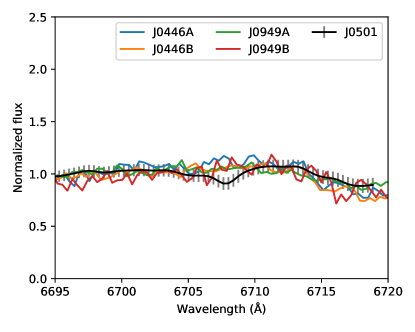
Figure 3 depicts the spectra for our four targets around the lithium feature at 6707.8 Å, along with the spectrum of J0501 (adopted from Boucher et al., 2016), degraded to the resolution and rebinned to the dispersion of our data. As seen in Figure 3, we do not detect clear evidence of lithium in our data, deriving upper limits of 0.11-0.25 Å. Lithium absorption is often used as an age indicator (Murphy et al., 2018, and references therein); these upper limits are consistent with ages 40-45 Myr and our moving group assignments.
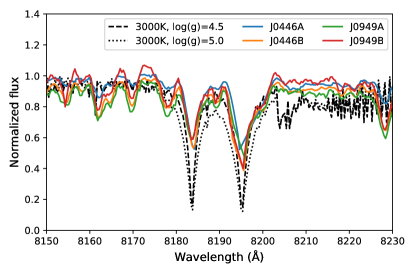
Another indicator of youth is the depth of the Na I doublet at 8200 Å which can be used to differentiate young cluster and moving group members from field stars and giants (Schlieder et al., 2012). The 8195 Å line of this feature falls on a bad pixel column in our data, making an equivalent width measure of the feature in our data unreliable. However, we can compare the observed line profiles of the 8183 Å line to stellar models to qualitatively assess the line. As seen in Figure 4, all four of our spectra are much shallower at 8183 Å than a BT-Settl (Baraffe et al., 2015) model of a main-sequence mid-M dwarf, suggesting that they have weaker gravity and are therefore younger than the typical field M dwarf.
4.3 H emission and accretion
Accretion of disk material from a circumstellar disk onto the host star is accompanied by excess continuum Balmer emission (e.g. Hartmann et al., 2016) and enhanced line emission (e.g. Muzerolle et al., 1998). - and -band photometry of these systems has not yet been observed, so we focus on line emission diagnostics. We identify H emission on all four of our candidates, as shown in Figure 5. We computed the equivalent width of each line via direct integration of the observed spectrum after continuum fitting. We list these widths, ranging from -110 Å EW[H] -10 Å, in Table 3.
Fang et al. (2009) proposed an equivalent width limit of Å for H for a mid-M accretor, with many classical T Tauri stars exceeding this bound. While J0446A and J0446B do not meet the Fang et al. (2009) limit, both J0949A and J0949B do. All four objects show an equivalent width larger in magnitude than the -7.56 angstroms exhibited by 2MASS J0501 (Boucher et al., 2016), but only J0949A approaches the -125 Å EW[H] -65Å values observed for J0808.
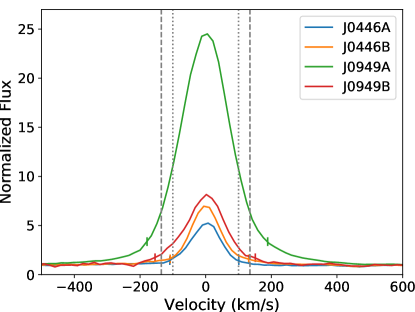
Following Murphy et al. (2018), we estimated the velocity width at one-tenth maximum by normalizing the line profile to a linear fit to the continuum at , and finding the numerical intercept of the line profile and the line (as shown in Figure 5). White & Basri (2003) adopt a criterion for accretion across all M-types, while Jayawardhana et al. (2003) adopt a for M5-M8 stars, and Natta et al. (2004) adopts a criterion for M6-M8.5 stars. We adopt the Jayawardhana et al. (2003) criterion for the three stars with spectral types M5-M6, and adopt the White & Basri (2003) criterion for J0949A, which has a spectral type out of this range. Based on these criteria, all four objects appear to be accreting. Table 3 lists widths for the four stars.
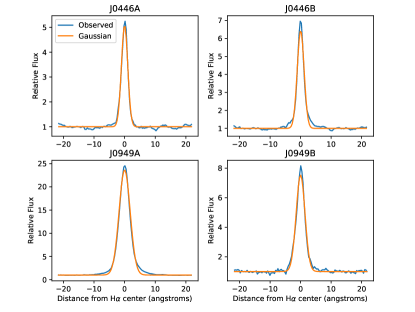
Asymmetry of the line profile can also indicate whether emission is due to accretion rather than stellar activity, as infalling material should have some velocity shift relative to the host star (e.g. Hartmann et al., 2016). We present the H profiles of the four targets in Figure 6, plotted against the best-fit Gaussian for each object to provide a symmetric reference to guide the eye. The line cores appear symmetric, once the asymmetric distribution of pixels across the line is accounted for. J0949B shows no obvious asymmetry. J0446A shows enhancement in the blue wing of the line compared to the red wing, though this may be due to the severe negative slope of the continuum in this range and imperfect continuum subtraction. Counter to this, J0949A exhibits an enhanced red wing of the profile compared to the blue wing. J0446B shows an asymmetric profile in the wings, similar to the asymmetric profile observed in 2MASS J05010082-4337102 (Boucher et al. 2016). None of the asymmetry observed here is to the degree of asymmetry exhibited by H in typical young CTTSs (e.g. Hartmann et al., 2016); while there is apparent qualitative asymmetry, it is not quantitatively significant.
We determined accretion rates using the Natta et al. (2004) relation (following Murphy et al., 2018; Boucher et al., 2016). Accretion rates (listed in Table 3) range from , suggesting lower limits on the mass accreted between and in the stellar lifetime. While the lower bound of this range is consistent with ongoing accretion for Myr, the upper bound suggests that accretion may have recently increased. However, these rates are likely higher than the true accretion rate, as the Natta et al. (2004) relation was calibrated on younger (and therefore higher-radius) stars (as noted by Murphy et al., 2018).
5 Observations of Known Peter Pan Disks
5.1 High-Cadence Optical Imaging
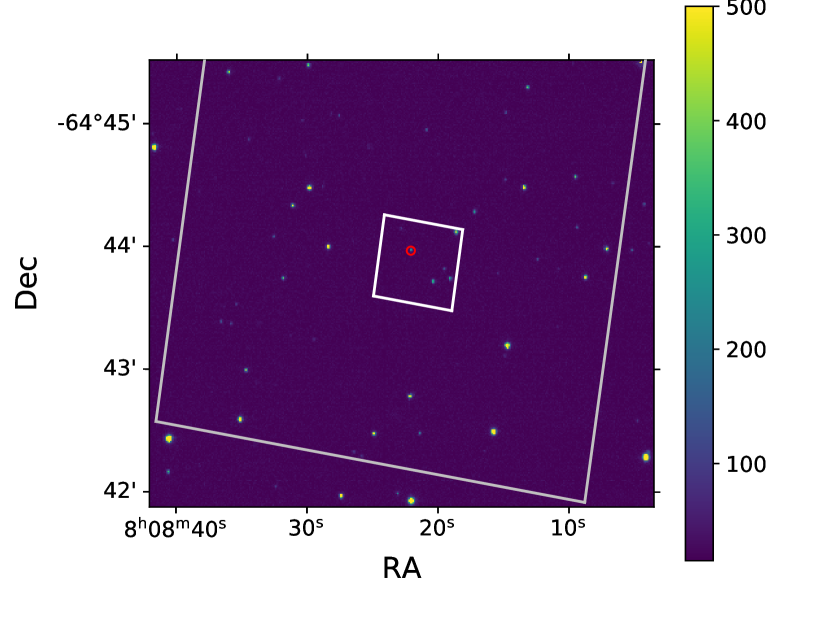
We obtained high-cadence optical photometry of J0808 over nine nights with the Tek2K CCD on the CTIO/SMARTS 0.9m telescope at Cerro Tololo Inter-American Observatory, from UT 2018 February 14-22, primarily to detect optical/UV flares (Lacy et al., 1976; Kowalski et al., 2013). Exposure times ranged 90-105 seconds exposures depending on sky transparency, to maximize signal-to-noise while maintaining as high a cadence as possible. We observed in the SDSS band to maximize contrast of the UV-bright flares with the underlying stellar photosphere while ensuring the faint source was detected in quiescence. To minimize time on-sky lost to readout, we observed in four-quadrant read-out, only exposing the inner pixels. Data were reduced using standard IRAF procedures, and cosmic rays were removed using the lacosmic function (van Dokkum, 2001). Relative differential photometric lightcurves were generated for each night using AstroImageJ (Collins et al., 2017). We used an ensemble of six stars in the field of view as comparison stars for the target. To ensure that these six stars were non-variable, we analyzed light curves produced by differential photometry of each comparison star compared to the others in the ensemble; all observations in the light curves of these comparison stars are within 5 of the light curve median ( of the light curve median). Typical photometric uncertainties of the target are on the order of 2%. An example image from the CTIO data is shown in Figure 7.
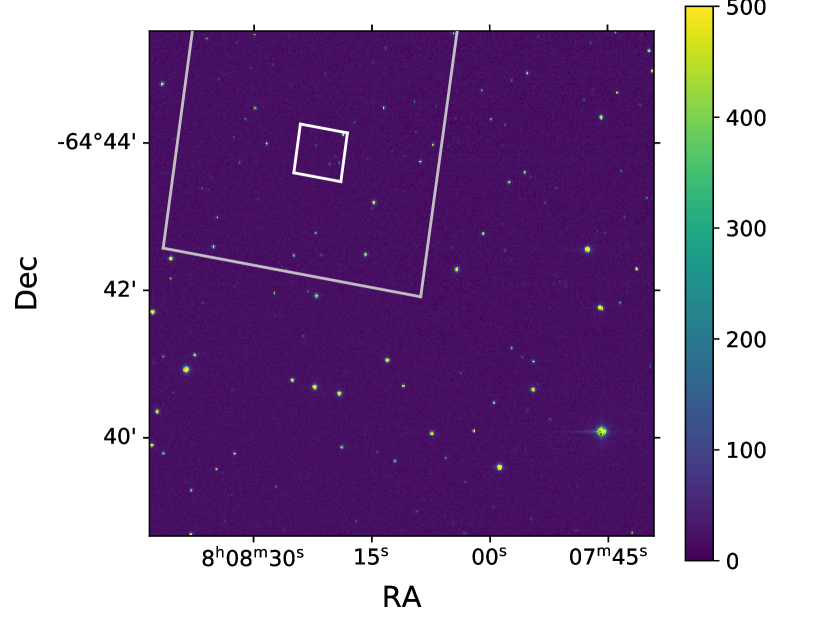
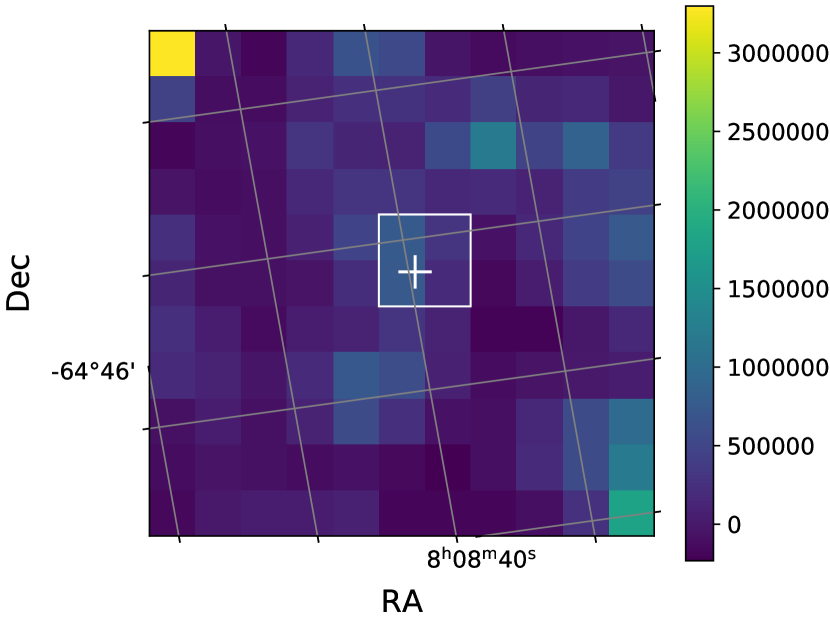
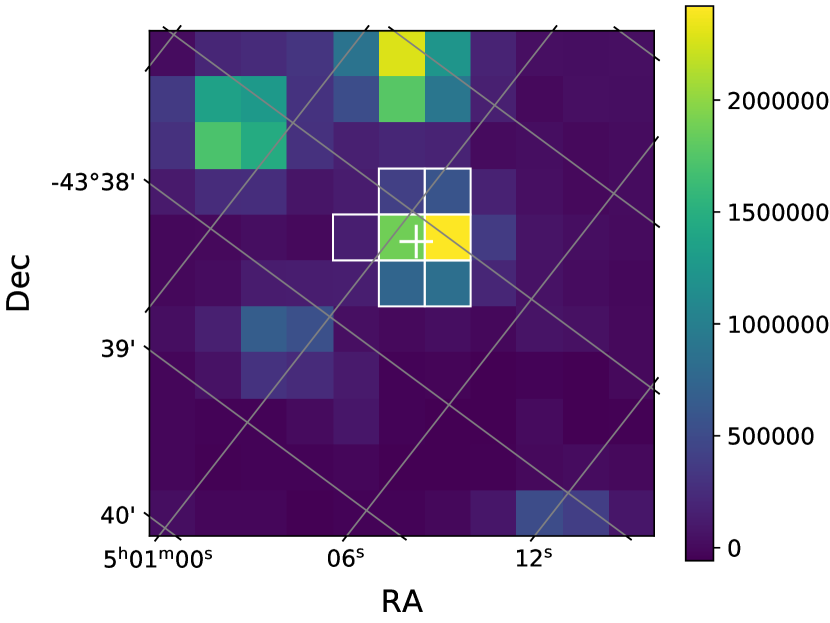
Additionally, both J0808 and J0501, another Peter Pan disk candidate in the Columba system (Boucher et al., 2016), were observed at two-minute cadence from 2018 October 18-November 15 by the Transiting Exoplanet Survey Satellite (TESS; Ricker et al., 2014) during Cycle 1, Sector 4, as part of TESS GI Program G011148 (PI Kuchner). J0808 appeared in CCD 4 of Camera 4, while J0501 appeared in CCD 4 of Camera 3. The two-minute cadence data consist of pixel subarrays, reduced with the Science Processing Operations Center (SPOC) pipeline, as described in Jenkins et al. (2016). We use the two-minute Presearch Data Conditioning light curves from the SPOC pipeline, extracted from the apertures depicted in Figure 8. The aperture for J0808 includes contributions from four other nearby stars that are spatially resolved in the CTIO data, as shown in Figure 7. We address the effect of these stars in Section 6.
5.2 Near-Infrared Spectroscopy
We observed J0808 three times with the Astronomy Research using the Cornell Infra Red Imaging Spectrograph (ARCoIRIS) near-infrared spectrograph (Schlawin et al., 2014) on the 4m Victor Blanco Telescope at Cerro Tololo Inter-American Observatory. Observation dates, individual exposure times, and total integration times are listed in Table 2. We observed multiple spectra of the target and a nearby A0V star (for use in telluric correction) using an ABBA pattern to correct for sky variability over the observation. We reduced the data using the ARCoIRIS extension of the Spextool package (Cushing et al., 2004), combined spectra using the xcombspec package (Cushing et al., 2004), and corrected for telluric lines using the xtellcor package (Vacca et al., 2003).
| Number | Total | |
|---|---|---|
| Date | Exposures | Integration Time (s) |
| 2017-11-04 | 12 | 540 |
| 2018-03-01 | 12 | 540 |
| 2018-03-02 | 12 | 720 |
6 Variability in High-Cadence Optical Photometry
6.1 Varying Morphologies in Different Bandpasses of J0808
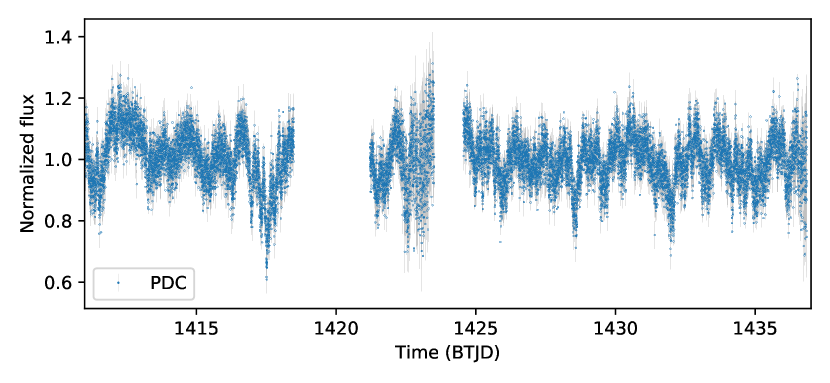
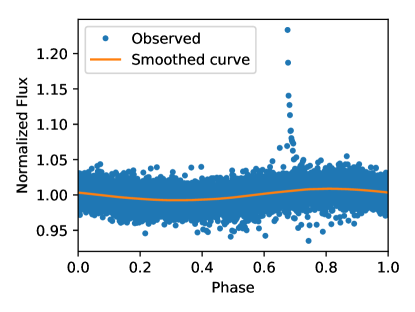
Figure 9 depicts the CTIO light curve of J0808, while Figure 10 depicts the TESS lightcurve of J0808. Qualitatively, both light curves are variable at the level; however, neither shows any obvious periodicity. While the TESS light curve is more temporally complete than the CTIO light curve, there are no obvious flares akin to the one observed in the CTIO photometry.
| Target/Observatory | Classification | ||
|---|---|---|---|
| J0808/CTIO | Aperiodic burster | ||
| J0808/TESS | Aperiodic dipper | ||
| J0501/TESS | Periodic symmetric |
Cody et al. (2014) present a morphology classification system for young stellar objects based on space-based high-cadence light curves. We adapted this system to characterize our Peter Pan disk light curves, adapting each statistical metric and to our data sample. These statistics for each of the three light curves we analyze are listed in Table 3.
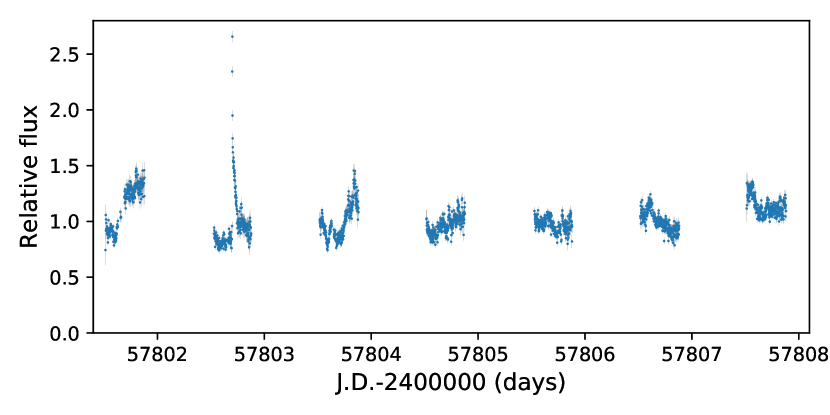
Qualitatively, the CTIO light curve of J0808 exhibits stochastically-occurring, low-amplitude bursting events (Stauffer et al., 2014), thought to correspond to accretion events. To quantify this, we applied a variation of the Cody et al. (2014) statistic, which measures how asymmetric the light curve is with respect to reflection in the flux dimension (i.e. whether the light curve tends to burst, dip, or a mix of the two). We smoothed the light curve for each night using a boxcar smoothing kernel of width 1.5 hours, and then identified outliers from the residual of the raw and smoothed light curves. We averaged the top and bottom 5% of values from the outlier-removed light curve, subtracted this value from the median of the outlier-subtracted light curve, and divided by the root mean square uncertainty of the outlier-subtracted light curve. Cody et al. (2014) define “bursters” as having , with bursts thought to be due to accretion events. “Dippers” are defined as having ; the namesake dips are thought to be due to extinction by transiting dust in the disk. Objects with values between these limits are classified as “symmetric.” For the CTIO data, , consistent with our qualitative “bursting” assessment.
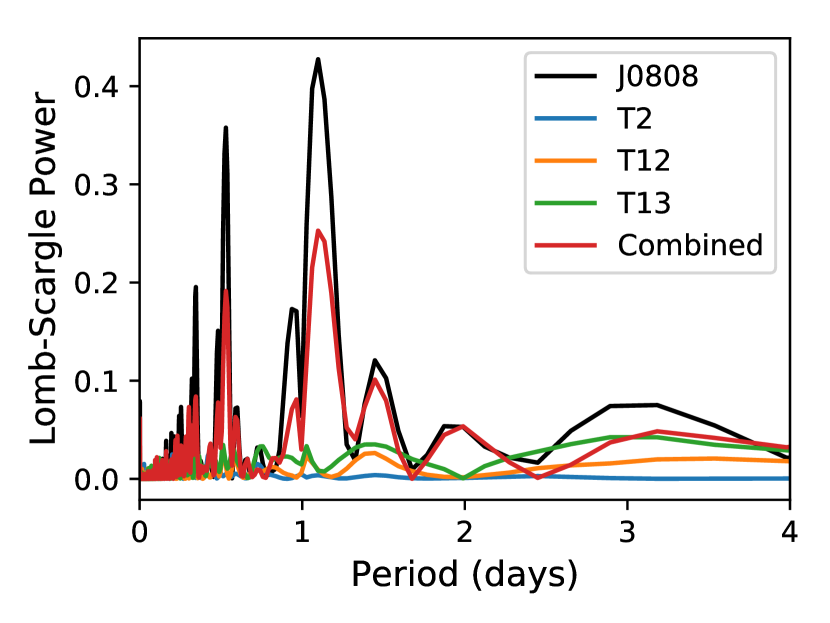
Periodicity in the CTIO light curve is more difficult to assess, given the degeneracies that arise from the gaps in the ground-based light curve. Due to these gaps, we discarded the autocorrelation-function-based assessment of Cody et al. (2014), instead adapting it to use the Lomb-Scargle periodogram (Lomb, 1976; Scargle, 1982). We show the Lomb-Scargle periodogram for J0808 and neighboring stars within the TESS aperture in Figure 11. We see strong periods of 1.10 days and 0.53 days for J0808, likely aliases of each other introduced by the windowing function of nightly observations. Similar signals do not appear for the other stars in the aperture, and the periodogram of the combined-flux light curve of all four stars is dominated by the signal found in J0808.
The phase-folded light curve assuming a 1.098-day period has a gap due to the nightly observing window, so we adopt the 0.531-day period to derive the statistic from Cody et al. (2014), which measures how periodic a light curve is by determining the fraction of variability determined by the dominant periodic signal. With this period, we find for a 0.531-day period, an aperiodic variation per Cody et al. (2014). The most likely scenario is that the Lomb-Scargle periodogram is picking up this aperiodic variability.
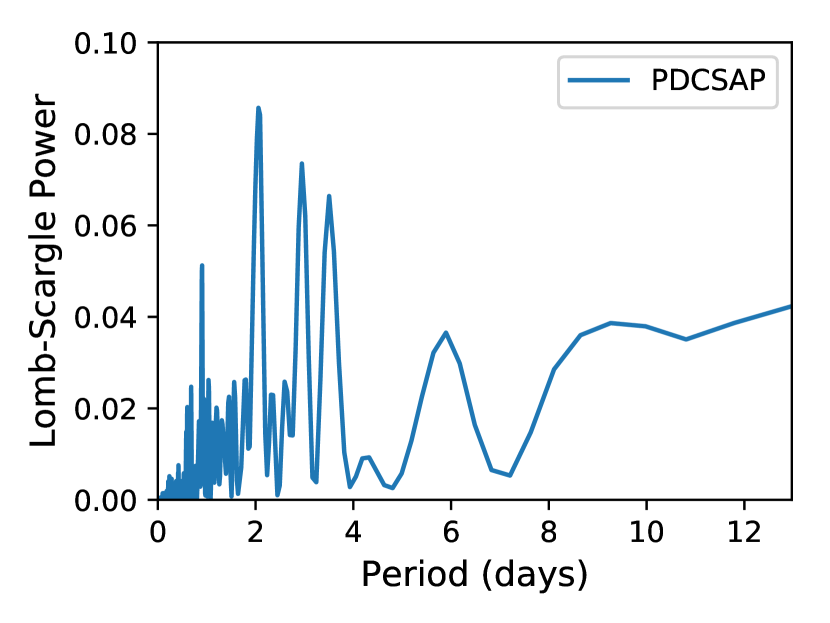
The TESS light curve does not exhibit these morphological characteristics. We qualitatively assess the light curve, shown in Figure 10, as an aperiodic dipper, with dips on the timescale of half a day to several days. The Lomb-Scargle periodogram for the target (Figure 11) has no peaks with power greater than 0.1, further bolstering the case for aperiodicity. To quantify the level of (a)periodicity, we calculate the statistic using the strongest period in the light curve’s Lomb-Scargle periodogram, which yields . We find ; Cody et al. (2014) classify this as symmetric, but closer to the dipper end () than the burster end.
We observed one large classical flare during the CTIO observations, in the second night depicted in Figure 9, using the PyVan software (Lawson et al., 2019) for identifying and characterizing flares in unevenly-sampled photometry. The flare has a peak amplitude of the median of the full light curve, and a duration of 0.08 days. Using the empirical flare template for GJ 1243 from Kepler (Davenport et al., 2014), we estimate a flare equivalent duration of s. Traditionally flare energies are calculated from the equivalent duration (e.g. Gershberg, 1972); however, this requires an accurate determination of the stellar luminosity during the flare. Given that the star exhibits variability at the 20% level likely due to ongoing accretion, it is impossible to confidently assess the underlying luminosity of the star during the flare without additional data (e.g. simultaneous spectroscopy), making an accurate energy determination impossible with the data in-hand.
The TESS data do not reveal any obvious flares, likely because the TESS bandpass is redward of the peak flare brightness, and the SNR of the TESS data (typically ) is low compared to the CTIO data. To quantify this, we derive a conversion to estimate the flux increase the flare observed with CTIO would produce in our TESS data, using known standard flare characteristics and the CTIO observations. We adopt a 3100K, log()=4.5 BT-Settl (Baraffe et al., 2015) model to represent J0808 (per Murphy et al., 2018), and a 10,000K blackbody to represent the flare (Kowalski et al., 2013). We then determine the filling factor such that
| (1) |
where is the stellar flux in the Sloan band, is the estimated Sloan -band flux of the adopted 10,000K blackbody, and is the observed flux at the flare peak relative to the median of the light curve.
We then inverted this equation in the TESS bandpass, using the value of from the band to solve for the relative flux increase with TESS. We find that the CTIO flare would produce a 16.5% increase in flux observed with TESS at the flare’s peak, a 3.33 increase above the light curve median flux based on the light curve’s RMS uncertainty. This is the most likely explanation for the lack of identifiable flares in the TESS data despite its increased temporal coverage; the TESS bandpass is red enough relative to the peak brightness of the flare that even large flares do not rise to the level of significance, especially on a faint target with correspondingly decreased signal-to-noise.
We also estimated the peak brightness in Sloan of a flare with peak brightness 5 above the median TESS flux. Such a flare would have a peak brightness the observed median with CTIO.
6.2 Periodicity and a Flare on J0501
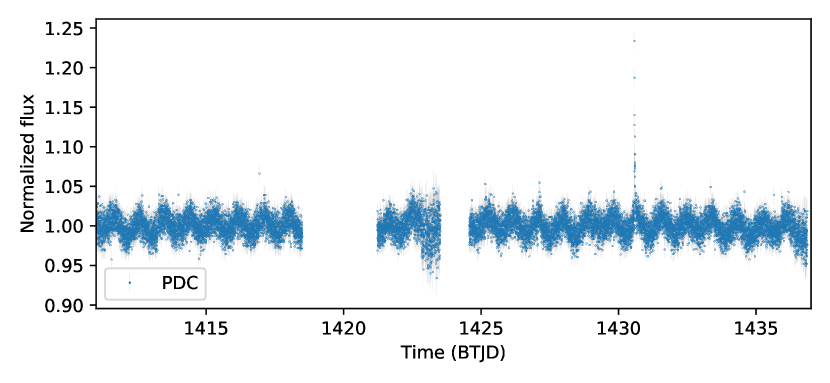
Figure 12 shows the TESS light curve for J0501. Unlike the light curve for J0808, J0501 exhibits both clear periodicity and an obvious flare. The and statistics bear this out: , on the periodic/quasi-periodic boundary, while , nearly perfectly symmetric. The period of J0501 is 0.906 days, and the phase-folded light curve (shown in Figure 13) exhibits a shape consistent with a persistent starspot or complex of starspots, as seen on the active M dwarf GJ 1243 with Kepler (Hawley et al., 2014; Davenport et al., 2015)
We estimate a stellar radius for J0501 of , following the -magnitude-based relation of Pecaut & Mamajek (2013).222We adapt the technique from Pecaut & Mamajek (2013) to use the 2015 IAU definition of , as was done in Murphy et al. (2018). Using this, the observed TESS period, and the found by Boucher et al. (2016), we estimate an inclination angle for the system of . While not face-on, this indicates an inclination angle favorable for potential spatial resolution of the disk.
In addition to the rotation period, we identify one flare in the TESS data using PyVan and visual inspection. Fitting the Kepler empirical flare template (Davenport et al., 2014) to it, we find a rise time of 385 seconds, and a duration of 106 minutes, yielding an equivalent duration of minutes.
7 Accretion and Excess Detection in Near-Infrared Spectroscopy
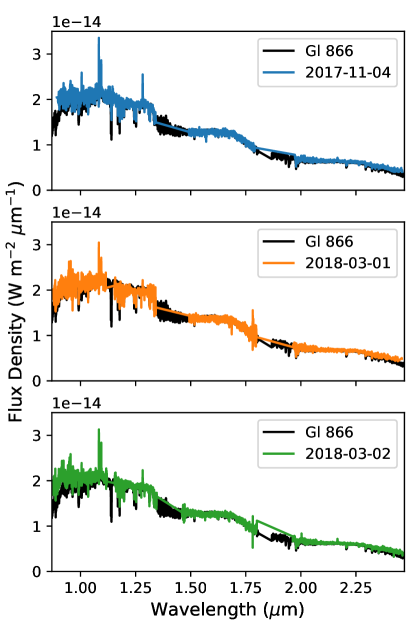
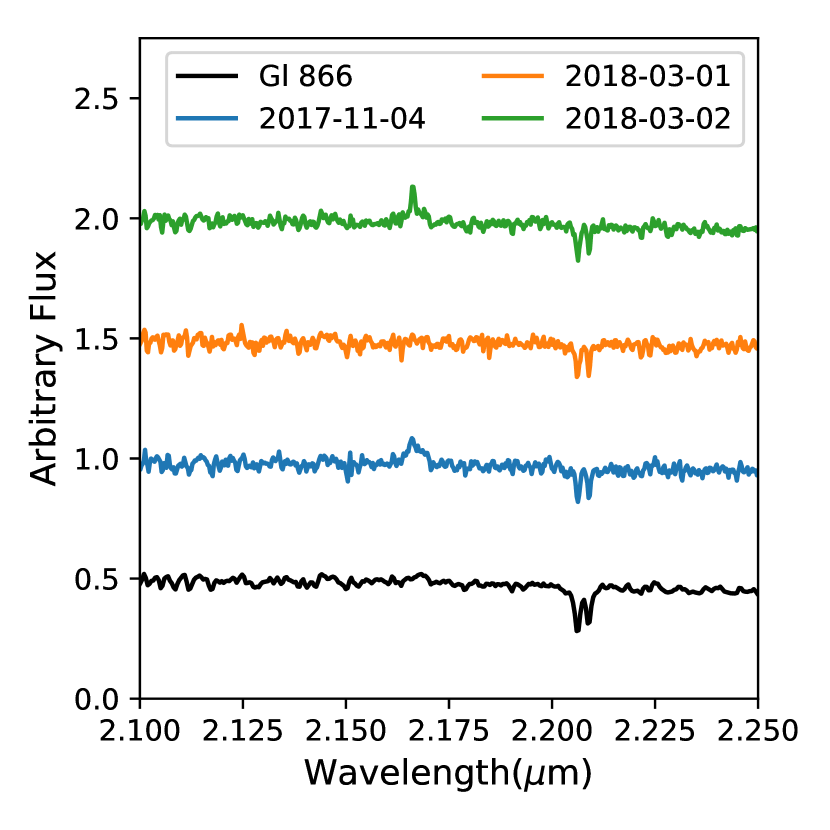
Figure 14 shows all three observations of J0808, compared with the SpeX library spectrum of Gl 866ABC (Rayner et al., 2009), a typical M5V star that we use as a comparison template based on the M5V spectral type from Murphy et al. (2018). This comparison spectrum overall shows a good match to the J0808 spectra. However, there are significant deviations of interest in two places: J0808 exhibits an excess in its -band spectra, and exhibits time-variable hydrogen emission.
7.1 K-band Excess
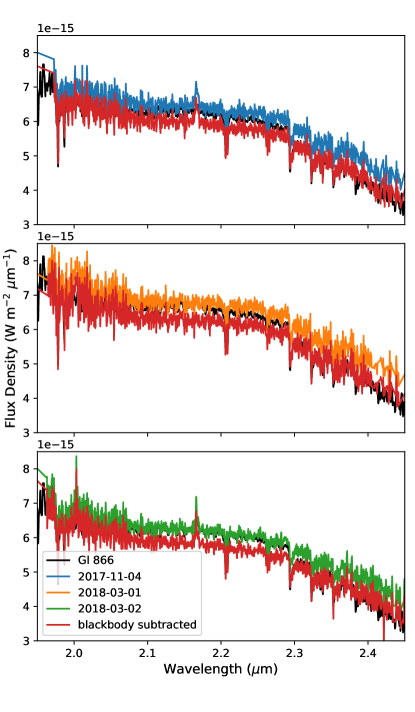
All three -band spectra of the system (Figure 15) show a continuum level in excess of the expected continuum of an M5V star. Murphy et al. (2018) identified correlated variability in the W1 and W2 single-exposure photometry for J0808, with a best-fit blackbody of K and fractional infrared luminosity ranging from 0 to 0.11, based on the observed variability. Our observations are consistent with detecting the short-wavelength end of this excess. The 1071 K blackbody at 0.11 is a good fit to the excess beyond 2.30 m in all three epochs; however, contributions from this blackbody do not appear at shorter wavelengths, suggesting a potential disk truncation radius. We do not detect any variability between observations above the continuum noise; however, the time series W1/W2 photometry has exhibited similar fluxes on 24-hour timescales.
7.2 Hydrogen Emission Variability
| Date | Pa | Br | Accretion | Accretion | ||||
|---|---|---|---|---|---|---|---|---|
| EW | Line Flux | Accr. Lum. | EW | Line Flux | Accr. Lum. | Luminosity | Rate | |
| Å | Å | |||||||
| 2017-11-04 | ||||||||
| 2018-03-01 | ||||||||
| 2018-03-02 | ||||||||
We determined equivalent widths and line luminosities for the Pa and Br emission lines in all three spectra. From these we estimated the accretion luminosity, using the relation from Muzerolle et al. (1998). We use the relation from Natta et al. (2004) rather than the similar relation from Muzerolle et al. (1998) because the former incorporates data from objects with lower masses and line luminosities than our target, allowing us to estimate the value for our star by interpolation rather than extrapolation. We used these accretion luminosities to estimate the mass accretion rate onto the star, using the stellar radius and mass from Murphy et al. (2018), and assuming that the inner radius of the accretion disk corresponds to the blackbody radius of the hot disk identified in Murphy et al. (2018). The results are listed in Table 4. Our mass accretion rates fall dex lower than those found by Murphy et al. (2018) using the relation from Natta et al. (2004). This is expected, given that the relation was calibrated for younger stars and was unadjusted for age.
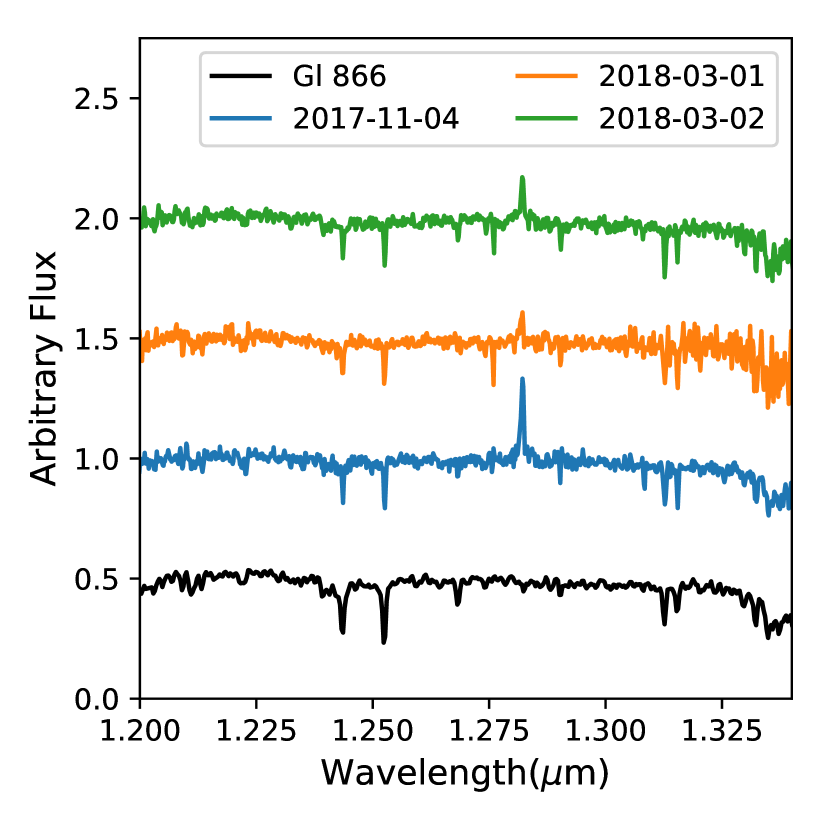
While quantitatively the accretion luminosities do not significantly vary from observation to observation, the accretion signature lines show striking differences in each spectrum, as shown in Figure 16. Most notable is the complete disappearance of Br in the observation of 2018 March 01. While Br is a shallow line, and thus would be expected to disappear before Pa does, this highlights the need for monitoring in multiple bandpasses at once. The lack of variation in accretion luminosity is due to the conversion from line fluxes to accretion fluxes, which is dominated by uncertainty in the conversion itself (rather than observational uncertainty in the line flux).
8 Characteristics and Formation Mechanisms of Peter Pan Disks
In the preceding sections, we have described two new Peter Pan disk systems, and further characterized known Peter Pan disks. Here, we use the accumulated information on these systems to identify the shared characteristics that seem to define a distinct class of objects. We then discuss five potential formation and evolution mechanisms that lead to the observed characteristics of these systems at their ages. We also consider the implications of the findings of Flaherty et al. (2019), indicating a lack of CO gas in the system. In the final subsection, we discuss various additional observations that could potentially be used to test these scenarios.
8.1 What is a Peter Pan Disk?
There are now eight systems with literature identifications in the Great Austral Young Association (GAYA) that have been claimed as accretion disk candidates. However, there are disagreements in the literature about these targets and their behaviors. We therefore take this opportunity to note the particular characteristics which make these Peter Pan disks a unique population, and summarize each object.
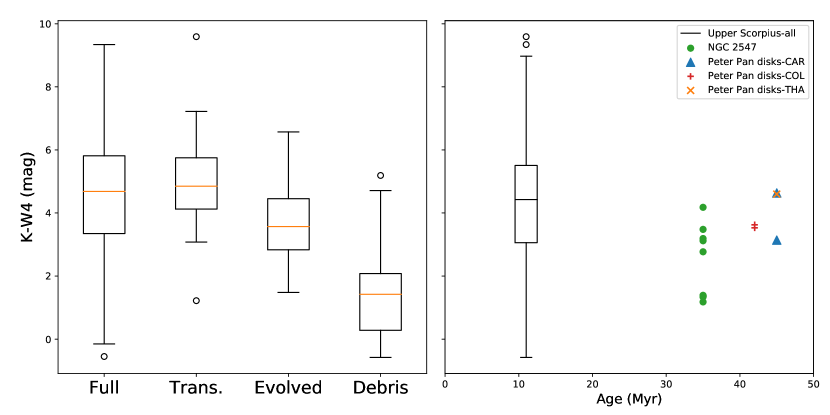
Figure 17 shows the four measured excesses for these systems at 22 m in comparison to the M-type disks identified in the 10 Myr Upper Scorpius association by Cody & Hillenbrand (2018), and the sample of M dwarf disks categorized as debris disks by Forbrich et al. (2008) in the 35-Myr NGC 2254. This shows that the excesses seen in the Peter Pan disks correspond more closely to “full,” “evolved,”, or “transitional” disks, rather than debris disks, following the classification scheme adopted by Luhman & Mamajek (2012) and Esplin et al. (2014).111We note that in this classification scheme, a “transitional” disk is a disk with an inner hole or gap, while an “evolved” disk is optically thin, but does not have a hole (Luhman & Mamajek, 2012).
Thus far, the common features of “Peter Pan” disks are:
-
1.
a star or brown dwarf of M or later spectral type,
-
2.
at age Myr, based on moving group membership,
- 3.
-
4.
and has an accretion signature indicative of the presence of warm gas.
J0808, the prototypical example. J0808 is the prototypical Peter Pan disk. Its kinematics and spectroscopic age indicators place it at an age Myr, it has a (Murphy et al., 2018), and its optical and near-IR spectra show clear evidence of accretion (Murphy et al., 2018, Section 7).
J0501, another example. Similar to J0808, J0501 shows clear evidence of age Myr, , and evidence of accretion from broad H emission.
J0446AB, a Peter Pan pair. While both J0446A and J0446B are high-likelihood members of Columba, the H measurements straddle the boundaries separating an accretion origin from an activity origin defined in the literature (White & Basri, 2003; Jayawardhana et al., 2003). We interpret the H measurements as indicators of accretion and thus identify both targets as Peter Pan disks, but note that measurement of accretion signatures that suffer less from origin confusion (e.g. spectroscopy that resolves the wings of the H line, near-IR hydrogen emission lines, UV/X-ray observations) is necessary.
J0949AB, another likely Peter Pan pair. J0949A is clearly accreting, based on the presence of He I 6678Å emission and the strength and breadth of the H emission. While not as clear-cut, J0949B also shows evidence of accretion, based on the breadth of the H emission. We thus consider both of these stars Peter Pan disk candidates. As with J0446, additional measures of accretion (UV/X-ray excess, near-IR hydrogen emission) would be beneficial for eliminating confusing with activity-driven H emission.
J0226, a brown dwarf Peter Pan candidate. Boucher et al. (2016) also present 2MASS J (hereafter J0226) as an L0 member of the Tucana-Horologium association (THA), with an age of Myr. Using updated kinematics for the object from Gaia DR2 (including a trigonometric parallax) and the radial velocity from Boucher et al. (2016), J0226 has a 98.8% likelihood of membership in THA from BANYAN . The object also exhibits Pa emission indicative of ongoing accretion, though a quantitative measurement of the accretion rate has not yet been made. This object extends the realm of Peter Pan disk down to a much lower mass.
J0041, a candidate we discard. While Gagné et al. (2014) identified J0041 as a likely member of Tucana-Horologium, Shkolnik et al. (2017) identify it as a likely member of the Beta Pictoris moving group. Furthermore, the system does not exhibit any excess with WISE. We thus discard it from consideration as a Peter Pan disk.
J0949 requires more kinematic information. Despite an angular separation of and a physical distance of pc (Table 3), the proper motions of the two objects in J0949 significantly differ. J0949B moves mas/yr faster than J0949A in right ascension, and mas/yr slower in declination. Thus, while J0949A has a membership likelihood in Carina of , J0949B is near-equally likely to be a member of Carina, Lower Centaurus-Crux, or the field. The observed radial velocities make Carina more likely (per BANYAN ), but not overwhelmingly so. One possible explanation is that the observed proper motion difference is due to orbital motion of a bound binary system. It is not possible with the current data to determine if the system is bound, given the large relative uncertainties of the system; the physical separation is only a measurement, while the space velocity relative to the center of mass of the system has uncertainty . Further observations to reduce these kinematic uncertainties (e.g. high-precision RV measurements, improved precision on parallax) will be necessary to confirm this possibility of orbital motion.
Further Potential Peter Pan Disks. Several of the objects in NGC 2254 exhibit 22 m excesses similar to the Peter Pan disks presented here, despite their classification as debris by Forbrich et al. (2008). However, we have not found any published optical or infrared spectra of the NGC 2254 objects with sufficient resolution to measure accretion-caused hydrogen emission from these stars; better spectroscopy of these systems is warranted.
8.2 Characteristics of Known Peter Pan Disks
We list the observed characteristics of the seven Peter Pan disk candidates in Table 8.2, including updated astrometry and moving group membership information for J0808 from Gaia DR2. Parallax and proper motion measurements for J0501 were not included in Gaia DR2, so we use the characteristics listed in Boucher et al. (2016). In addition to the astrometry, we list accretion rate measurements from both optical and near-IR spectroscopy, WISE colors, and best-fit SED model characteristics of the systems.
| Designation | J0808 | J0501 | J0446A | J0446B | J0949A | J0949B | J0226 | Ref. |
|---|---|---|---|---|---|---|---|---|
| R.A. (h:m:s)aaRight ascension and declination are the stellar positions at epoch J2015.5, the Gaia reference epoch. | 08:08:22.182 | 05:01:00.889 | 04:46:34.105 | 04:46:34.249 | 09:49:00.753 | 09:49:00.441 | 02:26:56.758 | 1 |
| Dec. (d:m:s)aaRight ascension and declination are the stellar positions at epoch J2015.5, the Gaia reference epoch. | −64:43:57.26 | -43:37:09.96 | -26:27:56.84 | -26:27:55.57 | -71:38:02.95 | -71:38:03.16 | -53:27:03.46 | 1 |
| Distance (pc) | bbStatistical distance from Boucher et al. (2016). | 1,2 | ||||||
| (mas yr-1) | ccNo trigonometric proper motion data available from Gaia. | 1,2 | ||||||
| (mas yr-1) | ccNo trigonometric proper motion data available from Gaia. | 1,2 | ||||||
| RV (km s-1) | 3,2,4 | |||||||
| Spectral Type | M5 | M4.5 | M6 | M6 | M4 | M5 | L0 | 3,2,4 |
| Association | CAR | COL | COL | COL | CAR | CAR | THA | 5,2,4 |
| Age (Myr) | 6 | |||||||
| 3,2,4 | ||||||||
| (-12)-(-10.8) | 4 | |||||||
| (mag) | 4 | |||||||
| (mag) | 5,2,4 | |||||||
| (K) | 3125 | dd adopted from temperature of best fit BT-Settl stellar model. | dd adopted from temperature of best fit BT-Settl stellar model. | dd adopted from temperature of best fit BT-Settl stellar model. | dd adopted from temperature of best fit BT-Settl stellar model. | 2260ee from presented in Boucher et al. (2016). | 3,2 | |
| (K) | 3 | |||||||
| [0…0.11]ffApproximate range from variability in W1 and W2 photometry (see Murphy et al., 2018). | 3 | |||||||
| (K) | 3,2,4 | |||||||
| gg calculated using combined flux from both stars. | gg calculated using combined flux from both stars. | 3,2,4 | ||||||
| (K) | 7 | |||||||
8.3 Origins of Peter Pan Disks
Below, we discuss six possible origins for Peter Pan disks. The most straightforward scenario is that these systems are long-lived primordial disks, and that our understanding of M dwarf disk evolution is still emerging. However, we also consider the possibility that some M dwarfs host secondary disks that form long after the primordial disk dissipates, analogous to disks around white dwarfs or other evolved stars.
8.3.1 Slow Dissipation of Primordial Disks about Low-Mass Stars
The simplest explanation for the existence of Peter Pan disks is that, in general, M dwarfs simply dissipate their primordial disks less rapidly than higher mass stars. Perhaps they are part of the trend observed in stars more massive than M dwarfs: disks around stars of masses dissipate in approximately half the time as stars with masses below this (e.g. Carpenter et al., 2006), likely due to their higher accretion rates (e.g. Calvet et al., 2005) and higher levels of X-ray photoevaporation (e.g. Owen et al., 2012). The low accretion rates identified in this work compared to other primordial disks around stars with similar masses (albeit with larger radii) would correspond to this difference, but on the low-mass end.
The observed primordial disk fraction of mid-late M dwarfs (spectral types later than M3.5) in the Myr Upper Scorpius association from Cody & Hillenbrand (2018) corresponds to an -folding timescale of Myr. Extrapolating to the ages of the groups considered here, we would expect an occurrence rate of Peter Pan disks of for Columba, and for Carina and Tucana-Horologium. It is likely that such systems have not been detected until now due to the lack of precise astrometry for late-type objects in the pre-Gaia era—one would expect that the low-mass ends of moving groups will be better characterized now that this data is available. Indeed, such progress is underway (e.g. Gagné & Faherty, 2018), but additional observations (radial velocity measurements and independent age indicators) are necessary to confirm membership lists for these associations.
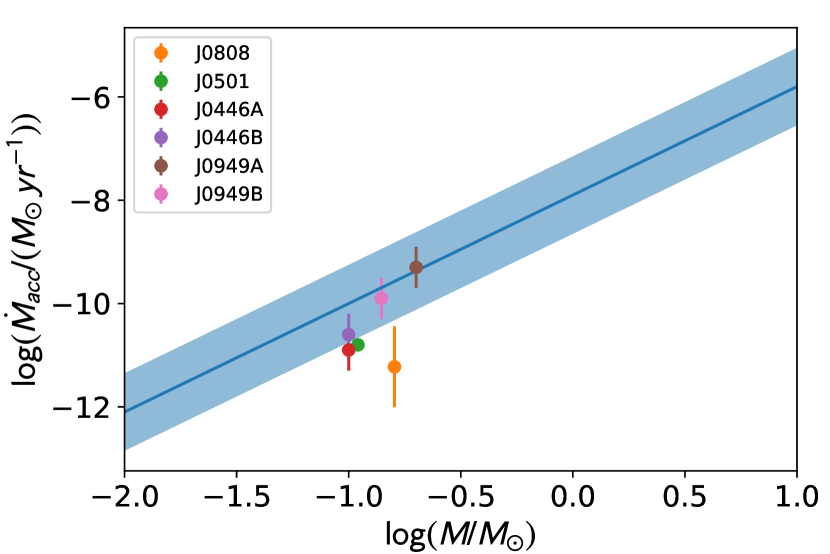
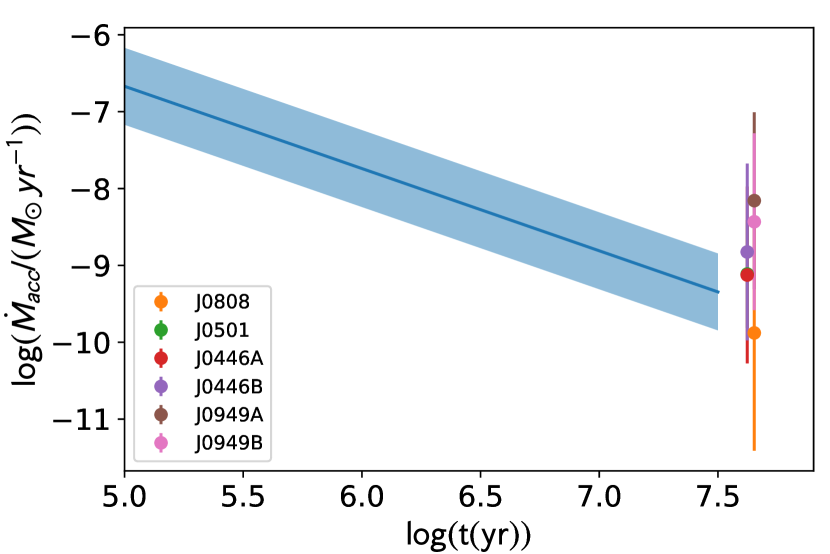
Figure 18 shows the observed accretion rates for our sample of Peter Pan disks against the accretion rate-mass and accretion rate-age relations derived by Hartmann et al. (2016). Hartmann et al. (2016) present a linear relationship between and of
| (2) |
with scatter dex. The accretion rates measured for the Peter Pan disks are consistent with this relationship, assuming a stellar mass for the objects corresponding to the main-sequence mass of a star of that spectral type for the new objects. Following Hartmann et al. (2016), we then scaled the accretion rates of the Peter Pan disks to a stellar mass of :
| (3) |
These scaled accretion rates at Myr are consistent with the accretion-rate-time relationship from Hartmann et al. (2016), which was calibrated on stars of ages Myr. We note the caveat from Hartmann et al. (2016) that the sample may be biased due to correlated uncertainties in age and accretion rate. We also note that five objects with masses in Hartmann et al. (2016) have isochronal ages of Myr despite apparent membership in much younger associations. Given the apparent discrepancy in age depending on group membership, we thus continue to adopt an approximate lower age limit for Peter Pan disks of Myr.
A long-lived primordial disk would be expected to exhibit cold gas, as well as dust. ALMA observations of J0808 (Flaherty et al., 2019) do not show any evidence of CO gas, the most common tracer. However, Flaherty et al. (2019) demonstrate that CO gas may photodissociate around M dwarfs on timescales less than the ages of this system, suggesting that this non-detection has limited impact on our understanding of the origin of this disk. Additional submillimeter observations would be useful to characterize the presence of non-CO gas (e.g. H2O) in the system and in other Peter Pan disk systems. These observations could also trace the presence of [CI], which has been shown to shield CO from photodissociation (Kral et al., 2019); the presence of [CI] could indicate that a dissipation method other than photodissociation is at play.
Viewing Peter Pan disks as long lived primordial disks raises some nagging questions: why have disks around these particular stars survived so long? Were these systems shielded from high-energy radiation external to the system (e.g. Anderson et al., 2013)? Did their host stars produce atypically little X-ray and UV radiation? Better characterizing the UV activity and chemistry of Peter Pan disk host stars could provide insights into why the disks around these particular stars seem to have lingered around for so long.
8.3.2 Hybrid Disks or Extreme Debris Disks, Arising from Recent Collisions
Recent observations of J0808 with ALMA (Flaherty et al., 2019) show optically-thin dust at 1.3 mm and no evidence of CO. This combination led Flaherty et al. (2019) to suggest that the system is not a conventional primordial disk, but a gas-free debris disk. They suggested that dust grains released in the outer disk could migrate inwards via Poynting-Robertson (PR) drag, potentially serving as a source of grains for the strong infrared excess. If this were true, J0808, with its fractional infrared luminosity of would be a very ”extreme” debris disk. Indeed Flaherty et al. (2019) estimate that if the dust mass estimated from the 1.3-mm emission were to migrate inwards to this inner radius it would be highly optically thick (optical depth ).
However, we find this PR transport scenario implausible, because of the fundamental limit that grain-grain collisions impose on the optical depth in a transport-dominated debris disk (Kuchner & Stark, 2010). Grains transported by PR drag or any kind of drag can not produce a grain pileup with a face-on optical depth greater than the critical value of , where is the local Keplerian speed (Kuchner & Stark, 2010). For dust orbiting 0.01 au from an M dwarf, this limit is roughly . The fractional infrared luminosity may differ from the face-on optical depth because of geometrical effects, but these are not likely to provide more than an order of magnitude of flexibility. PR drag driven by a stellar wind or scattered radiation could operate in these systems. However, to effectively transport dust in disks with an optical depth greater than , transport forces would need to operate on timescales shorter than the collision time, which these secondary forces do not.
A more likely scenario, which Flaherty et al. (2019) also discuss, would be that the disk around J0808 (and perhaps other Peter Pan disks) arises from a recent collision among protoplanets, or a new collisional cascade of asteroid analogs. The dipper-like variability we observed in J0808 with CTIO and TESS may support this scenario.
However, observations of accretion signatures in spectra of J0808 by both Murphy et al. (2018) and by us imply an accretion rate of of hydrogen per Myr. Debris disks are generally considered to be mostly free of hydrogen gas, although Wilson et al. (2017) detected hydrogen in the Pictoris debris disk. If J0808 is a debris disk, it is most similar to the family of gas-rich debris disks, or perhaps the subset of these that is sometimes referred to as ”hybrid disks” (Péricaud et al., 2017; Moór et al., 2017), which may retain some primordial gas.
8.3.3 Star-Star and Star-Disk Interactions
Could secondary Peter Pan disks arise from stellar collisions or close encounters? During a close encounter, the M dwarf could acquire the disk of the other star (e.g. Pfalzner et al., 2005). Alternatively an M dwarf could collide with a lower-mass M dwarf or brown dwarf, forming a disk from the high-angular momentum material (e.g. Leonard & Livio, 1995). However, such stellar encounters rarely occur outside of a tightly packed cluster (young moving groups are not nearly dense enough), and direct stellar collisions tend to produce a younger-looking, more massive stars (i.e. not M dwarfs).
8.3.4 Tidal disruption of a giant planet
Could secondary Peter Pan disks be fed by tidal disruption of gas giant planets? Perhaps, but the geometry of the resulting disk seems be a poor match for the disks we observe. The Roche radius for J0808 and a planet with Neptune’s density and radius is au. This radius is well inside the au blackbody radius of J0808’s inner disk (as identified by Murphy et al., 2018), and the other disks in Table 8.2 are not significantly closer to their respective stars.
8.3.5 A disk due to a mass transfer binary
Could secondary Peter Pan disks arise from mass transfer in a binary system? This scenario requires a “primary” star massive enough to evolve onto and off the main sequence in Myr while low enough mass to evolve into a white dwarf, rather than producing a core-collapse supernova. Given that the main-sequence lifetime for a B1V star, too massive to produce a white dwarf, is Myr, this scenario can not explain the disks we observer in Carina, Columba, and Tuc-Hor. However, it could potentially generate Peter Pan disks around older M dwarfs in older groups, if those were ever identified.
8.4 More Observations Needed
Our understanding of the parameters, membership and the origin of this apparent new category of disks would benefit from further observations, in addition to the sub-mm and UV follow-up we suggested above.
-
•
Radio/sub-mm observations: Primordial disks are expected to have substantial reservoirs of cold material. Observations at sub-mm wavelengths in multiple bands would identify whether such a reservoir exists in these systems. Such observations would also enable estimation of the system’s disk mass and gas content, critical for understanding the evolutionary state of the system. If no gas is detected in the system, it could indicate a formation scenario closer to that described by Flaherty et al. (2019). Multiple bands are necessary to constrain the temperature of the emission, and to probe multiple molecules (e.g. CO and ).
-
•
High-energy observations: A key driver of primordial disk dissipation is photoevaporation of the disk’s gas content from far- and extreme-ultraviolet (FUV and EUV) radiation (e.g. Williams & Cieza, 2011). Studies of the low-mass population of the TW Hya association have shown an anti-correlation between X-ray luminosity and disk fraction as a function of spectral type; earlier M dwarfs have higher X-ray luminosities and a lower disk fraction than mid-late M dwarfs (Kastner et al., 2016). If Peter Pan disks are long-lived primordial disks, this observed anticorrelation with spectral type would provide an explanation for why they have not been detected around earlier spectral types. X-ray observations of the ensemble of Peter Pan disks would enable measurement of the current photoevaporation rate to demonstrate if it is in fact lower than expected, allowing a longer disk life than typically found for primordial disks.
Additionally, high-energy spectroscopy of Peter Pan disks could yield information as to the composition of the accretion material (e.g. Kastner et al., 2002; Stelzer & Schmitt, 2004). If the accretion material is the gas expected from a classical T Tauri star, that would provide support for the long-lived primordial disk hypothesis. An accretion material composition similar to vaporized exocometary material, alternatively, would support the Flaherty et al. (2019) theory of an evolved disk, with substantial excesses in the WISE bands due to migration of large grains inward.
-
•
High-resolution spectroscopy Higher-resolution () spectroscopy of a larger sample of optical Peter Pan disks would allow us to firmly resolve accretion behavior in the spectra, such as line asymmetries in H(Hartmann et al., 2016), and identification of other narrow emission lines indicative of accretion, e.g. He I , [O I] , and He I (Hartmann et al., 2016; Murphy et al., 2018). High-resolution spectra will also enable detection of the narrow Li I line at 6708 Å to further confirm the ages of the stars.
- •
-
•
Broad-band photometry and light curves: Near-UV, -, or -band observations of Peter Pan disks would allow us to detect continuum emission from the accretion material (Hartmann et al., 2016). Detection of an excess in this range would more clearly indicate accretion, rather than chromospheric activity, as the primary driver of H.
Optical light curves of these systems can provide information as to the activity level of the system (e.g. flares), alignment of the system relative to the line of sight (see Section 6.2), and disk interactions (e.g. bursting and dipping; Cody et al., 2014). As TESS continues into its extended mission, its light curves will provide additional constraints on Peter Pan disks as more are observed.
9 Summary
In this paper, we proposed a set of observational characteristics of a new class of “Peter Pan” disk systems: an M-type or later star or brown dwarf with a substantial, warm excess, at a stellar age Myr, and exhibiting ongoing accretion. Four new Peter Pan disk detections, based on a crossmatch of Gaia DR2 with the Disk Detective input catalog and testing objects with the BANYAN software, were presented. High-cadence photometric observations of WISEA J0808, the prototypical Peter Pan disk, with the CTIO 0.9m telescope and TESS revealed some flare activity and dipping events, attributable to disk occultations. High-cadence TESS light curves of 2MASS J0501, another Peter Pan disk, shows evidence for a persistent starspot or starspot complex and ongoing flare activity. Using the period from the TESS observations and a projected rotational velocity from the literature (Boucher et al., 2016), we found J0501 to have an inclination angle of . We presented near-infrared spectroscopy of J0808 over six months, showing low-level accretion variable on 24-hour timescales. With these observations in mind, we discussed several potential formation mechanisms for these systems, before concluding that the two most likely mechanisms were long-lived primordial disks, and a recent collisional cascade of protoplanets combined with a long-lived gas component to produce the observed WISE excess. In either case, a unusually long-lived gas component seems to be required to explain the observed accretion onto the star, which raises the question of why gas has persisted around these particular stars.
Flaherty et al. (2019) noted that J0808 was an oddity, given its substantial excess and ongoing accretion. The identification of four new candidate systems with similar characteristics, in addition to the three previously-known Peter Pan disks, throws this categorization into question. It seems plausible that that the dearth of detections of disks of this sort is instead due to the limits of observation, rather than an actual dearth of such systems. As Gaia measures the astrometry of more low-mass stars, more low-mass moving group members will be identified, enabling further identification of such systems.
Despite the approach to disk identification that Disk Detective adopts, investigating every object with potential excess, M dwarf disks remain elusive. However, Peter Pan disks as a class likely would not have been identified without such an approach, as the systems identified thus far would not have been included in a typical WISE disk search. Incorporation of new resources that have become available since the launch of Disk Detective, such as Pan-STARRS (Chambers et al., 2016) and unWISE (Lang, 2014), may significantly increase the yield of Peter Pan disks in the near future.
References
- Anderson et al. (2013) Anderson, K. R., Adams, F. C., & Calvet, N. 2013, The Astrophysical Journal, 774, 9
- Astropy Collaboration et al. (2013) Astropy Collaboration, Robitaille, T. P., Tollerud, E. J., et al. 2013, A&A, 558, A33
- Avenhaus et al. (2012) Avenhaus, H., Schmid, H. M., & Meyer, M. R. 2012, A&A, 548, A105
- Baraffe et al. (2015) Baraffe, I., Homeier, D., Allard, F., & Chabrier, G. 2015, A&A, 577, A42
- Barrie (1904) Barrie, J. M. 1904, Peter Pan (Project Gutenberg)
- Bell et al. (2015) Bell, C. P. M., Mamajek, E. E., & Naylor, T. 2015, MNRAS, 454, 593
- Binks & Jeffries (2017) Binks, A. S., & Jeffries, R. D. 2017, MNRAS, 469, 579
- Boucher et al. (2016) Boucher, A., Lafrenière, D., Gagné, J., et al. 2016, ApJ, 832, 50
- Calvet et al. (2005) Calvet, N., Briceño, C., Hernández, J., et al. 2005, AJ, 129, 935
- Carpenter et al. (2006) Carpenter, J. M., Mamajek, E. E., Hillenbrand, L. A., & Meyer, M. R. 2006, ApJL, 651, L49
- Carpenter et al. (2009) Carpenter, J. M., Bouwman, J., Mamajek, E. E., et al. 2009, ApJSS, 181, 197
- Chambers et al. (2016) Chambers, K. C., Magnier, E. A., Metcalfe, N., et al. 2016, ArXiv e-prints, arXiv:1612.05560
- Cody & Hillenbrand (2018) Cody, A. M., & Hillenbrand, L. A. 2018, AJ, 156, 71
- Cody et al. (2014) Cody, A. M., Stauffer, J., Baglin, A., et al. 2014, AJ, 147, 82
- Collins et al. (2017) Collins, K. A., Kielkopf, J. F., Stassun, K. G., & Hessman, F. V. 2017, AJ, 153, 77
- Cushing et al. (2004) Cushing, M. C., Vacca, W. D., & Rayner, J. T. 2004, PASP, 116, 362
- Davenport et al. (2015) Davenport, J. R. A., Hebb, L., & Hawley, S. L. 2015, ApJ, 806, 212
- Davenport et al. (2014) Davenport, J. R. A., Hawley, S. L., Hebb, L., et al. 2014, ApJ, 797, 122
- Esplin et al. (2014) Esplin, T. L., Luhman, K. L., & Mamajek, E. E. 2014, ApJ, 784, 126
- Esplin et al. (2018) Esplin, T. L., Luhman, K. L., Miller, E. B., & Mamajek, E. E. 2018, AJ, 156, 75
- Fang et al. (2009) Fang, M., van Boekel, R., Wang, W., et al. 2009, A&A, 504, 461
- Flaherty et al. (2019) Flaherty, K., Hughes, A. M., Mamajek, E. E., & Murphy, S. J. 2019, ApJ, 872, 92
- Forbrich et al. (2008) Forbrich, J., Lada, C. J., Muench, A. A., & Teixeira, P. S. 2008, ApJ, 687, 1107
- Foreman-Mackey et al. (2013) Foreman-Mackey, D., Conley, A., Meierjurgen Farr, W., et al. 2013, emcee: The MCMC Hammer, Astrophysics Source Code Library, , , ascl:1303.002
- Gagné & Faherty (2018) Gagné, J., & Faherty, J. K. 2018, ApJ, 862, 138
- Gagné et al. (2014) Gagné, J., Lafrenière, D., Doyon, R., Malo, L., & Artigau, É. 2014, ApJ, 783, 121
- Gagné et al. (2018) Gagné, J., Mamajek, E. E., Malo, L., et al. 2018, ApJ, 856, 23
- Gaia Collaboration et al. (2018) Gaia Collaboration, Brown, A. G. A., Vallenari, A., et al. 2018, A&A, 616, A1
- Gershberg (1972) Gershberg, R. E. 1972, Ap&SS, 19, 75
- Greaves (2010) Greaves, J. S. 2010, MNRAS, 409, L44
- Hartmann et al. (2016) Hartmann, L., Herczeg, G., & Calvet, N. 2016, ARA&A, 54, 135
- Hawley et al. (2014) Hawley, S. L., Davenport, J. R. A., Kowalski, A. F., et al. 2014, ApJ, 797, 121
- Heng & Malik (2013) Heng, K., & Malik, M. 2013, MNRAS, 432, 2562
- Hughes et al. (2018) Hughes, A. M., Duchêne, G., & Matthews, B. C. 2018, Annual Review of Astronomy and Astrophysics, 56, 541
- Hunter (2007) Hunter, J. D. 2007, Computing In Science & Engineering, 9, 90
- Jayawardhana et al. (2003) Jayawardhana, R., Mohanty, S., & Basri, G. 2003, ApJ, 592, 282
- Jenkins et al. (2016) Jenkins, J. M., Twicken, J. D., McCauliff, S., et al. 2016, in Proc. SPIE, Vol. 9913, Software and Cyberinfrastructure for Astronomy IV, 99133E
- Jones et al. (2001) Jones, E., Oliphant, T., Peterson, P., & Others. 2001, SciPy: Open source scientific tools for Python, , . http://www.scipy.org/
- Kastner et al. (2002) Kastner, J. H., Huenemoerder, D. P., Schulz, N. S., Canizares, C. R., & Weintraub, D. A. 2002, The Astrophysical Journal, 567, 434
- Kastner et al. (2016) Kastner, J. H., Principe, D. A., Punzi, K., et al. 2016, AJ, 152, 3
- Kesseli et al. (2017) Kesseli, A. Y., West, A. A., Veyette, M., et al. 2017, The Astrophysical Journal Supplement Series, 230, 16
- Kowalski et al. (2013) Kowalski, A. F., Hawley, S. L., Wisniewski, J. P., et al. 2013, ApJSS, 207, 15
- Kral et al. (2019) Kral, Q., Marino, S., Wyatt, M. C., Kama, M., & Matrà, L. 2019, MNRAS, 489, 3670
- Kuchner & Stark (2010) Kuchner, M. J., & Stark, C. C. 2010, AJ, 140, 1007
- Kuchner et al. (2016) Kuchner, M. J., Silverberg, S. M., Bans, A. S., et al. 2016, ApJ, 830, 84
- Lacy et al. (1976) Lacy, C. H., Moffett, T. J., & Evans, D. S. 1976, ApJSS, 30, 85
- Lang (2014) Lang, D. 2014, AJ, 147, 108
- Lawson et al. (2019) Lawson, K. D., Wisniewski, J. P., Bellm, E. C., Kowalski, A. F., & Shupe, D. L. 2019, arXiv e-prints, arXiv:1903.03240
- Leonard & Livio (1995) Leonard, P. J. T., & Livio, M. 1995, ApJ, 447, L121
- Lintott et al. (2008) Lintott, C. J., Schawinski, K., Slosar, A., et al. 2008, MNRAS, 389, 1179
- Lisse et al. (2009) Lisse, C. M., Chen, C. H., Wyatt, M. C., et al. 2009, ApJ, 701, 2019
- Lomb (1976) Lomb, N. R. 1976, Ap&SS, 39, 447
- Luhman & Mamajek (2012) Luhman, K. L., & Mamajek, E. E. 2012, ApJ, 758, 31
- McKinney (2010) McKinney, W. 2010, in Proceedings of the 9th Python in Science Conference, ed. S. van der Walt & J. Millman, 51 – 56
- Moór et al. (2017) Moór, A., Curé, M., Kóspál, Á., et al. 2017, ApJ, 849, 123
- Murphy et al. (2018) Murphy, S. J., Mamajek, E. E., & Bell, C. P. M. 2018, MNRAS, 476, 3290
- Muzerolle et al. (1998) Muzerolle, J., Hartmann, L., & Calvet, N. 1998, AJ, 116, 2965
- Natta et al. (2004) Natta, A., Testi, L., Muzerolle, J., et al. 2004, A&A, 424, 603
- Owen et al. (2012) Owen, J. E., Clarke, C. J., & Ercolano, B. 2012, MNRAS, 422, 1880
- Padgett et al. (2006) Padgett, D. L., Cieza, L., Stapelfeldt, K. R., et al. 2006, ApJ, 645, 1283
- Pecaut & Mamajek (2013) Pecaut, M. J., & Mamajek, E. E. 2013, ApJS, 208, 9
- Pecaut & Mamajek (2016) —. 2016, MNRAS, 461, 794
- Péricaud et al. (2017) Péricaud, J., Di Folco, E., Dutrey, A., Guilloteau, S., & Piétu, V. 2017, A&A, 600, A62
- Pfalzner et al. (2005) Pfalzner, S., Umbreit, S., & Henning, T. 2005, ApJ, 629, 526
- Plavchan et al. (2005) Plavchan, P., Jura, M., & Lipscy, S. J. 2005, ApJ, 631, 1161
- Plavchan et al. (2009) Plavchan, P., Werner, M. W., Chen, C. H., et al. 2009, ApJ, 698, 1068
- Rayner et al. (2009) Rayner, J. T., Cushing, M. C., & Vacca, W. D. 2009, ApJSS, 185, 289
- Reiners (2009) Reiners, A. 2009, ApJL, 702, L119
- Ricker et al. (2014) Ricker, G. R., Winn, J. N., Vanderspek, R., et al. 2014, in Proc. SPIE, Vol. 9143, Space Telescopes and Instrumentation 2014: Optical, Infrared, and Millimeter Wave, 914320
- Scargle (1982) Scargle, J. D. 1982, ApJ, 263, 835
- Schlawin et al. (2014) Schlawin, E., Herter, T. L., Henderson, C., et al. 2014, in Proc. SPIE, Vol. 9147, Ground-based and Airborne Instrumentation for Astronomy V, 91472H
- Schlieder et al. (2012) Schlieder, J. E., Lépine, S., Rice, E., et al. 2012, AJ, 143, 114
- Schneider et al. (2019) Schneider, A. C., Shkolnik, E. L., Allers, K. N., et al. 2019, The Astronomical Journal, 157, 234
- Shkolnik et al. (2017) Shkolnik, E. L., Allers, K. N., Kraus, A. L., Liu, M. C., & Flagg, L. 2017, AJ, 154, 69
- Silverberg et al. (2016) Silverberg, S. M., Kuchner, M. J., Wisniewski, J. P., et al. 2016, ApJ, 830, L28
- Stauffer et al. (2014) Stauffer, J., Cody, A. M., Baglin, A., et al. 2014, AJ, 147, 83
- Stelzer & Schmitt (2004) Stelzer, B., & Schmitt, J. H. M. M. 2004, Astronomy and Astrophysics, 418, 687
- Tody (1993) Tody, D. 1993, in Astronomical Society of the Pacific Conference Series, Vol. 52, Astronomical Data Analysis Software and Systems II, ed. R. J. Hanisch, R. J. V. Brissenden, & J. Barnes, 173
- Torres et al. (2008) Torres, C. A. O., Quast, G. R., Melo, C. H. F., & Sterzik, M. F. 2008, Young Nearby Loose Associations, ed. B. Reipurth, 757
- Vacca et al. (2003) Vacca, W. D., Cushing, M. C., & Rayner, J. T. 2003, PASP, 115, 389
- Van Der Walt et al. (2011) Van Der Walt, S., Colbert, S. C., & Varoquaux, G. 2011, Computing in Science & Engineering, 13, 22
- van Dokkum (2001) van Dokkum, P. G. 2001, PASP, 113, 1420
- Wahhaj et al. (2010) Wahhaj, Z., Cieza, L., Koerner, D. W., et al. 2010, ApJ, 724, 835
- White & Basri (2003) White, R. J., & Basri, G. 2003, ApJ, 582, 1109
- Williams & Cieza (2011) Williams, J. P., & Cieza, L. A. 2011, ARA&A, 49, 67
- Wilson et al. (2017) Wilson, P. A., Lecavelier des Etangs, A., Vidal-Madjar, A., et al. 2017, A&A, 599, A75
- Wyatt (2008) Wyatt, M. C. 2008, ARA&A, 46, 339