NuSTAR Observations and multi-wavelength modeling of the high-redshift BL Lac Object 4FGL J2146.5-1344
Abstract
High synchrotron peak (HSP; Hz) BL Lacs are some of the most extreme accelerators in the Universe. Those found at high redshifts () challenge our understanding of blazar evolution models and are crucial for cosmological measurements of the Extragalactic Background Light. In this paper, we study a high- BL Lac, 4FGL J2146.5-1344, detected to be at =1.34 using the photometric dropout technique. We collected multi-wavelength data for this source from optical up to -rays, in order to study its spectral energy distribution (SED). In particular, this source was observed for the first time with NuSTAR, which accurately measures the synchrotron emission of this blazar up to 50 keV. Despite being classified as an HSP BL Lac object, the modeling of the SED reveals that this source likely belongs to the “masquerading BL Lac” class, which comprises of FSRQs appearing as disguised BL Lac objects.
,
1 Introduction
Blazars form the largest class of active galactic nuclei (AGN) detected in the Fourth Fermi-Large Area Telescope (Fermi-LAT) source catalog (4FGL; The Fermi-LAT collaboration, 2019), making up about 97% of the total AGN population in the 50 MeV - 1 TeV range. Displaying highly variable non-thermal emission credited to relativistic jets aligned very close to our line of sight (Blandford & Rees, 1978), blazar spectral energy distribution (SED) is typically characterised by two broad bumps, one at lower energies (Infrared to X-rays), attributed to synchrotron emission and inverse Compton scattering at higher energies (X-rays to -rays) (Maraschi et al., 1994; Abdo et al., 2011). The two sub-classes of blazars are BL Lacertae objects (BL Lacs) and Flat Spectrum Radio Quasars (FSRQs), mainly distinguished by their optical spectroscopic characteristics. BL Lacs have been observed to have either no or very weak (equivalent width <5Å) emission lines (Urry & Padovani, 1995), whereas FSRQs exhibit broad emission lines. The characteristic of BL Lacs indicates either an especially strong non-thermal continuum or atypically weak thermal disk/broad line emission which is mainly attributed to low accretion activity, jet dilution, or possibly both (Giommi et al., 2012a). Based on the frequency of synchrotron peak (), blazars are further classified into 3 categories (Abdo et al., 2010), namely: low-synchrotron peak blazars (LSP; Hz), intermediate-synchrotron peak blazars (ISP; Hz Hz) and high-synchrotron peak blazars (HSP; Hz). A sizable population of BL Lacs lie within the ISP and HSP category (Ackermann et al., 2015), exhibiting up to Hz. BL Lacs with such large are able to accelerate electrons to beyond 100 TeV (Costamante et al., 2001; Tavecchio et al., 2011), making them some of the most powerful accelerators in the Universe.
These BL Lacs are extremely crucial for the studies of extragalactic background light (EBL) (Ackermann et al., 2012; Abdollahi et al., et al. 2018), which constitutes the emission of all stars and accreting compact objects in the observable universe since the re-ionization epoch. Presence of the zodiacal light and Galactic emission (Hauser & Dwek, 2001) make direct studies of the EBL a challenging task. An indirect approach employed in measuring EBL intensity involves using -ray photons emitted by highly energetic sources (blazars). The interaction between these photons and the EBL ones causes an attenuation in the spectra (Stecker et al., 1992; Ackermann et al., 2012) of these -ray sources through a production of electron-positron pairs. This signature allows us to constrain EBL and study its evolution with redshift (Aharonian et al., 2006). Stronger attenuation is achieved when the -ray source is present at higher redshifts (), which leads to better EBL constraints. Therefore, on account of being bright -ray sources with significant emission 10 GeV, high redshift (high-) BL Lacs represent the perfect probes in indirect studies of the EBL.
Years of follow-up observations utilizing a range of techniques (Rau, A. et al., 2012; Shaw et al., 2014, 2013; Ajello et al., 2013; Kaur et al., 2017) has allowed us to gather redshift constraints for the 200 brightest Fermi BL Lacs. This approach yielded the discovery of a sizable number of BL Lacs at redshifts up to 2, some of which possess hard GeV spectra (photon index 2) and surprisingly belong to the HSP BL Lacs class.
Ghisellini et al. (2012) and Padovani et al. (2012) have proposed these candidates to be “blue FSRQs” (alternatively also called masquerading BL Lacs), i.e., sources whose relativistic jet aimed at us swamps any broad emission lines and thus are hidden by a bright synchrotron emission. Recent evidence for TXS 0506+056 (originally classified as BL Lac), the first plausible cosmic non-stellar neutrino source detected by the IceCube Collaboration (2018), suggests it could belong to the masquerading BL Lac class (Padovani et al., 2019). Although still very uncertain, this class may harbor cosmic neutrino emitters similar to TXS 0506+056. However, identifying such objects is challenging.
In this work, we focus on the high- source 4FGL J2146.5-1344, found by Kaur et al. (2017) to be at 1.34 using the photometric redshift technique. With the goal of identifying the nature of this source, we collected data from optical, UV and X-ray facilities. Indeed, the synchrotron emission from the jet peaks in these energy bands, hence the best approach to precisely characterize their jet properties is to accurately sample these wavelengths. To this end, we have obtained as a part of an approved Cycle 4 program222proposal number: 4231, PI: M. Ajello, data from the Nuclear Spectroscopic Telescope Array (NuSTAR, Harrison et al., 2013). Launched in June 2012, NuSTAR has been a critical instrument for HSP BL Lac studies. Spanning an energy range from 3-79 keV, NuSTAR’s capabilities enables us to sample the falling part of the synchrotron emission, allowing us to solidly constrain the shape of the underlying electron distribution as well as the jet properties such as the bulk Lorentz factor, magnetic field strength and jet power (Ghisellini et al., 2012).
| SARA AB Magnitudes | |||||
| g | r | i | z | ||
| 17.3990.018 | 17.1790.014 | 17.1010.018 | 16.6860.039 | ||
| Swift-UVOT Magnitudes | |||||
| UVW2 | UVM2 | UVW1 | U | B | V |
| 18.1320.076 | 18.0020.095 | 17.9400.095 | 17.6830.092 | 17.2840.102 | 17.1200.170 |
| Fermi-LAT | |||||
| Fluxb ( erg cm-2 s-1) | Counterpart | Radio Flux (mJy) | |||
| 1.710.04 | 1.330.11 | NVSS J214637-134359 | 22.951 | ||
| XMM + NuSTAR | |||||
| Fluxd ( erg cm-2 s-1) | (D.O.F.) | ||||
| 2.480.02 | 5.61160.003 | 0.96 (620) | |||
| aafootnotetext: Power-law -ray index from 4FGL.bbfootnotetext: -ray flux between 1-100 GeV from 4FGL.ccfootnotetext: X-ray power-law index obtained from XSPEC analysisddfootnotetext: Integrated X-ray flux from 0.1 to 80 keV obtained from XSPEC analysis | |||||
Furthermore quasi-simultaneous optical data from the Southeastern Association for Research in Astronomy (SARA, Keel et al., 2017) consortium’s 0.65m telescope in Chile and UV/Optical data from Neil Gehrels Swift Observatory’s UV/Optical Telescope (Swift-UVOT; Gehrels et al., 2004) were utilized along with X-ray and -ray data obtained from XMM-Newton (Jansen, F. et al., 2001) and Fermi-LAT (Acero et al., 2015), respectively, in order to construct a multi-wavelength SED of the source.
The order of the paper is as follows: Section 2 describes the details about the source selection. Section 3 elaborates the observations and data analysis methods and Section 4 elaborates the X-ray analysis method. Section 5 describes the modeling procedure while Section 6 discusses the results and conclusions. We use a flat CDM cosmological model with H km s-1 Mpc-1, , and .
2 TARGET SELECTION
4FGL J2146.5-1344 (J2146 from here on) is an HSP BL Lac first detected in the 1FGL catalog (Abdo et al., 2010) and then subsequently reported in all Fermi-LAT catalogs (Nolan et al., 2012; Acero et al., 2015; The Fermi-LAT collaboration, 2019). Found to be a high- source (1.34) by Kaur et al., 2017 as a part of the photometric campaign for BL Lacs begun by Rau, A. et al., 2012, J2146 exhibits a synchrotron peak frequency of 1016 Hz, a luminosity in excess of 1047 erg s-1, and a very hard -ray spectrum with photon index 1.6. The considerable emission at 100 GeV (Ajello et al., 2017) also makes it a powerful tool to probe EBL, since at =1.34 the universe is already opaque to the propagation of E 100 GeV photons (optical depth, 1.3; Domínguez et al., 2011). This implies that these high- HSP sources can help constrain the cosmic -ray horizon, which is defined by the energy at which the optical depth () is 1, as a function of redshift.
3 OBSERVATIONS AND DATA ANALYSIS
3.1 Fermi-LAT
Data at -ray energies for J2146 is provided in the fourth Fermi-LAT source catalog (The Fermi-LAT collaboration, 2019), which includes all the sources detected at energies between 50 MeV and 1 TeV. -ray flux from 1-100 GeV and the uncertainty associated is shown in Table 1. Both 3FGL and 4FGL catalogs report the source as non-variable and since the source is absent from the 2FAV catalog (Abdollahi et al., 2017), we are able to use the data from 4FGL catalog for the SED construction of this source.
3.2 NuSTAR
J2146 was observed by NuSTAR on 18 May 2018 for 42.3 ks. Data was processed for both the instrument Focal Plane Modules A (FPMA) and B (FPMB) using the NuSTAR Data Analysis Software, NuSTARDAS, integrated in the HEASoft v.6.21333https://heasarc.nasa.gov/lheasoft/ software package. Calibrations were performed using the nupipeline task (response file obtained from the latest CALDB database, v.20180419). For the source extraction, a circular region of radius 30 was centered on the coordinates of the target and a background circular region of 30 radius was placed in the same frame, avoiding possible contamination from source photons to provide a good signal-to-noise ratio. These events were operated on by the task nuproducts in order to generate the spectra and matrix files. The spectra obtained were rebinned to have 15 counts per bin.
3.3 XMM-Newton
The X-ray Multi-Mirror Mission spacecraft (XMM-Newton), launched by the European Space Agency (ESA), consists of three X-ray telescopes equipped at their foci with set of three X-ray CCD cameras: MOS1, MOS2 (Metal Oxide Semi-conductor), and the European Photon Imaging Camera (EPIC) pn CCD. In the energy range from 0.2 to 12 keV, XMM-Newton allows us to observe sources with extreme sensitivities over the telescope’s field of view. J2146 was observed by XMM-Newton on 18 May 2018 for 17 ks. Observations for the source were obtained and processed for all three CCD arrays. The XMM-Newton Science Analysis Software (SAS) v16.0.0. was employed for data reduction and tasks emproc and epproc were used for generating event files for MOS and pn respectively. Source and background spectra were generated using evselect after extracting source and background regions of 10 and 20 respectively. The spectra obtained were rebinned to have 15 counts per bin.
3.4 Swift and SARA
The X-ray data was supplemented by optical observations from the SARA consortium’s 0.65m telescope at Cerro Tololo, Chile (SARA-CT) and UV/Optical observations from the Swift satellite (Gehrels et al., 2004).
Data was gathered with SARA-CT on 27 August 2018 sequentially in 4 filters (g′, r′, i′, z′) and Swift-UVOT (The Ultraviolet and Optical Telescope; Roming et al., 2005) conducted observations of the source in 6 filters (uvw2, uvm2, uvw1, u, b, v) on 23 June 2018, obtaining data for 2000 s.
Optical data was reduced using the photometry technique with the help of the software package, IRAF (v2.16; Tody, 1986). Standard star calibrations were performed using the SDSS Data Release 13 (Albareti et al., 2017) and Galactic foreground extinction corrections were made using Schlafly & Finkbeiner, 2011.
Swift-UVOT data reduction employed the use of the standard UVOT pipeline procedure (Poole et al., 2008) to obtain the magnitudes of the source in each filter. This was achieved using HEASoft v.6.21444https://heasarc.nasa.gov/lheasoft/ software and the tasks therein. The task uvotimsum was used to combine image snapshots obtained from multiple observations and task uvotsource was used to obtain the magnitudes and errors. A source region of radius 5 and a background region of 25 was selected in order to maximize the signal-to-noise ratio and subtract the background. The obtained magnitudes were corrected for Galactic foreground extinction using Table 5 presented in Kataoka et al. (2008) and converted to AB system.
4 X-ray Spectral Analysis
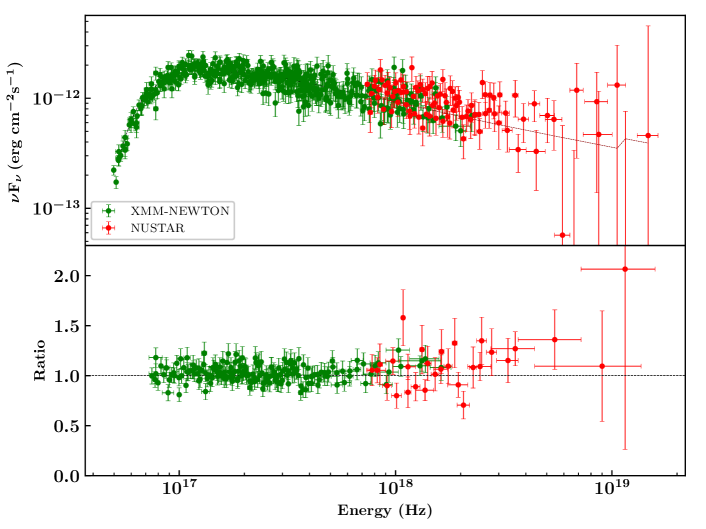
The X-ray spectral analysis for XMM-Newton and NuSTAR spectra was carried out using the XSPEC tool (also provided in the HEASoft package). We obtained the Galactic column density (NH) for the source using Kalberla, P. M. W. et al. (2005) and employed a -fitting procedure which used a simple power law model with a multiplicative constant factor to fit the source. The constant was fixed at unity for EPIC pn and left free for all other instruments in order to calibrate them against each other. The flux of FPMA was found to be 20% of FPMB. Upon investigation, it was established that the source falls in a chip gap between the two focal planes accounting for the loss of photons. In order to account for this discrepancy, we separately fitted with XSPEC both NuSTAR focal modules using a simple power law. The resulting fluxes and indices are consistent for both FPMA and FPMB considering the errors so the gap does not influence our X-ray analysis. Furthermore, we tested for a possible curvature in the spectrum of the source. We jointly fitted XMM-Newton and NuSTAR with a log-parabolic model (logpar in XSPEC) and a broken power-law one (bknpo in XSPEC), always keeping the galactic NH fixed. The outcomes of the spectral fits did not provide any significant improvement with respect to the simple power law. Results using the F-test returned p-values , hence, any curvature in the X-ray spectrum of our source can be excluded. The parameters obtained from the model fit are shown in Table 1 and the model fit is depicted in the Figure 1.
5 modeling
To explain the SED of J2146, a single-zone leptonic emission model is adopted. In this Section, we highlight its general outline (see Ghisellini & Tavecchio, 2009, for more details). The radiation is assumed to be produced by relativistic electrons enclosed in a spherical region distant from the black hole. This region encompasses the total jet cross-section and moves with a bulk Lorentz factor, . The electrons are distributed in energy according to a broken power-law shape of the type:
| (1) |
where is the energy break and p and q are the slopes before and after the break.
The particles are embedded in an uniform and randomly oriented magnetic field (). As a consequence, they accelerate and thereafter radiate via synchrotron process. In presence of an external radiation field they also lose energy via Inverse Compton process. In the model, both synchrotron self Compton (SSC) and External Compton (EC) are taken into account. In the SSC case, photons produced by synchrotron emission are up-scattered to higher energies by the same electron population. For the EC, the electrons instead interact with photons external to the jet, up-scattering them to high-energies. The following are considered as reservoirs of low-energy photons:
- •
-
•
The X-ray corona above the disk. Its spectrum is considered to be a power-law with exponential cut-off reprocessing 30% of disk emission;
-
•
The broad line region (BLR) clouds. Modeled as a spherical shell at the distance, cm, where is the accretion disk luminosity in units of 1045 erg s-1, from the black hole, it reprocesses 10% of the disk emission. Its spectrum is a black-body peaking at the Lyman- frequency;
-
•
The infrared torus. Similarly to the BLR, it is considered a spherical shell at cm, re-radiating 50% of the disk emission. Its black-body spectrum peaks at the typical torus temperature of 300 K.
The energy densities of all components depend on and are evaluated by the model.
As for the black hole mass, we found that the source optical spectrum is reported in Shaw et al. (2013), along with a redshift lower limit of 0.71 and an upper limit of 1.64, consistent with its measured photometric one (Kaur et al., 2017). Although no bright emission lines are detected, the authors estimate the black hole mass of the studied BL Lacs from the relationship with the host galaxy, and found an average of (with large dispersion) 555In the same work, authors report masses found spectroscopically for Fermi FSRQs which have . Similarly, Sbarrato et al. (2012) found an average mass for LAT detected FSRQs of and Paliya et al., 2017 derived an average mass of for radio-loud (i.e. jetted) CGrabs (Healey et al., 2008) quasars using a model dependent approach. We therefore use these ranges for our assumptions on the black hole mass of J2146. Moreover, since the disk emission is overwhelmed by the non-thermal synchrotron one, if detected, it would result in a visible hump in the optical part of the SED. Further constraints on the disk luminosity come from empirical relations (see Sbarrato et al., 2012; Ghisellini et al., 2012). Following Sbarrato et al. (2012), we can roughly compute the BLR luminosity () from the -ray luminosity of our source () through the following relationship: . In the case of J2146, erg s-1, hence erg s-1. Assuming that the BLR reprocesses 10% of the disk emission, this implies erg s-1.
The total jet power is computed as the sum of its four components: electron, proton, radiative and magnetic power. Protons are assumed to be the main carrier of kinetic jet power. They are considered to be cold, hence not radiating and only contributing to the inertia of the jet. Number densities of protons and electrons are assumed equal (see Celotti & Ghisellini, 2008) and contribution of pairs is not included in the model. Since the source has significant emission above GeV and up to 100 GeV (HEP = 90.02 GeV; Ajello et al. (2017)), knowledge of its redshift allows us to include the EBL attenuation (see Finke et al., 2010; Domínguez et al., 2011; Abdollahi et al., et al. 2018; Desai et al., 2019). In order to do so, a multiplicative factor is introduced in the IC spectra (both SSC and EC):
| (2) |
where is the observed IC intensity, is the intrinsic emitted one from the source, is the redshift of the source and is the optical depth as function of and energy, . For this work, we use as provided by Finke et al. (2010).
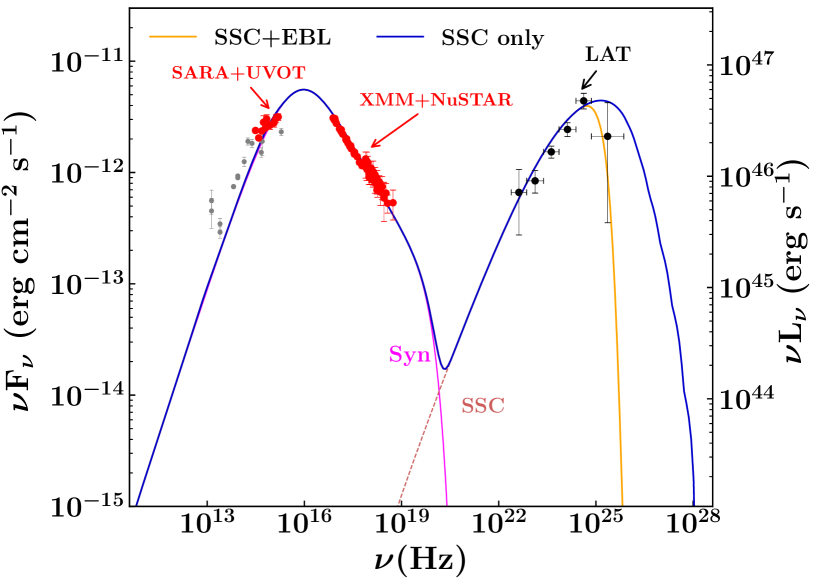
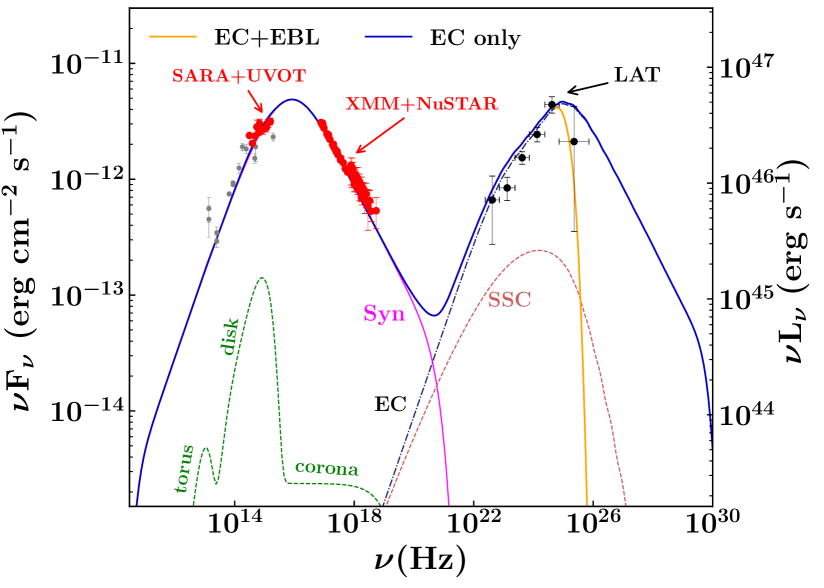
With the goal of testing whether the source is more likely to be a high-luminosity BL Lac or a ‘masquerading BL Lac’ (or a ‘blue FSRQ’), we separately model the source with a simple synchrotron and SSC scenario (which usually explains BL Lacs SEDs, hereafter SSC) and synchrotron, SSC and EC scenario (which usually explains FSRQs SEDs). Once the best-fit parameters are found for these two cases, we include the EBL contribution. The results of the modeling are shown in Figure 2 and 3 and are discussed in details in the Section below. All derived parameters are listed in Table 2.
| Parameter | SSC | EC |
| Black hole mass () in log scale [ ] | 8.7 | 8.7 |
| Accretion disk luminosity () in log scale [erg s-1] | 45.3 | 45.3 |
| Accretion disk luminosity in Eddington units () | 0.03 | 0.03 |
| Size of the BLR () [pc ()] | – | 0.04 (957.78) |
| Dissipation distance () [pc ()] | 0.09 (2000) | 0.06 (1325) |
| Slope of the particle distribution below the break energy () | 1.45 | 1.75 |
| Slope of the particle distribution above the break energy () | 4.0 | 4.0 |
| Magnetic field () [G] | 0.20 | 2.6 |
| Particle energy density () [erg cm-3] | ||
| Bulk Lorentz factor () | 17 | 15 |
| Minimum Lorentz factor () | 1 | 1 |
| Break Lorentz factor () | ||
| Maximum Lorentz factor () | ||
| Jet power in electrons () in log scale [erg s-1] | 43.77 | 42.60 |
| Jet power in magnetic field () in log scale [erg s-1] | 43.57 | 45.37 |
| Radiative jet power () in log scale [erg s-1] | 44.93 | 44.89 |
| Jet power in protons () in log scale [erg s-1] | 44.66 | 44.46 |
| Total jet power () in log scale [erg s-1] | 44.75 | 45.39 |
6 Discussions & Conclusions
The source J2146 is one of the soft X-ray brightest ( erg s-1) and high- blazars detected by the Fermi-LAT. With Hz, it is among the few high-power HSP blazars so far discovered (Although Masetti et al. (2013) reclassified this source as an ISP BL Lac instead of an HSP one). Only a handful of similar objects have been found (see Padovani et al., 2012; Ghisellini et al., 2012) and, together with our source, they challenge our understanding of the blazar population and the physical processes powering them. In fact, according to the so-called ‘blazar sequence’ (see e.g. Fossati et al., 1998; Ghisellini & Tavecchio, 2008; Ghisellini et al., 2017) these kind of high-power HSP blazars should not exist. In the works of Padovani et al. (2012) and Ghisellini et al. (2012), the authors have established that these blazars are more likely ‘blue-FSRQs’ (or ‘masquerading BL Lacs’, i.e. FSRQs with emission lines saturated by the non-thermal synchrotron emission) rather than BL Lac-type sources. Indeed, their high radio power (), high synchrotron peak luminosity ( erg s-1) and Hz are all factors that make them resemble more FSRQs than BL Lacs (see Giommi et al., 2012a, b). Unveiling the nature of J2146 (i.e. whether it is a ‘masquerading BL Lac’ or an HSP BL Lac) is important in the context of the blazar sequence and to test the cosmological models of the EBL. Moreover, J2146 is among the most luminous accelerators in our Universe and its emission up to 100 GeV makes it an excellent probe to test cosmological models of the EBL.
Lacking absorption lines in the optical spectra (Shaw et al., 2013), in order to understand the nature of this blazar and to constrain the jet properties, it is necessary to obtain a multi-wavelength coverage of the source, from radio up to -rays. Availability of quasi-simultaneous optical and X-ray data enables us to accurately constrain the position of the as well as shape of the underlying electron distribution, which in turn provides us with good estimates for the jet power. In particular, the capabilities of NuSTAR allow us to sample the falling part of the synchrotron spectrum up to 50 keV. The source shows a very soft spectral index in this regime (), which is reflective of the shape of the underlying electron emitting population. Moreover, if present, a curvature in the hard X-ray spectra would have hinted towards an intrinsic curvature in the particle spectrum and would have been reflected in the falling part of the -ray spectrum. The lack of such feature in the X-ray continuum (see Section 4) indicates that any curvature above GeV is likely due to EBL absorption.666Our model does not include the Klein-Nishina effect which would produce a steeper high-energy IC spectrum (Georganopoulos et al., 2001; Ackermann et al., 2010; Dermer & Lott, 2012). However, this effect should also be visible in the X-ray part of synchrotron spectrum, and therefore already constrained by our found . The sharp cut-off in the -ray band could not be explained but this effect alone.
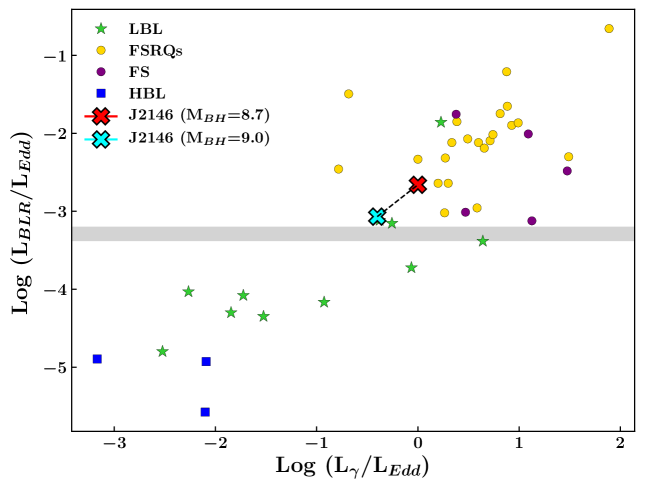
From a modeling perspective, both the EC and SSC appear to return equally good fits. The parameters obtained for the two models (see Table 2) and the jet power components are in agreement with what found by Ghisellini et al. (2012). We note that to explain the FSRQ-like emission (i.e. EC model), we need to impose the location of the emission region beyond the BLR clouds (and within the torus), conforming to what is reported in Ghisellini et al. (2012). Hence, the main photon energy density contributing to the EC is the torus one. This is in agreement with the recent results of Costamante et al., 2018 and Meyer et al., 2019, who found the emission region location outside the BLR while studying the emission of Fermi-LAT broad-line blazars. However, if this source is an FSRQ, it would need to support a very high radiative power, even larger than the kinetic one. Therefore, the jet would be radiatively and magnetically dominated in contrast with what is usually expected for FSRQs. In the SSC scenario, we point out that in order to explain the SED, we require a steeper index of the electron distribution below the break () which does not provide a very good fit to the optical and archival data. Comparing the BLR and -ray luminosity of J2146 with other Fermi detected blazars analyzed by Ghisellini et al. (2011), we can see in Figure 4 how our source falls in the region typically occupied by FSRQs. Nonetheless, since we do not have strong constraints on the black hole mass of the object from either spectroscopy or photometric data, we tested how the position of the source would change for a higher black hole mass of . From Figure 4, it can be seen how the source will still fall above the BL Lac/FSRQ divide. Also, since the synchrotron peak luminosity is erg s-1 and the radio power of our source is (Condon et al., 1998), these values are more consistent with FSRQs than BL Lacs. Overall, even though a firm conclusion on the nature of J2146 cannot be made, comparing it with the other similar objects studied in the works of Padovani et al. (2012) and Ghisellini et al. (2012), it could likely belong to the class of ‘masquerading BL Lacs’.
Finally, using the model from Finke et al. (2010) we are able to well model the curvature in the -ray spectrum. BL Lac-like sources with emission beyond GeV are of incredible value for studies of the EBL. Indeed, the absorption due to the annihilation of the source -rays with EBL photons is a tracer for the EBL intensity and it is effective beyond GeV. However, a lack of redshift measurements for half of the BL Lac population has hindered accurate measurements of the EBL so far. The new photometric redshift measurements of BL Lacs (Rau, A. et al., 2012; Kaur et al., 2017) represent a new avenue to use BL Lacs as EBL probes. As can be seen from Figure 2 and 3, the -ray part of J2146 SED shows a very steep fall off which is perfectly explained by EBL absorption at the redshift of the source. This points to the fact that sources such as J2146 would represent perfect probes for constraining and testing EBL models. In fact, prediction of many such models diverge as redshift increases, and the uncertainties associated get larger. Therefore, a systematic multi-wavelength study of more such blazars would allow for tighter constraints on the EBL measurements.
This research has made use of data obtained through the High Energy Astrophysics Science Archive Research Center Online Service, provided by the NASA/Goddard Space Flight Center. This research has made use of the NASA/IPAC Extragalactic Database (NED), which is operated by the Jet Propulsion Laboratory, California Institute of Technology,under contract with the National Aeronautics and Space Administration. Part of this work is based on archival data,software or online services provided by the ASI Data Center (ASDC).
The reported work is partly based on the observations obtained with the SARA Observatory telescope at Chile (SARA-CT), which is owned and operated by the Southeastern Association for Research in Astronomy (saraobservatory.org). More information about SARA can be found in DOI: 10.1088/1538-3873/129/971/015002.
MR, LM and MA acknowledge funding under NASA Contract 80NSSC18K1619. The authors acknowledge the prompt observation of the source by Swift.
References
- Abdo et al. (2011) Abdo, A. A., Ackermann, M., Ajello, M., et al. 2011, The Astrophysical Journal, 727, 129
- Abdo et al. (2010) Abdo, A. A., Ackermann, M., Ajello, M., et al. 2010, ApJ, 723, 1082
- Abdo et al. (2010) Abdo, A. A., Ackermann, M., Ajello, M., et al. 2010, The Astrophysical Journal Supplement Series, 188, 405
- Abdollahi et al. (2017) Abdollahi, S., Ackermann, M., Ajello, M., et al. 2017, The Astrophysical Journal, 846, 34
- Abdollahi et al. (et al. 2018) Abdollahi, S., Ackermann, M., Ajello, M., & Atwood, W. et al. 2018, Science, 362, 1031
- Acero et al. (2015) Acero, F., Ackermann, M., Ajello, M., et al. 2015, ApJS, 218, 23
- Ackermann et al. (2010) Ackermann, M., Ajello, M., Baldini, L., et al. 2010, ApJ, 721, 1383
- Ackermann et al. (2012) Ackermann, M., Ajello, M., Allafort, A., et al. 2012, Science, 338, 1190
- Ackermann et al. (2015) Ackermann, M., Ajello, M., Atwood, W. B., et al. 2015, The Astrophysical Journal, 810, 14
- Aharonian et al. (2006) Aharonian, F., Akhperjanian, A. G., Bazer-Bachi, A. R., et al. 2006, Nature, 440, 1018
- Ajello et al. (2013) Ajello, M., Romani, R. W., Gasparrini, D., et al. 2013, The Astrophysical Journal, 780, 73
- Ajello et al. (2017) Ajello, M., Atwood, W. B., Baldini, L., et al. 2017, The Astrophysical Journal Supplement Series, 232, 18
- Albareti et al. (2017) Albareti, F. D., Allende Prieto, C., Almeida, A., et al. 2017, ApJS, 233, 25
- Blandford & Rees (1978) Blandford, R. D., & Rees, M. J. 1978, Physica Scripta, 17, 265
- Celotti & Ghisellini (2008) Celotti, A., & Ghisellini, G. 2008, MNRAS, 385, 283
- Condon et al. (1998) Condon, J. J., Cotton, W. D., Greisen, E. W., et al. 1998, AJ, 115, 1693
- Costamante et al. (2018) Costamante, L., Cutini, S., Tosti, G., Antolini, E., & Tramacere, A. 2018, MNRAS, 477, 4749
- Costamante et al. (2001) Costamante, L., Ghisellini, G., Giommi, P., et al. 2001, A&A, 371, 512
- Dermer & Lott (2012) Dermer, C., & Lott, B. 2012, in Journal of Physics Conference Series, Vol. 355, Journal of Physics Conference Series, 012010
- Desai et al. (2019) Desai, A., Helgason, K., Ajello, M., et al. 2019, The Astrophysical Journal, 874, L7
- Domínguez et al. (2011) Domínguez, A., Primack, J. R., Rosario, D. J., et al. 2011, Monthly Notices of the Royal Astronomical Society, 410, 2556
- Finke et al. (2010) Finke, J. D., Razzaque, S., & Dermer, C. D. 2010, The Astrophysical Journal, 712, 238
- Fossati et al. (1998) Fossati, G., Celotti, A., Ghisellini, G., Maraschi, L., & Comastri, A. 1998, Monthly Notices of the Royal Astronomical Society, 299, 433
- Frank et al. (2002) Frank, J., King, A., & Raine, D. J. 2002, Accretion Power in Astrophysics, by Juhan Frank and Andrew King and Derek Raine, pp. 398. ISBN 0521620538. Cambridge, UK: Cambridge University Press, February 2002
- Gehrels et al. (2004) Gehrels, N., Chincarini, G., Giommi, P., et al. 2004, The Astrophysical Journal, 611, 1005
- Georganopoulos et al. (2001) Georganopoulos, M., Kirk, J., & Mastichiadis, A. 2001, in International Cosmic Ray Conference, Vol. 7, International Cosmic Ray Conference, 2705
- Ghisellini et al. (2017) Ghisellini, G., Righi, C., Costamante, L., & Tavecchio, F. 2017, Monthly Notices of the Royal Astronomical Society, 469, 255
- Ghisellini & Tavecchio (2008) Ghisellini, G., & Tavecchio, F. 2008, Monthly Notices of the Royal Astronomical Society, 387, 1669
- Ghisellini & Tavecchio (2009) Ghisellini, G., & Tavecchio, F. 2009, MNRAS, 397, 985
- Ghisellini et al. (2011) Ghisellini, G., Tavecchio, F., Foschini, L., & Ghirlanda, G. 2011, Monthly Notices of the Royal Astronomical Society, 414, 2674
- Ghisellini et al. (2012) Ghisellini, G., Tavecchio, F., Foschini, L., et al. 2012, Monthly Notices of the Royal Astronomical Society, 425, 1371
- Giommi et al. (2012a) Giommi, P., Padovani, P., Polenta, G., et al. 2012a, MNRAS, 420, 2899
- Giommi et al. (2012b) Giommi, P., Polenta, G., Lähteenmäki, A., et al. 2012b, A&A, 541, A160
- Harrison et al. (2013) Harrison, F. A., Craig, W. W., Christensen, F. E., et al. 2013, The Astrophysical Journal, 770, 103
- Hauser & Dwek (2001) Hauser, M. G., & Dwek, E. 2001, Annual Review of Astronomy and Astrophysics, Vol. 39, p. 249-307 (2001)., 39, 249
- Healey et al. (2008) Healey, S. E., Romani, R. W., Cotter, G., et al. 2008, ApJS, 175, 97
- IceCube Collaboration (2018) IceCube Collaboration. 2018, Science, 361, 147
- Jansen, F. et al. (2001) Jansen, F., Lumb, D., Altieri, B., et al. 2001, A&A, 365, L1
- Kalberla, P. M. W. et al. (2005) Kalberla, P. M. W., Burton, W. B., Hartmann, Dap, et al. 2005, A&A, 440, 775
- Kataoka et al. (2008) Kataoka, J., Madejski, G., Sikora, M., et al. 2008, The Astrophysical Journal, 672, 787
- Kaur et al. (2017) Kaur, A., Rau, A., Ajello, M., et al. 2017, The Astrophysical Journal, 834, 41
- Keel et al. (2017) Keel, W. C., Oswalt, T., Mack, P., et al. 2017, PASP, 129, 015002
- Maraschi et al. (1994) Maraschi, L., Ghisellini, G., & Celotti, A. 1994, IAU Symposium No. 159: Multi-wavelength continuum emission of AGN
- Masetti et al. (2013) Masetti, N., Sbarufatti, B., Parisi, P., et al. 2013, A&A, 559, A58
- Meyer et al. (2019) Meyer, M., Scargle, J. D., & Blandford, R. D. 2019, ApJ, 877, 39
- Nolan et al. (2012) Nolan, P. L., Abdo, A. A., Ackermann, M., et al. 2012, The Astrophysical Journal Supplement Series, 199, 31
- Padovani et al. (2012) Padovani, P., Giommi, P., & Rau, A. 2012, Monthly Notices of the Royal Astronomical Society: Letters, 422, L48
- Padovani et al. (2019) Padovani, P., Oikonomou, F., Petropoulou, M., Giommi, P., & Resconi, E. 2019, Monthly Notices of the Royal Astronomical Society: Letters, 484, L104
- Paliya et al. (2017) Paliya, V. S., Marcotulli, L., Ajello, M., et al. 2017, ApJ, 851, 33
- Poole et al. (2008) Poole, T. S., Breeveld, A. A., Page, M. J., et al. 2008, Monthly Notices of the Royal Astronomical Society, 383, 627
- Rau, A. et al. (2012) Rau, A., Schady, P., Greiner, J., et al. 2012, A&A, 538, A26
- Roming et al. (2005) Roming, P. W. A., Kennedy, T. E., Mason, K. O., et al. 2005, SSRv, 120, 95
- Sbarrato et al. (2012) Sbarrato, T., Ghisellini, G., Maraschi, L., & Colpi, M. 2012, Monthly Notices of the Royal Astronomical Society, 421, 1764
- Schlafly & Finkbeiner (2011) Schlafly, E. F., & Finkbeiner, D. P. 2011, ApJ, 737, 103
- Shakura & Sunyaev (1973) Shakura, N. I., & Sunyaev, R. A. 1973, A&A, 24, 337
- Shaw et al. (2014) Shaw, J. R., Sigurdson, K., Pen, U.-L., Stebbins, A., & Sitwell, M. 2014, The Astrophysical Journal, 781, 57
- Shaw et al. (2013) Shaw, M. S., Romani, R. W., Cotter, G., et al. 2013, The Astrophysical Journal, 764, 135
- Stecker et al. (1992) Stecker, F. W., de Jager, O. C., & Salamon, M. H. 1992, The Astrophysical Journal, 390, L49
- Tavecchio et al. (2011) Tavecchio, F., Ghisellini, G., Bonnoli, G., & Foschini, L. 2011, Monthly Notices of the Royal Astronomical Society, 414, 3566
- The Fermi-LAT collaboration (2019) The Fermi-LAT collaboration. 2019, arXiv e-prints, arXiv:1902.10045
- Tody (1986) Tody, D. 1986, Proc. SPIE, 0627, 733
- Urry & Padovani (1995) Urry, C. M., & Padovani, P. 1995, Publ. Astron. Soc. Pac., 107, 803