58 \jyear2020 \jnotesubmitted 2019/09/15; accepted 2019/11/15. An edited final version will be published later in 2020
Observations of Protoplanetary Disk Structures
Abstract
The disks that orbit young stars are the essential conduits and reservoirs of material for star and planet formation. Their structures, meaning the spatial variations of the disk physical conditions, reflect the underlying mechanisms that drive those formation processes. Observations of the solids and gas in these disks, particularly at high resolution, provide fundamental insights on their mass distributions, dynamical states, and evolutionary behaviors. Over the past decade, rapid developments in these areas have largely been driven by observations with the Atacama Large Millimeter/submillimeter Array (ALMA). This review highlights the state of observational research on disk structures, emphasizing three key conclusions that reflect the main branches of the field:
Relationships among disk structure properties are also linked to the masses, environments, and evolutionary states of their stellar hosts;
There is clear, qualitative evidence for the growth and migration of disk solids, although the implied evolutionary timescales suggest the classical assumption of a smooth gas disk is inappropriate;
Small-scale substructures with a variety of morphologies, locations, scales, and amplitudes – presumably tracing local gas pressure maxima – broadly influence the physical and observational properties of disks.
The last point especially is reshaping the field, with the recognition that these disk substructures likely trace active sites of planetesimal growth or are the hallmarks of planetary systems at their formation epoch.
keywords:
protoplanetary disks, planet formation, circumstellar matter1 INTRODUCTION
1.1 Motivation
The formation and early evolution of stars and planetary systems are mediated by interactions with their circumstellar material. That material is organized in a flattened disk of gas and solids that orbits the central host star. Although these interactions between stars, planets, and disks are brief (lasting 10 Myr), they are literally foundational: such mutual influences set some stellar and planetary properties that persist for billions of years. The hallmarks of the processes that govern these links are imprinted on the disk structures, the spatial distributions and physical conditions of the disk material. Detailed observations enable measurements of those structures, their environmental dependencies, and their evolutionary behavior. Coupled with theoretical simulations and complemented by the collective knowledge of stellar populations, exoplanets, and primitive bodies in the solar system, those measurements help map out how disks shape star and planet formation.
These disks and their initial structures are seeded when a star is made. Star formation begins with the gravitational collapse of an over-dense core in a molecular cloud. An initial nudge that imparts some core rotation means that material collapsing from its outer regions (with higher angular momentum) is channeled onto a disk, rather than the protostar itself (Terebey et al., 1984). In that sense, disks are simple consequences of angular momentum conservation. Measurements of young disk structures, still embedded in their natal core material, can reveal much about the star formation process: their sizes help distinguish the roles that magnetic fields have in regulating core collapse; their masses help constrain protostellar accretion rates; and their density distributions encode the angular momentum transport that ultimately determines the stellar mass (see the review by Li et al. 2014).
Disks are also the material reservoirs and birthplaces of planetary systems. The prevalence, formation modes, masses, orbital architectures, and compositions of planets depend intimately on the physical conditions in the disk at their formation sites, the evolution of that disk structure (locally and globally), and the planetary migration driven by dynamical interactions with the disk material. Measurements of the disk mass, its spatial distribution, and its demographic dependences offer crucial boundary conditions for models of planet formation. Combined with the properties observed in the mature exoplanet population, that information can help develop and refine a predictive formation theory, despite the considerable complexity of the associated physical processes (e.g., Benz et al., 2014).
1.2 Observational Primer
In these and many other ways, disk structures offer profound insights on how the properties of stars and planetary systems are shaped by their origins. This review is focused on the recent landscape of observational constraints on disk structures: how relevant measurements are made, what they suggest about disk properties, and how those properties are connected to star and planet formation. The most valuable measurements employ data with high angular resolution, as the typical nearby ( pc) disk subtends 1′′ on the sky. Most of any given disk is cool enough ( 100 K) that it emits efficiently at (sub-)mm wavelengths. Coupling these small angular sizes and cool temperatures, this review emphasizes radio interferometry as an essential tool. Indeed, progress over the past decade has largely been driven by the commissioning of the transformational ALMA facility.
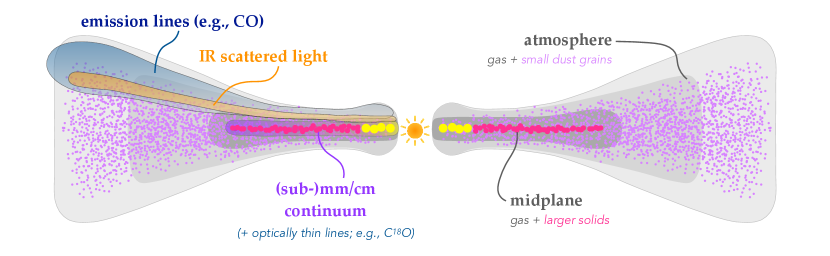
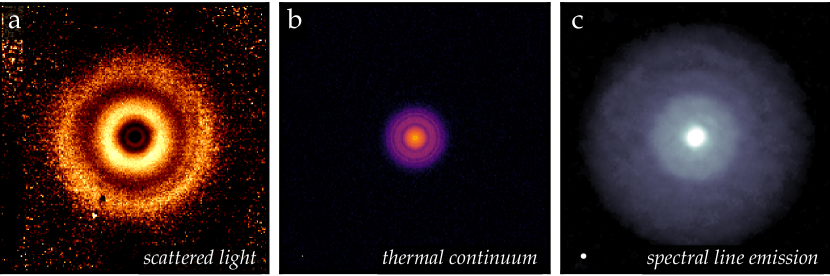
Three categories of observational tracers are used to study disk structures: scattered light, thermal continuum emission, and (primarily molecular) spectral line emission. The first two are sensitive to the physical conditions and distribution of the solids, and the third is used to measure the properties of the gas. Figure 1 shows a schematic diagram that highlights the basic aspects of disk structure and the (two-dimensional) locations where these tracers originate. Each of these probes is sensitive to different materials and physical conditions, ensuring considerable diversity in the disk appearance when viewed in different tracers. An illustrative example is shown in Figure 2.
1.2.1 Scattered Light
Small (m-sized) dust grains suspended in the gas at a suitable altitude in the disk atmosphere reflect the radiation emitted by the host star. This scattered light is sensitive to the radial variation of the vertical height of the dust distribution (Section 9.2). The spectral and polarization behavior of the scattered light constrain the albedos, set by the sizes, shapes, and compositions of the grains (Section 9.1). The practical advantage of this tracer is resolution: adaptive optics systems operating near the diffraction limit on 8–10 m telescopes measure features at 30–50 milliarcsecond scales (5 au at the typical distances of nearby star-forming regions, 150 pc). The important challenges include: contrast with the host star, preventing measurements in the innermost disk ( 10 au); sensitivity at large radii, due to the dilution of the stellar radiation field; and technical limits on the host star brightness. Taken together, those issues bias the current sample of resolved scattered light measurements toward disks with more massive hosts.
1.2.2 Continuum Emission
Disk solids emit a thermal continuum that spans four decades in wavelength (m–1 cm). Most of that emission is optically thick, and therefore a temperature diagnostic. Optical depths () decrease with ; the transition to is traditionally expected in the sub-mm. In the optically thin limit, the intensity () scales with the surface density of solids (; Section 3.1, 4.2), and its spectral dependence is sensitive to the solid particle properties (Section 9.2). This tracer is bright, accessible at high resolution (to 10–20 milliarcseconds, or 2 au), and has no stellar contrast limitations. Accordingly, measurements are plentiful: much of the collective knowledge about disk structures is based on mm continuum data. The disadvantages arise from ambiguities in the detailed particle properties and the validity of the optically thin approximation (Sections 8 and 10).
1.2.3 Spectral Line Emission
The most abundant molecule in a disk (H2) does not have a permanent dipole moment and does not emit efficiently over the vast majority of the disk volume. The bulk of the gas in a disk is essentially ‘dark’, and there is no direct probe of its mass reservoir. Instead, measurements rely on the spectral line emission from (sub-)mm rotational transitions of rare tracer molecules. Optically thick line intensities are sensitive to the temperature in the atmospheric layer that corresponds to the line photosphere (Section 4.3). At low optical depths, line intensities are a function of both temperature and density. If the abundance of a given species relative to H2 (denoted here as Xj for molecule ) is known, spatially resolved maps of optically thin line emission constrain the gas surface density profile, (Section 3.1, 4.2). Moreover, spectrally resolved line emission can be used to tomographically reconstruct the disk velocity field (Section 4.4).
ALMA is now capable of resolving emission lines at tens of milliarcsecond scales (5 au) in velocity channels only a few m s-1 wide, but the narrow bandwidths and low abundances of trace molecular species mean that sensitivity is a perennial challenge for disk measurements. Accordingly, line measurements of disks are much less common than for the continuum. The most prominent obstacles in interpreting spectral line data are high optical depths, confusion with the emitting layer height (when resolution is limited), and the large (potentially orders of magnitude) uncertainties in the molecular abundances (Xj).
1.3 Statement of Scope
Keeping in mind the motivations for measuring disk structures and the observational tools that are now available, this review covers four broad (and inter-related) topics that occupy much of the effort in the disk research community: inferred physical characteristics of disk structures and their ambiguities (Section 2); empirical constraints on evolutionary and environmental dependencies based on demographics studies (Section 6); evidence for (and problems with) the growth and migration of disk solids (Section 8); and the properties and roles of small-scale substructures in shaping observables and facilitating planet formation (Section 10). The review concludes with a brief synopsis that summarizes the current state of the field and some suggestions of potentially fruitful avenues for future work (Section 11).
2 KEY STRUCTURE PROPERTIES
The spatial distribution of mass – the density structure – is without question the fundamental property of interest for disks. The conceptual orientation of the entire field presumes that disk evolution is deterministic: in principle, a collection of density structure measurements that span an appropriate range of environmental and evolutionary states could be used to work out the mechanics of key evolutionary processes. This section of the review is focused on the underlying motivations, observational constraints, and lingering ambiguities associated with the mass distributions in disks (Sections 3.1–4.2). The intrinsic connections (physical and observational) between the density structure and the thermal and dynamical state of the disk material are summarized in Sections 4.3 and 4.4, respectively.
[t]
3 Notation, Conventions, and Nomenclature
To simplify discussions, variable notations are used throughout this review. Cylindrical coordinates define the disk frame of reference for these properties, where (, , ) correspond to the radial distance from the star, the azimuthal angle around the disk, and the height above the disk midplane, respectively. Many structural and observational properties vary in three dimensions. To minimize complexity and avoid confusion, the convention is to explicitly note spatial dependencies only when the spatial behavior is directly relevant (e.g., most discussion presumes azimuthal symmetry). For example: is shorthand for the local value ); refers to a radial profile at a given (e.g., the midplane) or generic , depending on the context; and refers to a disk-averaged quantity, .
3.1 Mass
With a limited number of resolved disk measurements, more emphasis is placed on masses than density distributions. Nevertheless, the key issues can be illustrated from this coarser perspective. Masses offer elementary constraints on the future contents of planetary systems. The current census of exoplanets finds an abundance of worlds orbiting other stars, but the metamorphosis of disk material into planetary systems is unclear without a comparison of the available mass reservoirs in the parent and descendant populations. Summing the masses of terrestrial planets and giant planet cores in the solar system, or an ensemble of exoplanets, offers a conservative lower bound on the solid mass expected in their progenitor disks, M⊕ (Weidenschilling, 1977a; Chiang & Laughlin, 2013). Extrapolations of the current planetary atmosphere compositions to the primordial gas expected in disks give an analogous bound for the gas masses, M⊕.
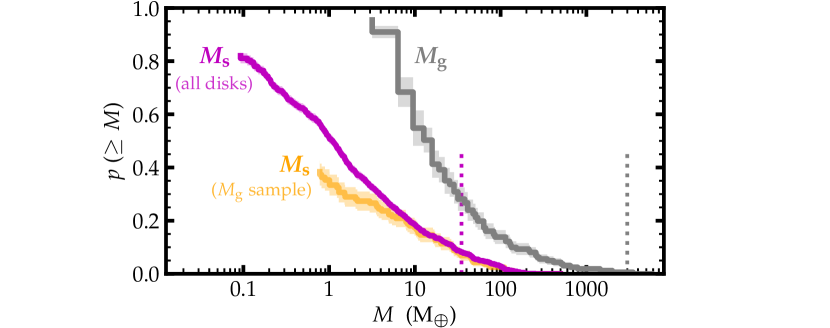
Solids are a minor contributor to the mass budget, with an initial mass fraction of 1% relative to the gas. But the fundamental roles they play in all aspects of disk evolution and planet formation justify special attention to their mass reservoir. The optimal diagnostic is the luminosity of the mm continuum emission, . In the optically thin limit, the continuum intensity scales like , where is the absorption opacity, the Planck function at temperature , and the surface density of solids. Integrating that emission over the disk volume shows that . Figure 3 shows the distribution inferred from mm continuum photometry surveys for 887 disks. Though that distribution is subject to considerable ambiguities (see below) and biased by observational and physical selection effects (Section 6), it offers rough guidance on typical values.
Estimates of are intrinsically uncertain because they rely on assumptions about the properties of the emitting particles. A detailed discussion of those properties, encapsulated in the absorption opacity, is deferred to Section 8, but the standard approach is to adopt a reasonable estimate that maximizes . Coupled with the possibility that some of the continuum emission is optically thick (Beckwith et al., 1990; Andrews & Williams, 2005; Zhu et al., 2019), this implies that estimates are more appropriately considered lower bounds. The sense of that ambiguity factors into comparisons between the distributions of disk and planetary system masses, as highlighted in the box at the end of this section.
There are many fewer estimates of , primarily because mm spectral line observations are more expensive than for the continuum. One option for a mass-sensitive tracer molecule is HD, the primary isotopologue of H2 (Bergin et al., 2013; McClure et al., 2016). The advantage of HD is the simplicity of its associated chemical network, which builds confidence in estimates of its abundance, XHD. But with a ground state transition at 112 m, HD measurements are scarce (three disk detections) and currently inaccessible (with no operational far-infrared space telescope). Estimates of based on HD have a strong -dependence and are considered lower bounds for two reasons. First, there are potential alternative reaction pathways (e.g., into hydrocarbons) that could lower XHD. And second, the line may be optically thick, and some of the emission could be hidden below the optically thick local continuum. These latter issues can be treated by comparing the data with radiative transfer models that interpret a prescription for the two-dimensional temperature and density structures (e.g., McClure et al., 2016; Trapman et al., 2017).
CO is a more common gas tracer in disks, since the abundance is high and the low-energy rotational transitions are easily accessed with mm interferometers. The primary isotopologue has very high optical depths (Beckwith & Sargent, 1993), so estimates rely instead on rarer species (usually 13CO and C18O together) and references to parametric model catalogs (Williams & Best, 2014; Miotello et al., 2016). A modest (and biased) collection of measurements are available from assorted case studies and shallow line surveys (e.g., Ansdell et al., 2016, 2018; Long et al., 2017a), as shown in Figure 3.
[t]
4 Is there enough mass in disks to make planetary systems?
The mass distributions in Figure 3 suggest that few disks have enough material to produce the solar system or its counterparts in the exoplanet population. Interpretations of this discrepancy have been considered in various forms (Greaves & Rice, 2010; Najita & Kenyon, 2014; Manara et al., 2018), with proposed solutions falling into two (not mutually exclusive) categories. The first explanation is perhaps pessimistic, but it simply recalls that and estimates are lower bounds: biased accounting factors ( or Xj) and optically thick contamination could make the true masses much higher. For example, if the mm continuum emission used to estimate includes contributions from 10 cm rocks instead of 1 mm pebbles, the distribution would shift up an order of magnitude (Section 9.1). The second solution strikes a more optimistic tone, proposing instead that planet formation has already occurred and the observations are tracing the “leftovers” (e.g., collisional debris) rather than the actual mass. The concept of a condensed planet formation timescale, presumably occurring during the embedded phase (e.g., Nixon et al., 2018), has gained recent momentum from the fine-scale features that are now routinely identified in high resolution disk images (Section 10).
These CO-based masses appear low, 5–10 lower than crude estimates from the product of the accretion rate and stellar age (Manara et al., 2016), or different gas tracers in the same disks (Favre et al., 2013; Kama et al., 2016b), or if is scaled up by a standard gas-to-solids fraction (100; Dutrey et al. 2003; Ansdell et al. 2016). The anomaly can be reconciled with a lower gas-to-solids ratio ( 10) or by decreasing XCO or the isotope fractionation below ISM values. Such abundance changes are expected from various processes (e.g., Miotello et al., 2017), including adsorption onto solids (Aikawa et al. 1997; van Zadelhoff et al. 2001), isotope-selective photodissociation (Miotello et al., 2014, 2016), and especially the sequestration of C or O into grains, ices, or other species (e.g., organics; Reboussin et al. 2015; Yu et al. 2016, 2017; Miotello et al. 2017; Bosman et al. 2018). Alternatively, the typical CO isotopologue tracers (even C18O) might be optically thick, saturating the line luminosities (Booth et al., 2019). The salient point is again that the standard adopted assumptions produce lower bounds on by design. {marginnote}[] \entryISMinterstellar medium.
4.1 Size
Sizes are a natural step in the progression of measurements from masses to density profiles. There is no consensus size definition, physically or observationally, since any metric depends on the adopted prescription for the radial variations of densities or intensities. A physical modeling effort to homogenize size measurements is littered with ambiguities. A more practical approach is to assign an empirical definition of an effective size, , defined as the radius that encircles a fixed fraction of the luminosity from tracer .
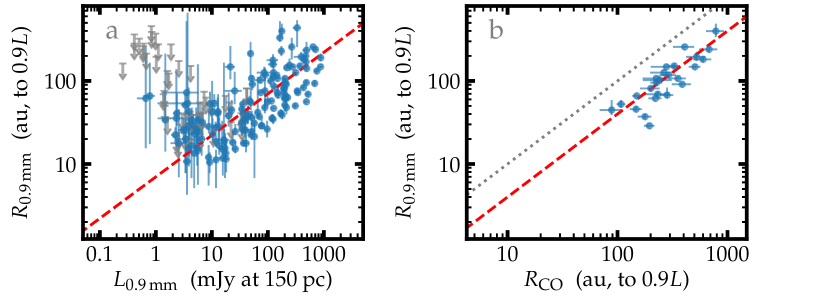
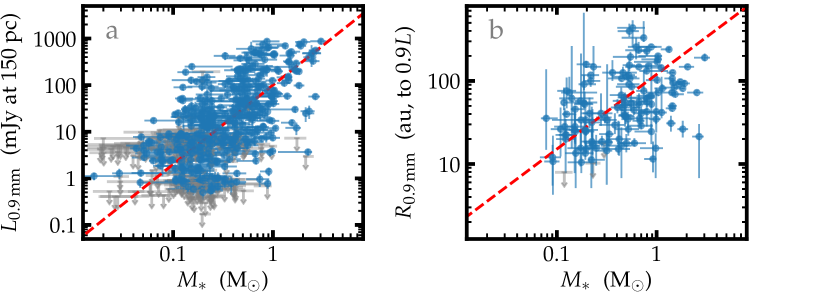
Resolved mm continuum measurements from roughly 200 disks have been used to infer –500 au (defined here so encircles 0.9 ; Tripathi et al. 2017; Andrews et al. 2018a; Hendler et al. 2020). The lower bound of that range is presumably limited by resolution. Figure 4a shows a tight correlation between the mm continuum sizes and luminosities (Andrews et al., 2010; Piétu et al., 2014) with a scaling relation (Tripathi et al., 2017; Andrews et al., 2018a) that may flatten for older systems (Hendler et al., 2020). The origins of this relationship are not clear: it could be imposed at the disk formation epoch (Isella et al., 2009; Andrews et al., 2010), produced by the evolution of solids (Tripathi et al. 2017; Rosotti et al. 2019a; see Section 8), or it may be a more trivial manifestation of high optical depths (Andrews et al., 2018a; Zhu et al., 2019).
Scattered light images offer an alternative size metric for the solids, although the empirical methodology outlined above has not been used for such data in the literature. Nevertheless, the current suite of scattered light images (e.g., Garufi et al., 2018) demonstrate that the m-sized dust grains that reflect starlight are distributed out to greater distances than the larger particles responsible for the mm continuum (e.g., Figure 2). Quantifying this size difference can be especially difficult, in large part due to the dilution of the stellar radiation field in the outer disk, but future comparisons would be valuable.
Again, there are many fewer size measurements for the gas phase. The CO line emission extends to –500 au (Ansdell et al., 2018), although a few outliers stretch beyond the high end of that range. Smaller disks presumably exist, but produce such weak line emission that they are missing in current samples (e.g., Barenfeld et al., 2017b). The available data suggest , as shown in Figure 4b. Some of that difference is related to comparing tracers with such different optical depths (Hughes et al., 2008; Trapman et al., 2019), but radiative transfer models argue for a genuine discrepancy between the density distributions (Panić et al., 2009; Andrews et al., 2012; Facchini et al., 2019).
There is a significant caveat in these measurements and results that merits reiteration: these are empirical size measurements that are not directly or simply linked to the density distribution. While the inferred behaviors outlined above may point to fundamental physical relationships, a translation into physical radii is not obvious (Rosotti et al., 2019b).
4.2 Density
In principle, spatially resolved measurements of the mass tracers introduced in Section 3.1 can constrain the surface density profiles for the solids () or gas (). Measurements of offer important insights on how angular momentum is transported in disks through turbulent viscosity (Hartmann et al., 1998) or winds (Blandford & Payne, 1982; Bai & Stone, 2013), and what types of planetary system architectures can be formed (Miguel et al., 2011) and how they will evolve via migration (Baruteau et al., 2014). Likewise, the evolution of is a diagnostic of the processes that drive the growth of dust grains into planetesimals (Johansen et al., 2009; Birnstiel et al., 2012). Put simply, the disk density structure ties into all the fundamental physical mechanisms relevant to star and planet formation.
A key emphasis has been on estimating from modest resolution (20–50 au) observations of mm continuum morphologies (Andrews & Williams, 2007a; Piétu et al., 2007, 2014; Andrews et al., 2009, 2010; Isella et al., 2009; Tazzari et al., 2017). The modeling details used to make those measurements vary substantially between studies, but a crude distillation suggests or shallower in the inner disk and or steeper at large . At these resolutions, the density gradient is actually measured at large (tens to hundreds of au); estimates of in the inner disk are extrapolated according to the prescribed functional form of the density profile. At –100 au, values span 0.001–1 g cm-2.
The basic methodology for inferring from spectral line observations is similar (e.g., Williams & McPartland, 2016; Zhang et al., 2019). The focus has been almost exclusively on the CO isotopologues as the density tracers (e.g., Miotello et al. 2018; there is no prospect for spatially resolved HD measurements). Some of the intrinsic degeneracies can be mitigated by modeling multiple species or line transitions simultaneously (van Zadelhoff et al., 2001; Dartois et al., 2003; Schwarz et al., 2016; Zhang et al., 2017; Cleeves et al., 2017).
Density measurements suffer the same ambiguities outlined for the masses (Section 3.1); namely, the uncertain conversion factors – for and XCO (and isotopic fractions) for – and the potential for contamination by high optical depths. There is also the added complexity that high could produce an optically thick continuum that blocks the spectral line emission originating below (or behind) the continuum photosphere (e.g., Weaver et al., 2018; Isella et al., 2018). If that effect is significant, robust estimates of from line data will also require a simultaneous inference of (a formidable challenge).
Measurements of disk densities remain in an exploratory phase, with progress limited by data availability and quality, systematics in the methodology, and intrinsic degeneracies. Some promising ideas for measuring aim to get around the tracer abundance ambiguity, using line ratios that are directly sensitive to the volume density (e.g., Teague et al., 2018b) or converting multiwavelength measurements and a simplified model for the aerodynamics of solids to an inference of the underlying density profile (Powell et al., 2017).
4.3 Temperature
The thermal structure determines some fundamental reference scales, usually parameterized by the sound speed, (), and the pressure scale height, , where is the Keplerian angular velocity. Moreover, it is intimately connected to the tracers of the disk material, since it controls the molecular excitation conditions, the vertical location of the scattering surface, and the spectral line and continuum intensities.
The temperature distribution depends on the irradiation of solids by the host star. Small grains suspended in the disk atmosphere absorb starlight and then re-radiate some of that energy toward the midplane (Chiang & Goldreich, 1997; D’Alessio et al., 1998). That central, external energy deposition produces an increasing (Calvet et al., 1991) and a decreasing (Kenyon & Hartmann, 1987). Irradiation heating depends on the host star spectrum as well as the microphysical properties and vertical distribution of the solids (D’Alessio et al., 1999, 2006; Dullemond et al., 2001, 2002). The latter is set by a balance between turbulent mixing and the solids-gas coupling (Dubrulle et al., 1995). When the solids-to-gas ratio is low (at large or ), spectral line processes can super-heat the gas (Kamp & Dullemond, 2004; Bruderer, 2013). A variety of secondary heating sources – viscous dissipation (D’Alessio et al., 1998), spiral shocks (Rafikov, 2016), radioactivity (Cleeves et al., 2013), external irradiation (e.g., from an envelope; Natta 1993; D’Alessio et al. 1997), or vertical structure perturbations (e.g., from self-shadowing; Dullemond & Dominik 2004b) – can also contribute significantly to the temperature structure.
The classical approach to constraining the temperature distribution is to forward-model the infrared SED. Such modeling proposes a density and opacity distribution, simulates the propagation of energy through the disk, generates synthetic observables to compare with data, and iterates. The fundamental challenges are the physical degeneracies in such modeling (Thamm et al., 1994; Heese et al., 2017); even if internally self-consistent, the models are not unique. One way to mitigate some ambiguity is to fold additional (spatially resolved) data into the modeling circuit (e.g., Pinte et al., 2008). {marginnote}[] \entrySEDspectral energy distribution.
Another option relies on the spatial distribution of optically thick emission lines (Weaver et al., 2018). With sufficient resolution, can be measured in the vertical layer corresponding to the line photosphere (Rosenfeld et al., 2013a; Pinte et al., 2018a; Dullemond et al., 2020). Constraints on are possible by probing intensities at different depths in the atmosphere using lines with a range of excitation conditions (van Zadelhoff et al., 2001; Dartois et al., 2003; Schwarz et al., 2016). That reconstruction effort can be supplemented with benchmarks in from signposts of condensation fronts (snowlines), where volatiles are removed from the gas when they freeze onto grain surfaces (Qi et al. 2011, 2019).
4.4 Dynamics
[t]
5 Observational Insights on Disk Magnetic Fields
Magnetic fields are predicted to fundamentally alter the gas dynamics in disks, and thereby play important roles in shaping their structures and evolution. But there are few concrete observational constraints available to inform magnetohydrodynamics models. In principle, magnetic field morphologies can be measured from the linear polarization of mm continuum emission (Cho & Lazarian, 2007; Bertrang et al., 2017) or molecular line emission (Goldreich & Kylafis, 1981). So far, efforts to measure the former have been frustrated by scattering (Kataoka et al., 2015) and various alternative grain alignment mechanisms that can also polarize the continuum (e.g., Tazaki et al., 2017; Kataoka et al., 2019). Linear polarization measurements of spectral lines from disks are expected soon. The line-of-sight magnetic field strength (and topology) can potentially be measured with high resolution spectral line observations of circular polarization induced by Zeeman splitting (e.g., in CN hyperfine transitions; Brauer et al. 2017).
Disks are profoundly affected by their fluid dynamics (Armitage, 2011). The dominant factor in the kinematic structure of a disk is orbital motion, but important contributions are expected from magnetic fields (Turner et al. 2014; see the box above), viscous transport (Lynden-Bell & Pringle, 1974), pressure support (Weidenschilling, 1977b), self-gravity (Rosenfeld et al., 2013a), and winds (Ercolano & Pascucci, 2017). Random motions generated by turbulence are traditionally asserted as the source of a kinematic viscosity () – quantified with the coefficient – that controls accretion, mixing, and other diffusive processes. Classical models of turbulence driven by the MRI (Balbus & Hawley, 1991) predict –0.01. But a shifting theoretical paradigm now argues that the MRI is suppressed by non-ideal MHD effects over much of the disk (e.g., Bai & Stone, 2013), suggesting instead a system that is effectively laminar, . {marginnote}[] \entryMRImagnetorotational instability. \entryMHDmagnetohydrodynamics.
Spatially and spectrally resolved observations of emission lines with a range of optical depths can be used to reconstruct the three-dimensional disk velocity field. Typical observations are suitable for confirming that orbital motions dominate (Rosenfeld et al., 2012a; Czekala et al., 2015; Simon et al., 2017), although measurements of non-Keplerian deviations are becoming available (Section 10). Constraints on turbulence are available from two approaches. The first relies on a measurement of spectral broadening: an emission line profile has contributions from both thermal and non-thermal motions, with characteristic variances (where is the Boltzmann constant and the mass of molecule ) and , respectively. With some knowledge of (usually inferred jointly), resolved line measurements constrain in a given line photosphere layer. Suitable data are only available in three cases. In two of these (TW Hya and HD 163296), upper limits indicate sub-sonic turbulence () at –3 , corresponding to (Hughes et al., 2011; Flaherty et al., 2015, 2017, 2018; Teague et al., 2016, 2018c). A much broader (0.) is found in the remaining case (DM Tau; Guilloteau et al. 2012). Taken at face value, this implies vigorous turbulence () at a comparable altitude, or it may hint that the distribution is incorrect or other broadening mechanisms are at play.
The second approach relies on the diffusive blurring of nominally “sharp” features (Section 10). High resolution mm continuum observations offer geometric constraints on turbulent mixing, based on the height of the mm photosphere (Pinte et al., 2016) or the radial widths of narrow ring features (Dullemond et al., 2018), that suggest near the midplane. This methodology is complementary to the line broadening, with each approach probing different altitudes with orthogonal degeneracies (gas-particle coupling and the thermal structure of the gas, respectively). Efforts to combine them can construct a more nuanced view of the spatial variation and origins of disk turbulence (e.g., Shi & Chiang, 2014).
6 DEMOGRAPHIC INSIGHTS
The previous section highlighted the design and vetting of tools used to infer physical aspects of disk structures, as well as the intrinsic ambiguities and practical limitations that frustrate those inferences. Those challenges are being confronted, with improved physical constraints following in step with the quality, volume, and diversity of the available data. But assembling large, homogeneous catalogs of robust disk structure models is simply not practical. Recognizing that, one imperative message from Section 2 is that theoretical work in the physical domain ultimately needs to transform outputs into appropriate observational metrics: predictions and model tests should happen in the data-space.
A proper demographic analysis requires a catalog of a given disk property (dependent variable) that is both large and spans a sufficient range in the external factors (independent variables) of interest. The two empirical probes of disk structure properties that are simple enough to measure in large quantities today are the mm continuum luminosities () and sizes (). The remainder of this section synthesizes various data repositories to explore how these structure proxies depend on host masses (Section 6.1), the local and global environments (Section 6.2), and evolutionary diagnostics (Section 7.1).
6.1 Links to Stellar Hosts
Considerable attention in the field is devoted to probing connections between disk structures and their stellar hosts. In particular, most theoretical work associated with star and planet formation presumes that fundamental physical principles like the conservation of mass and angular momentum could imprint some lasting relationships between the stellar host masses, , and basic disk structure metrics like masses and sizes. Some credence is lent to that emphasis from the clear -dependencies that have been identified through demographic studies of the exoplanet population (e.g., see Mulders, 2018).
Large mm continuum photometry catalogs for disks in a few nearby regions have sufficient dynamic range in to characterize any relationships with (Andrews et al., 2013; Ansdell et al., 2016; Pascucci et al., 2016; Barenfeld et al., 2017a). When excluding known multiple star systems (Section 6.2), the regions with mean ages 3 Myr exhibit a consistent scaling relation, (for M⊙; the same scaling is found at or 1.3 mm), shown in Figure 5a. The normalization indicates that a typical disk with a solar analogue ( M⊙) host has flux densities of 100 or 40 mJy at 150 pc for or 1.3 mm, respectively. There is considerable scatter around the mean – relation, roughly a factor of three (0.5 dex) added dispersion in beyond the measurement uncertainties. Some of that could be related to imprecise (or biased) estimates, though various physical origins are plausible. There is a hint for Taurus disks (Ward-Duong et al., 2018; Akeson et al., 2019) that extending to M⊙ flattens the mean relation (). It is unclear if this is a real turnover or if it is unique to Taurus.
Assuming the emission is optically thin, this relation predicts a corresponding scaling between and with a morphology that is sensitive to the behavior of the disk-averaged temperatures and opacities. To date, all studies have presumed that is unrelated to (although without justification). Various treatments of the -dependence on have been considered: Andrews et al. (2013) suggested that based on simple irradiation heating arguments, while Pascucci et al. (2016) preferred the assumption that is independent of . Given the measured behaviors of the size–luminosity (Section 4.1; Tripathi et al. 2017) and size– (Figure 5b; Andrews et al. 2018a) relations, simple irradiation heating should impose only a weak mass dependence on (see Tazzari et al. 2017), in line with the Pascucci et al. assumption and therefore predicting a steeper than linear – relation (i.e., a nearly -independent link between and ).
The – relation in Figure 5b is less pronounced, partly because the dynamic range in is limited (relative to the scatter) by resolution. Andrews et al. (2018a) estimated that a slightly sub-linear relationship was appropriate: the updated results here suggest , consistent with a simple combination of the measured – and – scaling relations. If the emission is optically thin, Andrews et al. (2018a) demonstrated that such scaling behavior naturally follows if all disks have a similar mm optical depth profile (independent of ) with , meaning depends primarily on the disk size. Alternatively, the same relationships would be produced if the emission is optically thick with an effective filling factor of 0.3, produced by spatially concentrating the high optical depths (Ricci et al., 2012) or reducing the intensities by self-scattering from particles with high albedos (Zhu et al., 2019). The scatter in these relations can be attributed to diversity in the underlying relation between the disk sizes and host masses, the mean optical depths, effective filling factors, or a combination of such effects.
6.2 Environmental Effects
6.2.1 Dynamical Interactions
Disk structures can be substantially shaped by dynamical interactions in their local environments. The tidal perturbations that occur in multiple star systems are expected to be the most prevalent for the current catalog of disk observations (although see the box on the next page). Multiplicity fractions are high, 30–50% in the field (Raghavan et al., 2010) and up to 70% for the young clusters that inform most disk studies (e.g., Kraus et al., 2011). Moreover, most stellar pairs have separations comparable to typical disk sizes (10–100 au). Simulations of the perturbations to disk structures induced by gravitational interactions in such systems find that individual disks in binaries are tidally truncated at -0.5, where is their mean separation (Artymowicz & Lubow, 1994); they generically predict that disks in close binaries are smaller, and therefore less massive, than their counterparts in wider binaries or around single stars.
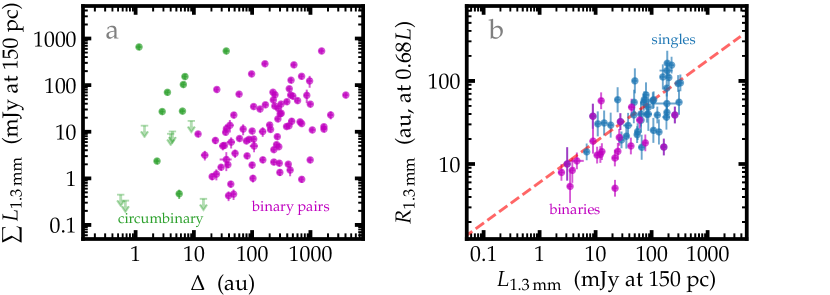
There is some qualitative support for those predictions in the observations. Figure 6a shows that the total in binary pairs marginally increases with their projected separation (Jensen et al., 1994; Harris et al., 2012; Akeson & Jensen, 2014). That behavior is convolved with the - relation: Akeson et al. (2019) found the same shape for that relation applies for the individual components of binaries, but with a normalization offset. The mean is 3–4 lower at the same for the binaries. Manara et al. (2019) provided more support for the truncation hypothesis by comparing mm continuum emission sizes for disks in analogous subsamples. Figure 6b demonstrates that for individual disks in binaries are 2 smaller than for a comparison set of disks around single stars.
However, Manara et al. (2019) found that the measured are too small compared with the truncation model predictions, given the projected separations (see also Harris et al. 2012). The discrepancy could point to eccentric orbits or indicate that the models are inappropriate. Those models presume co-planarity between the disks and stellar orbits, which is often not the case for the medium-separation binaries where estimates are tractable (Jensen & Akeson, 2014; Williams et al., 2014; Tobin et al., 2016; Brinch et al., 2016; Alves et al., 2019). Moreover, the models make predictions for the gas distribution, which is usually more extended than the solids (Section 4.1).
[t]
7 Unbound Dynamical Encounters
Flyby encounters between unbound stars and their disks are a natural extension of the dynamical interactions experienced in binaries (Clarke & Pringle, 1993). The probability for such encounters is enhanced at early times, where the cluster environment has a higher local stellar density (e.g., Bate, 2018). Pfalzner (2013) predict that 1 in 3 solar-type stars in an OB association experiences a close (100–1000 au) periastron passage within 1 Myr. These flybys can substantially perturb disk structures, including the creation of spiral arms or tidal bridges (Cuello et al., 2019b), truncation (Breslau et al., 2014), and warping or partial disruption (Xiang-Gruess, 2016). The key demographic prediction from these encounters is that single stars in clusters with higher stellar densities should host smaller, less massive disks (de Juan Ovelar et al., 2012; Rosotti et al., 2014). While a direct test of that hypothesis is not yet tractable (due to the current focus of ALMA surveys on nearby loose associations), there are signs of potentially related morphological features in individual systems, including possible tidal extensions (Winter et al., 2018a) and spiral perturbations for disks in widely-separated binaries (Mayama et al., 2012; Rodriguez et al., 2018; Kurtovic et al., 2018).
7.0.1 External Photoevaporation
Dynamical encounters are not the only environmental factors that alter disk structures. The intense radiation produced by massive stars can heat the outer regions of nearby disks until the sound speed exceeds the escape velocity, generating considerable mass loss in a wind (Hollenbach et al., 1994; Alexander et al., 2014). That externally-driven photoevaporative mass loss is validated with observations of ionization fronts associated with disks in the Orion Trapezium region (Johnstone et al., 1998; Störzer & Hollenbach, 1999). From a demographic perspective, photoevaporation models predict that disk sizes and masses should be lower in close proximity to massive stars. Indeed, the mean drops within 0.03 pc of the massive star Ori C (Mann & Williams, 2009, 2010; Mann et al., 2014), corresponding to the region where ionization from its Lyman continuum radiation dominates (Johnstone et al., 1998). Eisner et al. (2018) found that and continuum sizes increase with distance from Ori C, but are generally lower than for the disks in clusters without massive stars. That behavior is consistent with models that suggest a larger region of influence on disk structures from less energetic (far-ultraviolet) radiation fields (Facchini et al., 2016; Ansdell et al., 2017; van Terwisga et al., 2019).
7.1 Evolutionary Signatures
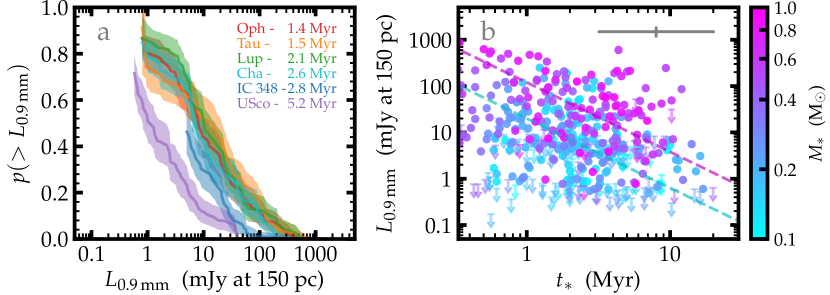
Much of the work on disk demographics focuses on the variations as a function of some metric of the elapsed time or evolutionary state of the system. One option is direct, considering how disk properties depend on their stellar host ages, . While that seems natural, it is not trivial in practice because the ages are both imprecise and potentially inaccurate, due to biases in both the measurements and the models (e.g., Bell et al., 2013). With those caveats in mind, common practice is to compare the distributions of a given disk probe in young star clusters with a progression of mean ages. When controlling for and multiplicity, Figure 7a shows that the distribution shifts downward on 5 Myr timescales (Barenfeld et al., 2017a; Ruíz-Rodríguez et al., 2018). A crude estimate of the decline suggests . There is evidence that the shape of the distribution changes, manifested as a steepening in the – relationship over time (Pascucci et al., 2016; Barenfeld et al., 2017a). Figure 7b shows the same information in individual datapoints.
Some, perhaps all, of this evolution in is associated with changes in the continuum size–luminosity relationship: is generally smaller for disks in older clusters (Barenfeld et al. 2017b; Hendler et al. 2020). Such behavior indicates that the growth and migration of disk solids are key factors driving these demographic trends, rather than wholesale changes (Tripathi et al. 2017; Rosotti et al. 2019a; Section 8). But analyses like these tell only part of the story. Focusing solely on systems that show excess infrared emission introduces a form of survivor bias by not accounting for the fact that the disk (infrared excess) fraction also decreases with (Haisch et al., 2001; Hernández et al., 2007). With that in mind, the combined effects of evolution are clearly under-estimated.
An alternative approach can help mitigate that survivor bias. The idea is to track how disks change as a function of their SED shape, an empirical diagnostic of the evolutionary state of the circumstellar material. Generally, this sequence where the SED peak moves progressively to shorter reflects the dissipation of the envelope (Class 0 I II) and disk (Class II III; e.g., Williams & Cieza 2011). The (or ) distributions again shift downward along this evolutionary sequence (Andrews & Williams, 2007b; Sheehan & Eisner, 2017; Tychoniec et al., 2018; Williams et al., 2019). It is not easy to measure disk properties in the embedded phases (Class 0/I), due to both the technical challenge of disentangling emission from the envelope (Tobin et al., 2015) and the potential for younger disks to be intrinsically small (Segura-Cox et al., 2018; Maury et al., 2019). Most estimates find little evolution in during the Class 0 to I transition, even with a considerable decrease in envelope mass (Jørgensen et al., 2009; Segura-Cox et al., 2018; Andersen et al., 2019).
Despite some of the benefits of this latter evolutionary axis, it is difficult to contextualize the results without reference to a quantitative timeline. Moreover, there is potential to make unfair comparisons that are not able to control for orthogonal relationships (e.g., a dependence, since stellar properties for Class 0/I sources are unknown) or sample completeness (e.g., large mm Class III surveys are unavailable).
8 THE EVOLUTION OF DISK SOLIDS
The physical origins of the demographic behaviors that were outlined in the previous section are presumably closely related to the growth and migration of the disk solids. However, the vast scope and complexity of that evolution is daunting. To generate a population of planetesimals suitable for assembling a planetary system, the sub-m dust grains incorporated into the disk at its formation epoch need to grow 12 orders of magnitude in size within a few Myr. This section highlights the basic theoretical framework developed to understand these processes (Section 8.1), explores the observational constraints (Sections 9.1 and 9.2), and considers the implications of some persistent obstacles (Section 9.3).
8.1 Standard Theoretical Picture
The two key elements required to model the evolution of disk solids are prescriptions for their coupling to the fluid motions of the gas (Nakagawa et al., 1986) and the outcomes of particle collisions (Güttler et al., 2010). Standard models start with small dust grains distributed homogeneously within a smooth gas disk, where the pressure () decreases monotonically with and . Turbulent diffusion is described with a simple viscosity prescription for fixed . The small dust is well coupled to the gas, and so acquires low relative velocities through diffusive motions that result in gentle collisions that promote growth to porous aggregates (Henning & Stognienko, 1996; Dominik & Tielens, 1997). Those aggregates settle toward the midplane (Dubrulle et al., 1995), where the growth sequence continues. The material properties (internal structure, charge state, ice coating), sizes, and relative velocities of the impactor and target solids determine whether a collision is productive (mass transfer; Teiser & Wurm 2009), neutral (bouncing; Zsom et al. 2010), or destructive (fragmentation, erosion; Birnstiel et al. 2010; Krijt et al. 2015). Simulations indicate that growth continues until collisions become destructive (Dullemond & Dominik, 2005) or the local particle population is depleted by radial migration (Takeuchi & Lin, 2002; Brauer et al., 2007; Birnstiel et al., 2009). For typical disk parameters, the latter effect dominates.
For a smooth disk, pressure support generates an additional outward force on a parcel of gas that effectively slows its orbital motion (Whipple, 1972). The radial migration (“drift”) of solids occurs once particles reach a size where they start to aerodynamically decouple from the gas; once disconnected from the pressure support of the gas, the particles spiral inwards toward the global maximum in (Weidenschilling, 1977b). The timescales for that migration are much shorter than the collision timescales, thereby inhibiting further growth at that location (Takeuchi & Lin, 2005; Brauer et al., 2008). As a guide, drift is typically most efficient for pebbles (mm/cm sizes) at –100 au.
The combined effects of growth and migration – both vertically (settling) and radially (drift) – profoundly influence the properties of disk solids (Testi et al., 2014). The simplest distillation of the key predictions in this standard framework is that disks should exhibit pronounced, negative spatial gradients (i.e., decreasing with and ) in their mean particle sizes and solids-to-gas mass ratios, such that larger solids at higher concentrations (relative to the gas) are found near the midplane (Dullemond & Dominik, 2004a; D’Alessio et al., 2006) and closer to the host star (Birnstiel et al., 2009, 2015; Birnstiel & Andrews, 2014).
[t]
9 High-Dimensional Complexity in Particle Properties
The limited scope of the metrics explored in Section 9.1 reflect the over-simplified emphasis in the literature. The reality is that many other factors can influence the absorption and scattering properties of the particles, and therefore the key observables (e.g., Min et al., 2016). This high-dimensional complexity includes mineralogical compositions (Henning & Stognienko, 1996; Cuzzi et al., 2014; Woitke et al., 2016), asphericity (Bertrang & Wolf, 2017), temperature-dependent refractive indices (Boudet et al., 2005), the methodology for mixing dielectric properties in composite particles (Birnstiel et al., 2018), and more sophisticated particle size distributions (Birnstiel et al., 2011), to name only a few. While these issues could change the details, the qualitative behaviors should be generally preserved. However, when confronted with subtle discrepancies or tensions (e.g., Section 9.2.4), a wider exploration of these other factors should be seen as a priority.
9.1 Metrics of Particle Properties
In principle, those key predictions can be measured observationally. But designing the appropriate experiments and then interpreting the measurements requires a nuanced understanding of how particle properties are translated into disk tracers. The interactions of solid particles with radiation depend on their bulk properties, including compositions (Pollack et al., 1994), morphologies (Henning & Stognienko, 1996), and especially sizes (Miyake & Nakagawa, 1993) – but see also the box above. Those properties are encoded in the (absorption) opacities (), albedos (), and polarizations () of the particle ensemble.111The phase angle variations of and also contain information about the particles. Measurements of the thermal continuum and scattered light reflect the convolution of the physical conditions of the solids and the behaviors of {, , }.
The morphology and size distributions for a population of solids have the most significant effects on the observables. Technically, morphologies are affected by both shape and internal structure (porosity), but the former is often ignored. The porosity is parameterized by a volume filling factor (1 for compact particles). Particle size distributions are usually approximated as power-laws, for sizes (particle radii) , with indices comparable to expectations for a collisional cascade (; Dohnanyi 1969) or a more top-heavy variant (; e.g., Birnstiel et al. 2011).
Because of the (presumed) low optical depths, much of the work on particle properties in disks is conducted at mm/cm wavelengths. There, is irrelevant and the opacity spectrum can be approximated as a power-law, . Figure 8 illustrates how {, , , } respond to the particle properties {, , } at mm for the assumptions of Birnstiel et al. (2018). The behavior at other wavelengths is qualitatively similar, with the main features shifted for an scaling. When , is independent of size, is high (1.7, as for the small dust grains in the ISM; Finkbeiner et al. 1999), and scattering is negligible (, though is high). When , decreases with at a rate that depends on (lower means a steeper fall-off; e.g., Ricci et al. 2010b), is lower (scaling roughly with ; Draine 2006), albedos are high (larger implies higher ), and is low. When , resonances drive up , , and , while drops precipitously. Porosity dampens the resonant amplifications in and , but can enhance and , and generally modifies the behavior (Kataoka et al., 2014).
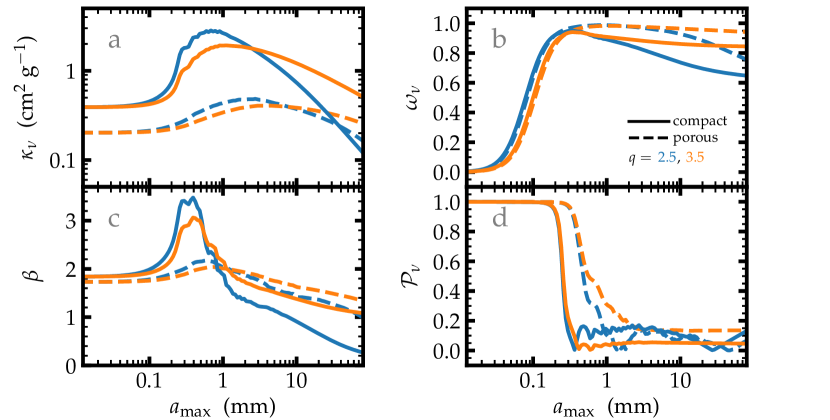
It is worthwhile to specifically address the apocryphal notion that (optically thin) mm continuum emission traces particles with . A more accurate statement is that the emission is most efficient in that case, since this corresponds to the resonant peak in and therefore gives the most emission per mass. However, all sizes still contribute, and that creates an intrinsic ambiguity: can be arbitrarily low if larger solids are present. An observational constraint on only sets a lower bound on , since effectively saturates once . That, in turn, sets an upper bound on , and correspondingly a lower bound on the mass-related quantities (namely, or ).
9.2 Measurements of Particle Growth and Migration
9.2.1 Scattered Light and the Infrared SED
Optical and near-infrared images demonstrate that the starlight reflected from disk surfaces is typically faint (low ; Fukagawa et al. 2010), gray or red (Weinberger et al., 2002; Schneider et al., 2003), and forward-scattered (Quanz et al. 2011; Mulders & Dominik 2012). Taken together, those properties indicate dust aggregates with m in disk atmospheres, representing the early steps in the growth sequence or possibly tracing collision fragments mixed up from the midplane. Similar conclusions are drawn from the shapes of solid-state emission features in the mid-infrared, though isolating the inner disk with an interferometer is essential for robustly assessing the more processed grains located in the inner disk (van Boekel et al., 2004).
Direct measurements that trace the settling of dust aggregates toward the disk midplane are difficult due to the small intrinsic extent of the vertical dimension (with characteristic aspect ratios ). Very high resolution mm continuum observations of edge-on disks are expected to provide decisive constraints on settling in the near future (e.g., Boehler et al., 2013; Louvet et al., 2018). For now the effects are identifiable with indirect probes, like the morphology of the infrared SED. Settling depletes particle densities relative to the gas in the disk atmosphere, reducing the infrared opacity and associated continuum emission below expectations from models that assume gas and dust are well-mixed (Dullemond & Dominik, 2004b; D’Alessio et al., 2006). The suppression of the infrared SED inferred from those models suggests that the dust-to-gas ratio is depleted 10–100 in disk atmospheres (e.g., Furlan et al., 2011). Analogous evidence can be retrieved from multiwavelength scattered light images: settling induces a vertical stratification of particle sizes ( is decreasing), and the corresponding gradient in makes the height of the scattering surface decrease with (Pinte et al., 2007; Duchêne et al., 2010; McCabe et al., 2011; Muro-Arena et al., 2018).
9.2.2 Millimeter Continuum Spectrum
The mm continuum emission offers the most discriminating probes of particle properties near the disk midplane. In the optically thin limit, the intensity scales like . But since cannot be determined uniquely, information about the particle properties is only accessible through the shape of the spectrum, quantified by the spectral index (where ), with a sum of contributions from the Planck function (, where –2.0 for K) and the opacity spectrum (). Resolved measurements of can test the predicted spatial segregation of particle sizes. Larger particles have smaller (Figure 8), and therefore smaller : the hypothesis is that increases (the spectrum steepens) with and .
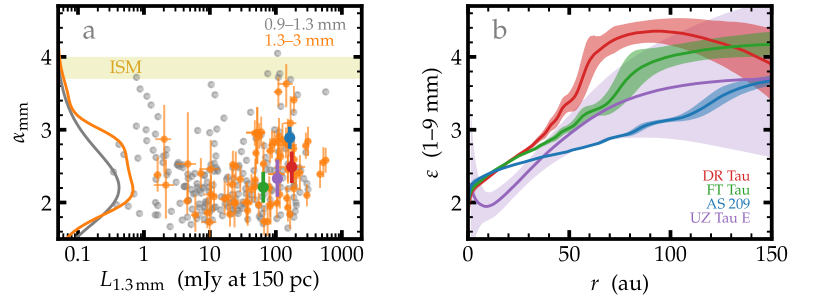
In practice, the disk-integrated spectral index (where the flux density ) is a much more common metric in the literature. As shown in Figure 9a, measurements find that –3 in the –3 mm range (the mean for –1.3 mm), with a modest preference for steeper spectra at larger (Beckwith & Sargent, 1991; Andrews & Williams, 2005, 2007a; Ricci et al., 2010b, a; Ansdell et al., 2018). There are tentative hints that also increases with and (as might be expected; see Sections 4.1 and 6.1), but the scatter is large and selection effects may dominate. Taken at face value, the measured indicate shallow opacity spectra (), and therefore large particles (e.g., cm for the models in Figure 8).
However, unresolved spectral index measurements gloss over some important complexities. Note that is not a disk-averaged (). The interpretation of in the context of spatial variations in the continuum spectrum is ambiguous. Constraints on are difficult, again due to the intrinsically low aspect ratios of disks. That said, the rare limits on the vertical extent of the mm continuum are qualitatively consistent with the particle size segregation predicted by settling models with low (Guilloteau et al., 2016; Pinte et al., 2016). Measurements of that trace the combination of growth and radial drift are more practical. The common approach is to reconstruct from ratios of model fits to the multiwavelength profiles (Isella et al., 2010; Guilloteau et al., 2011). Figure 9b shows some examples. A condensed alternative considers the wavelength dependence of the continuum sizes: an increasing implies a decreasing (Tripathi et al., 2018). In either case, such analyses infer that increases from 2 in the inner disk (tens of au) to 3 at larger , corresponding to growing from 0 to 1 and decreasing from cm to sub-mm sizes (Pérez et al., 2012, 2015a; Menu et al., 2014; Tazzari et al., 2016).
9.2.3 Polarization
Some complementary constraints on particle sizes are available from the linear polarization of self-scattered mm continuum emission (Hughes et al., 2009a; Kataoka et al., 2015). As illustrated in Figure 8, the albedo and polarization change precipitously in opposite directions near . The narrow shape of the product implies that polarization from scattering is only produced for a limited range of particle sizes. Measurements of the wavelength of peak set a stringent limit on . Resolved observations of polarized emission at –1.3 mm find that the bulk morphologies of the polarization vectors are consistent with model predictions for scattering (Kataoka et al., 2016b; Yang et al., 2017b; Stephens et al., 2017; Hull et al., 2018; Bacciotti et al., 2018; Dent et al., 2019). For a few disks, multiwavelength measurements indicate mm (Kataoka et al., 2016a; Ohashi et al., 2018), considerably lower than inferred from the spectral indices.
9.2.4 Tension and the Optical Depth Caveat
The explanation for this apparent discrepancy in the characteristic inferred from the spectral indices and polarization properties of the mm continuum emission is not yet clear. One potential reconciliation is that the comparison itself could be misleading due to spatial variations in one or both of the tracers. For example, the outer regions of disks tend to have , which could be consistent with the polarization-based size constraints if much of the behavior is produced at larger radii. But perhaps a simpler and more compelling possibility is that the assumption of low optical depths used to simplify the interpretation of the mm continuum emission is invalid. High optical depths suppress the continuum spectral index, with –2.5, depending on the local temperature and the spectral variation of the albedo if scattering is important (Zhu et al., 2019; Liu, 2019). There is still information about the particle sizes (in the photosphere layer) available from in this case, but the quantitative limits on could indeed be very different than would be inferred in the optically thin limit. Though this possibility had previously been considered (Ricci et al., 2012), it is worth revisiting in the context of more detailed measurements of the disk emission (see Section 10).
9.2.5 Comparisons with Spectral Line Emission
Observational tests of the prediction that the solids-to-gas ratio decreases with are more challenging. Quantitative measurements of that ratio are impractical, given the ambiguities associated with measuring and (Section 4.2). Instead, investigations rely on a qualitative approach analogous to the SED constraints on the vertical variation of the dust-to-gas ratio discussed in Section 9.2.1. The strategy is to negate the hypothesis of a radially constant solids-to-gas ratio by demonstrating that such models cannot simultaneously explain the intensity profiles of both the mm continuum and a bright spectral line (Isella et al., 2007; Panić et al., 2009; Andrews et al., 2012). The argument is that the size discrepancy between the continuum and line emission (Figure 4b) is an indirect indicator that and have different shapes.
Realistically, such a comparative analysis is not robust enough to be quantitative. There are legitimate concerns about radiative transfer effects, since the tracers being compared have very different optical depths (Hughes et al., 2008; Trapman et al., 2019). Moreover, it is not easy to disentangle the signatures of a solids-to-gas ratio that decreases with from the accompanying changes in (Facchini et al., 2017; Rosotti et al., 2019b). Trapman et al. (2019) argued that is an unambiguous indicator of growth and drift for smooth disks. The typically lower values of that ratio could still be consistent with that scenario (detailed modeling would be necessary), but might also reflect deviations from a smooth gas disk, where is effectively increased by slowed particle migration at local maxima while is unaffected (see Section 10).
9.3 Toward Planetesimals
The measurements outlined above are in good qualitative agreement with the standard theoretical predictions for the evolution of disk solids. This empirical support suggests that the basic physical ingredients in the models are appropriate. However, there are two important quantitative problems with the framework. The first is subtle: the predicted spatial segregation of particle sizes is generically more extreme than is implied by measurements of (e.g., Tripathi et al., 2018). The same problem appears as an over-prediction of the distribution with respect to observations (Birnstiel et al., 2010; Pinilla et al., 2013), and a difficulty in reproducing the high end of the – correlation (Tripathi et al., 2017; Rosotti et al., 2019a). Put simply, the predicted evolution is too fast to account for the data. The second problem is related, but more striking: the models do not produce planetesimals, or even meter-sized bodies, within the timeframe associated with disk dispersal (5–10 Myr). Inside a few au, this latter issue is perhaps associated with incomplete physics in the models (Laibe et al., 2012; Okuzumi et al., 2012; Windmark et al., 2012a, b).
Ultimately, both of these problems are consequences of the predicted (high) efficiency for the radial migration of solids. The next section reconsiders an elegant solution to both problems, achieved by relaxing the standard assumption of a smooth gas disk.
10 SUBSTRUCTURES
Until recently, nearly all of the constraints on disk structures were derived from observations with relatively coarse spatial resolution, 15–20 au. As is frequently the case, improved facilities and instrumentation have precipitated a dramatic shift in the field, with a new emphasis on the prevalence of fine-scale features, or substructures, in these disks. Despite the narrowed focus on these details, important new insights have emerged that are re-shaping how disk properties are interpreted and contextualized more generally.
10.1 Resolving the Drift Dilemma
Substructures can reconcile the two fundamental problems associated with the migration of solids in the classical theory (Section 9.3). To explain how, it helps to revisit the cause of the migration. The force balance between gravity, rotation, and pressure support determines the orbital motion of the gas disk. The contribution associated with pressure support is proportional to the gradient d/d. The standard assumption of a smooth, monotonically decreasing implies that d/d is always negative, and therefore the gas orbits at sub-Keplerian velocities. For solids that decouple from the gas, drag extracts orbital energy and imparts a radial velocity directed inwards, toward the maximum at the inner disk edge. The key problem is that this radial drift is too efficient (Takeuchi & Lin, 2002, 2005).
However, if is not monotonic but instead has local maxima, there are corresponding modulations to the gas dynamics with striking consequences. Exterior to a local maximum, the standard physical scenario applies: d/d, gas velocities are sub-Keplerian, and drifting particles move inwards. But just interior to a maximum, d/d and the gas motion is super-Keplerian. In that case, particles are instead pushed outwards. Interactions with this perturbed gas flow drive particle migration to converge toward the local pressure maximum. At the maximum there is no pressure gradient (d/d by definition), so the gas motion is Keplerian and the solids do not drift. A sufficiently steep modulation with limited diffusion can effectively “trap” solids by slowing or halting their migration.
These substructures in the gas pressure distribution are essential ingredients for reconciling the drift and planetesimal formation timescale problems. If distributed throughout the disk, perturbations to can alleviate the drift timescale problem by stalling particle migration (Pinilla et al., 2012a, 2013). Moreover, the resulting localized particle concentrations can attain solids-to-gas ratios that approach unity (e.g., Yang et al., 2017a), thereby creating favorable conditions for the rapid conversion of pebbles into planetesimals through the streaming instability (Youdin & Goodman, 2005; Johansen et al., 2007) or direct gravitational collapse (Goldreich & Ward, 1973; Youdin & Shu, 2002).
10.2 Potential Physical Origins
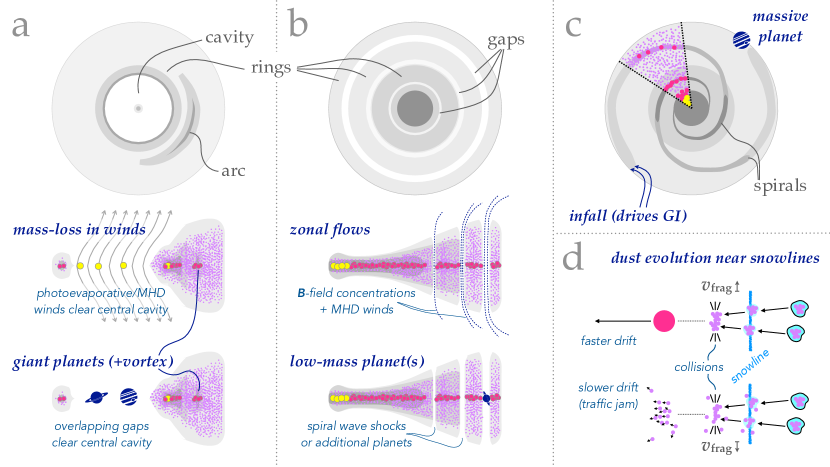
The hypothesis that substructures are both elemental disk characteristics and fundamental aspects of the planet formation process is agnostic about their physical origins. However, a remarkable variety of ways to generate substructures that trap migrating solids (or otherwise perturb their migration) have been proposed in the literature. The discussion below highlights these mechanisms, coarsely grouped into three general categories. The schematics in Figure 10 illustrate how some of these mechanisms are manifested as small-scale perturbations to the distributions of gas and solids in the disk.
10.2.1 Fluid Mechanics
The physical conditions in disks are subject to various (magneto-)hydrodynamic flows and instabilities that locally perturb gas pressures. For example, the mechanics of disk dispersal itself can substantially reshape the disk structure. Depending on the mass-loss profile, simulations of outflows from MHD-driven winds (Suzuki et al., 2016; Takahashi & Muto, 2018) or photoevaporative flows (Alexander et al., 2014; Ercolano & Pascucci, 2017) predict a ring-shaped pressure maximum at tens of au, with a depleted (or even empty) cavity interior to it (see Figure 10a).
Even without imposing a special evolutionary state, generic fluid mechanics properties likely also play roles in substructure formation. Turbulence generates stochastic modulations that concentrate particles and diminish their drift rates (Cuzzi et al., 2001; Pan et al., 2011). That behavior might predict a disk mottled with substructures on the eddy scale ( ), but many simulations demonstrate that MHD turbulence tends to self-organize into more coherent features in the distribution, including spirals (Heinemann & Papaloizou, 2009; Flock et al., 2011) and axisymmetric undulations (Johansen et al., 2009; Dittrich et al., 2013). The latter are produced when the gas dynamics are modified by spontaneous, concentric concentrations of magnetic flux, which repel gas from regions of peak magnetic stress and pile it up at neighboring annuli (Uribe et al., 2011; Bai & Stone, 2014; Simon & Armitage, 2014; Béthune et al., 2016; Suriano et al., 2017, 2018). These zonal flows create narrow ( few to 10 ) depletions (gaps) and enhancements (rings) in at tens of au that are expected to trap and concentrate solids (see Figure 10b).
In very dense regions of the disk, the ionization rate can be diminished enough to stifle turbulence from the MRI (Gammie, 1996). The radial variation of into such a “dead zone” modifies the gas flow and can thereby produce a strong, axisymmetric maximum in at the laminar/turbulent boundary (Regály et al. 2012; Dzyurkevich et al. 2013). These transitions at dead zone boundaries can generate vortices through the Rossby wave instability (Lovelace et al., 1999; Lyra et al., 2009), resulting in radially narrow () but azimuthally extended () pressure maxima (Lyra & Lin, 2013; Baruteau & Zhu, 2016). There are alternative ways to cultivate vortices, including baroclinic instabilities (Klahr & Bodenheimer, 2003), which can be amplified by feedback from the solids (Lorén-Aguilar & Bate, 2015, 2016), and the vertical shear instability (Richard et al., 2016). Vortices attract and concentrate migrating solids, making them especially compelling sites for planetesimal formation (Barge & Sommeria, 1995; Klahr & Henning, 1997; Klahr & Bodenheimer, 2006), and can also imprint long-lasting rings and gaps in (e.g., Surville et al., 2016).
For sufficiently dense and cold configurations, self-gravity can drive a global gravitational instability (GI) that imposes a large-scale spiral pattern onto the disk structure (see Figure 10c; Toomre 1964; Boss 1997). A more unstable disk produces lower order modes (fewer arms) and more open (loosely-wrapped) patterns (e.g., Kratter & Lodato, 2016). The pressure peaks of the spiral waves concentrate and foster the growth of drifting particles (Rice et al., 2004; Dipierro et al., 2015). At early evolutionary stages, asymmetric envelope accretion could drive the global GI (Laughlin & Bodenheimer, 1994; Tomida et al., 2017; Hall et al., 2019). That infall process could also create vortices (Bae et al., 2015), generate an unstable shock that propagates in spiral density waves (Lesur et al., 2015), or magnetically imprint over-densities in concentric rings (Suriano et al., 2017).
Various other modes of gas–particle coupling could also precipitate substructures in and perhaps accelerate planetesimal formation if the solids-to-gas ratio is enhanced. Two interesting examples are cases where ring-shaped particle over-densities are self-induced by a dynamical feedback (solids on gas) process (Dra̧żkowska et al., 2016; Gonzalez et al., 2017) or a viscous feedback instability where solid enhancements diminish and perturb the gas dynamics (Wünsch et al., 2005; Dullemond & Penzlin, 2018). A special focus has been on the secular GI, which occurs when gas drag slows the self-gravitational collapse of solids enough to shear out the over-densities into narrow rings (Shariff & Cuzzi, 2011; Youdin, 2011). Simulations of the secular GI find -scale (perhaps clumpy) concentric peaks in , provided the turbulence is low (; Takahashi & Inutsuka 2014, 2016).
Obviously a remarkable variety of mechanisms in the broader fluid dynamics category can theoretically generate perturbations in (or ) that are sufficient to mitigate the drift problem and promote the local concentration of solids. In this general picture, the disk substructures produced by these internal, naturally-occurring mechanisms represent the fundamental initial conditions for planetesimal (and thereby planet) formation.
10.2.2 Dynamical Interactions with Companions
Gravitational (tidal) perturbations by a companion are a less subtle means of modifying disk properties, but are capable of generating a similar diversity of substructures as in the fluid mechanics category. The emphasis here is on planets, although analogous effects are relevant for stellar binaries (Section 6.2). Once it has accumulated sufficient mass, a planetary companion interacts with the disk, generating spiral shocks that transfer angular momentum and repel disk material away from its orbit (Lin & Papaloizou, 1979, 1986; Goldreich & Tremaine, 1980). That perturbation can clear an annular gap in , with a width and depth that depend on the planet mass and the local turbulent diffusion and thermal structure of the gas disk (Kley & Nelson, 2012). The pressure maxima produced outside the gap, around the planetary orbit, can trap drifting solids (Rice et al., 2006; Paardekooper & Mellema, 2006; Zhu et al., 2012).
More dramatic perturbations to disk structures are produced by more massive (giant) planetary companions ( MJup). Systems of multiple giant planets can have overlapping gaps that deplete over a wide radial range (see Figure 10a; Dodson-Robinson & Salyk 2011; Zhu et al. 2011), and may excite vortices or eccentric modes that generate strong azimuthal asymmetries in the pressure structure (Kley & Dirksen, 2006; Ataiee et al., 2013; Zhu et al., 2014). If the companion orbit is inclined with respect to the disk plane, it can warp (Nealon et al., 2018) or even dynamically isolate (“break”) the disk into components with very different orientations (Owen & Lai, 2017; Zhu, 2019). Much lower mass planets ( M⊕) can still generate substructures in , even if they only weakly perturb (see Figure 10b; Dipierro et al. 2016; Rosotti et al. 2016). If turbulence is suppressed enough that the disk is essentially inviscid, low-mass planets can make a distinctive W-shaped radial variation in the particle distribution (with the planet orbit at the central peak; Dong et al. 2017) and drive secondary and tertiary spiral arms that deposit angular momentum far interior to the planet orbit in near-circular shocks that also perturb (Bae et al., 2017; Bae & Zhu, 2018). Giant planets at large disk radii can also foster large-scale =2 spiral modes interior to their orbits (Figure 10c; Zhu et al. 2015; Dong et al. 2015).
10.2.3 Condensation Fronts
Substructures in can also be induced without local pressure maxima (see Section 10.2.1). A popular example is associated with the sublimation of icy particles as they migrate across condensation fronts (snowlines). In that scenario, three factors are relevant to consider. First, ice sublimation is a net mass loss for the solids, and therefore is depleted inside a snowline (Stammler et al., 2017) over a radial range that depends on the coagulation timescales; efficient growth implies a narrow range. Second, gas that has been liberated from ices can be mixed back across the snowline and re-condensed (Stevenson & Lunine, 1988; Cuzzi & Zahnle, 2004; Ros & Johansen, 2013; Ros et al., 2019). This might help enhance particle growth and therefore in a zone outside the snowline, with a width that depends on diffusion and migration rates.
The third factor is perhaps most significant. Ices can change the effective particle strengths (parameterized by the critical velocity for fragmentation, ), and thereby affect collision outcomes. Pinilla et al. (2017b) considered how molecular bonds in ices affect particle strengths, arguing that increases at the (CO or) CO2 and NH3 snowlines and decreases at the H2O snowline. This results in enhancements (depletions) of larger (smaller) particles between the H2O and (CO or) CO2 snowlines, although diffusion () affects the details (analogous to the top part of Figure 10d). If decreases across a snowline, collisions can become destructive and the smaller fragments drift more slowly; the associated congestion increases like a traffic jam (Birnstiel et al., 2010; Saito & Sirono, 2011). Okuzumi et al. (2016) argued that sintering during coagulation (Sirono, 2011) diminishes , and therefore can enhance due to the reduced migration rates of small fragments, in narrow zones outside the snowlines of even rare volatile species. These latter scenarios are illustrated in the bottom part of Figure 10d, although the sintering case would be shifted beyond the snowline (i.e., to the right in that diagram).
The interplay between these factors is complex (e.g., Ciesla & Cuzzi, 2006; Estrada et al., 2016), and likely complicated further by feedback reactions where particle accumulations affect the gas or solid dynamics (Dra̧żkowska & Alibert, 2017; Schoonenberg & Ormel, 2017; Gárate et al., 2019). The potential outcomes are diverse. However, the fundamental link to the disk temperatures means that the substructures associated with these mechanisms occur at special locations, and should be concentric and symmetric (presuming is dominated by a radial gradient). In some sense, these limits to the flexibility of predictions from this idea could be helpful for observational tests, at least compared to the broad universe of options available from the fluid dynamics effects or planet-disk interactions outlined above.
10.3 Signatures of Substructures
Given the myriad physical processes capable of perturbing and/or , it is reasonable to expect that any given disk is riddled with substructures. To find them and assess their origins, demographic dependences, and general roles in disk evolution and planet formation, measurements that characterize the forms, locations, sizes, and amplitudes of those features are crucial. Some generic predictions about the properties of substructures can serve as useful guides for designing observations. A stable perturbation to can have a characteristic size as small as (e.g., Dullemond et al., 2018). For a standard disk temperature profile, –0.10. That implies substructures might subtend only 5–50 milliarcseconds for projected separations of 0.05–0.5 arcseconds from the host star of a typical disk target ( pc). Short-lived, stochastic features in the gas and the spatial concentrations of solids embedded in local pressure maxima could be even smaller. Pressure perturbations with 20% amplitudes could be sufficient to trap drifting solids (Pinilla et al., 2012b). That sets a crude benchmark on the sensitivity goals, although a focus on the strongly amplified signal from trapped solids can substantially improve the search yields.
Obviously, those predictions foreshadow a challenging observational task. However, the high-fidelity datasets at novel resolutions that have become available over the past five years have enabled a first detailed look at disk substructures. The next sections explore some general properties and physical insights about such features from these initial measurements.
10.3.1 Morphology
High resolution images of disks in their optical/infrared scattered light or mm continuum emission have identified substructures and characterized their morphologies at effectively all spatial scales down to the current resolution limits, 1–5 au (Zhang et al. 2016; Garufi et al. 2018; Andrews et al. 2018b; Long et al. 2018b). Figure 11 shows a gallery of images that highlights their morphological diversity. While there are some subtle complexities, and a considerable overlap that indicates more of a continuum of substructure patterns, it is reasonable to group the morphological types into four broad categories.
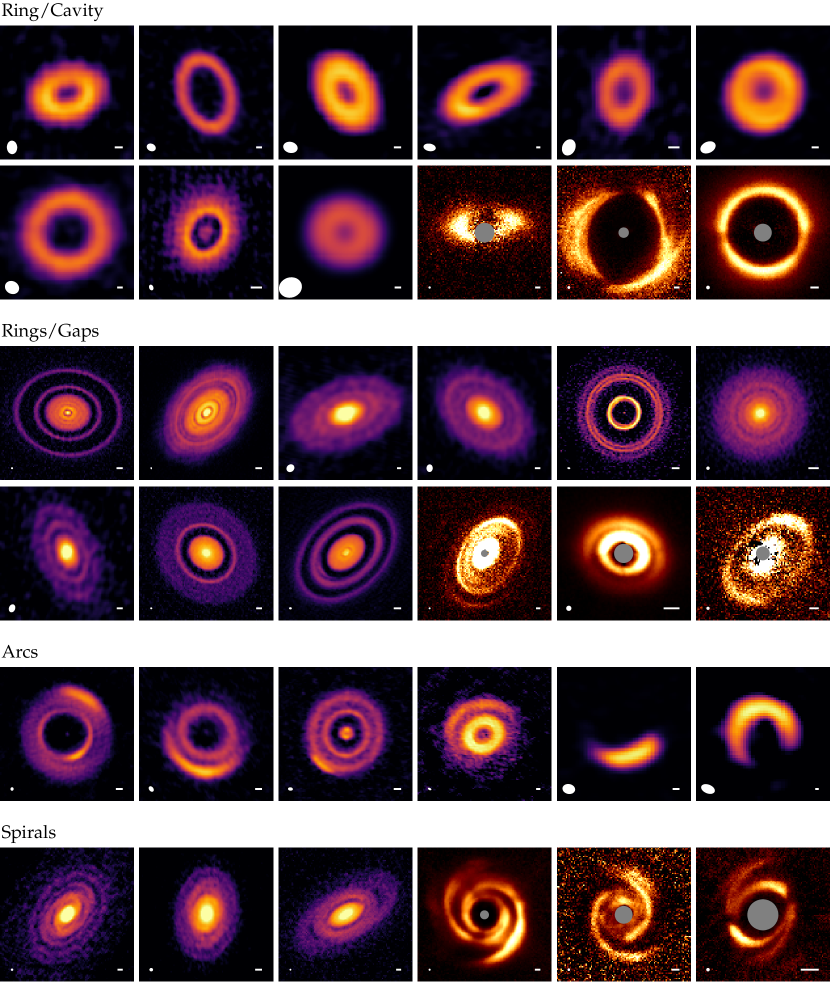
Ring/Cavity. This is the canonical morphology for a “transition” disk (Espaillat et al., 2014), with a primary narrow ring (usually peaking at of au, though that is likely a selection bias) that encircles a depleted cavity (Piétu et al., 2007; Brown et al., 2009; Andrews et al., 2011). The cavities are usually, but not always, cleared enough to depress the infrared SED (Calvet et al., 2002; Espaillat et al., 2007; van der Marel et al., 2016c). Disks with this morphology offer the best observational evidence for particle traps in local maxima, given their amplified (narrow, bright) concentrations of mm/cm continuum emission (Pinilla et al., 2012b, 2018b) and the lower amplitude and more spatially extended perturbations (both inside the cavity and to larger ) of line emission (tracing gas; Hughes et al. 2009b; van der Marel et al. 2015b, 2016b) and scattered light (probing small grains that are well coupled to the gas; Dong et al. 2012; Mayama et al. 2012; Villenave et al. 2019).
Rings/Gaps. This refers to a concentric, axisymmetric pattern of alternating intensity enhancements (rings) and depletions (gaps). It is the most common substructure morphology identified in the mm continuum (ALMA Partnership et al., 2015; Andrews et al., 2016; Huang et al., 2018b; Long et al., 2018b) and scattered light (Quanz et al., 2013; Akiyama et al., 2015; Rapson et al., 2015; Ginski et al., 2016; de Boer et al., 2016; Avenhaus et al., 2018). There are clear variants within this category, with options spanning from cases where the entire disk can be decomposed into narrow gaps and rings (e.g., CI Tau, Clarke et al. 2018; AS 209, Guzmán et al. 2018) to a single gap that separates an inner emission core from an outer ring (e.g., V883 Ori, Cieza et al. 2016; DS Tau, Long et al. 2018b).
Arcs. Non-axisymmetric substructures seem to be rare, although some disks exhibit arc features that span a limited range of azimuth. These arcs can be manifested as a partial ring around a central cavity, where the brightness asymmetry can range from severe ( 100; van der Marel et al. 2013; Casassus et al. 2013) to mild (2; Isella et al. 2013; Pérez et al. 2014; Loomis et al. 2017). Or, they can appear as additional substructures, located exterior to a ring/cavity morphology (Marino et al., 2015; van der Marel et al., 2016a; Kraus et al., 2017; Boehler et al., 2018) or in a gap (Isella et al., 2018; Pérez et al., 2018b).
Spirals. Large-scale spiral patterns are most prevalent in scattered light images, ranging from pronounced =2 modes with modest brightness asymmetries and a relatively open morphology (Muto et al., 2012; Grady et al., 2013; Akiyama et al., 2016) to more intricate, tightly-wrapped, and asymmetric structures (Hashimoto et al., 2011; Avenhaus et al., 2014; Garufi et al., 2016; Monnier et al., 2019). There are only three known examples of disks around single star hosts that exhibit a spiral pattern in the mm continuum (Pérez et al., 2016; Huang et al., 2018c), in each case with a large, symmetric, two-armed pattern. Extended, complex spirals have been identified in spectral line emission in three (different) cases (Tang et al., 2012, 2017; Christiaens et al., 2014; Teague et al., 2019).
Of course, individual disks can include features with multiple morphological types. Some examples were mentioned above for arc shapes, but there are also cases where rings, gaps, and a cavity (e.g., DM Tau, Kudo et al. 2018; Sz 129, Huang et al. 2018b) or rings, gaps, and spirals (Huang et al., 2018c) co-exist in the same disk and for the same observational tracer. Moreover, that mixing of morphological types can be striking when comparing images of the same disk in different tracers: the MWC 758 and SAO 206462 disks are favorite examples, showing spirals in scattered light (Benisty et al., 2015; Stolker et al., 2016), but rings, gaps, cavities, and arcs in the mm continuum (Dong et al., 2018c; Cazzoletti et al., 2018). This could be the hallmark of multiple mechanisms operating simultaneously, with different processes manifesting more clearly in tracers of the gas or the solids, or it could be indicative of a changing morphology as a function of altitude. There are some tentative preferences for certain morphological types as a function of , age, and perhaps other demographic properties (Garufi et al., 2018), but selection effects are still a considerable problem; an unbiased census for substructures is not yet available.
10.3.2 Locations, Sizes, and Amplitudes
The ring/gap substructures in disks are found at essentially any radial location, from the resolution limit (a few au) out to the detection threshold ( 300 au; Huang et al. 2018b; van Terwisga et al. 2018). Ring/cavity and arc substructures are preferentially identified at larger (tens of au), although that is likely a resolution bias (Huang et al., 2018b; Pinilla et al., 2018a). There are no obvious relationships between substructure locations and host properties (Pinilla et al., 2018a; Long et al., 2018b; Huang et al., 2018b; van der Marel et al., 2019). There is a propensity to find more distant substructures in larger disks, but it is not clear if this is a physical connection (those disks are larger and brighter because they produced more distant substructures) or a trivial artifact. First, more distant substructures should be larger (higher ) and therefore easier to find. And second, even if substructures exist at the same large for disks with smaller , there is no continuum emission at to trace them; they would likely be missed. With those considerations in mind, the current suite of observations are consistent with the idea that there are no special locations essential for substructure formation.
The observed radial separations between neighboring ring or gap substructures in the mm continuum (peak-to-peak or trough-to-trough) span the range –0.5 (where is the midpoint between two features; Huang et al. 2018b), corresponding to characteristic spacings –10 . The low end of that range is uncertain, since more compact spacings (especially in the inner disk) can be missed with limited resolution. A few disks include substructure pairings that have spacings commensurate with mean-motion resonances (Huang et al., 2018b). The two-dimensional nature of spiral substructures makes it difficult to define spacings (or locations). The pitch angles of two-armed spirals are typically 10–20∘ (perhaps with modest radial gradients) in both scattered light (Muto et al., 2012; Yu et al., 2019) or mm continuum (Huang et al., 2018c) measurements. Simulations predict that the scattered light spirals should be more open than the mm continuum for a given disk, due primarily to the vertical temperature gradient (the scattered light tracers a higher, and therefore warmer, layer; Juhász & Rosotti 2018). It is possible that more tightly-wound configurations could be mistaken for rings or arcs.
Measurements of substructure widths are difficult because most features are not well resolved. The broader rings/gaps in the mm continuum have –0.5, implying widths (Huang et al., 2018b; Dullemond et al., 2018; Long et al., 2018b). The radial widths of most gaps, arcs, and spirals (i.e., in cuts perpendicular to tangent points) are 5–10 au. The characteristic size distribution of substructures clearly extends below current resolution limits, but inferences of sub-resolution feature widths should be regarded with a healthy skepticism since they are strongly dependent on the adopted model prescription. There is more diversity in the widths of rings, since there are many instances of extended (apparently smooth) cores, bands, or belts of emission that strain the simplistic morphological definition. There is also considerable variety in the azimuthal extents of arcs, ranging from 5 to 100∘ (e.g., Casassus et al., 2013; Tsukagoshi et al., 2019b).
Limited resolution also makes it challenging to quantify substructure contrasts. If the features are not well resolved, peaks could be higher and troughs could be lower than they appear: contrasts should be considered lower bounds. Moreover, mm continuum ring intensities will saturate at high optical depths: in that scenario, inferences of contrasts could be much higher than the contrasts imply. For the well-resolved ring/gap pairs, contrasts range from a few percent to a factor of 100 (Huang et al., 2018b; Long et al., 2018b; Avenhaus et al., 2018). Contrasts inferred for ring/cavity or arc substructures can be even higher (Andrews et al., 2011; van der Marel et al., 2013; Pinilla et al., 2018b). The contrasts between spirals and the local inter-arm material depends strongly on the tracer: while it can be high in scattered light (e.g., Benisty et al., 2015; Stolker et al., 2016), it is 3 in the few examples available for the mm continuum (Huang et al., 2018c).
There are fewer quantitative constraints available for the substructure properties based on the intensity distributions of key gas tracers. In the ring/cavity cases, the gas is found to extend to smaller radii than the mm/cm solids, although it ultimately is depleted to comparable levels (van der Marel et al., 2015b, 2016b). In some cases, spectral line measurements demonstrate that additional rings/gaps continue at distances well beyond the continuum emission (Huang et al., 2018a; Guzmán et al., 2018). Some preliminary analyses indicate that spectral line depletions (gaps) track their continuum counterparts (e.g., Isella et al., 2016, 2018). But generally, the relative lack of emission line constraints is largely a technical limitation, since such observations at very high resolution are considerably more expensive than for the mm continuum or scattered light. Such measurements are of high value, and should play increasingly important roles in future work.
10.3.3 Optical Depth Fine-Tuning
One subtle, puzzling outcome from the suite of new high resolution mm continuum observations potentially has wide-reaching implications. Presuming that continuum emission is optically thin, and adopting a simple prescription for , the observed intensities at most substructure peaks imply (within a factor of two) at mm (Huang et al., 2018b; Dullemond et al., 2018). That value is suspiciously similar to the estimated from the shape of the – relation (Section 4.1; Tripathi et al. 2017). This fine-tuning seems artificial, as if it points to some important underlying process or flawed assumption. So far, three ideas have been proposed to explain it.
The first idea is a geometric argument: it presumes the emission is optically thick, but that the true brightness distribution is concentrated on sub-resolution scales (Tripathi et al., 2017; Andrews et al., 2018a). The second idea is a radiative transfer argument: it again presumes the emission is optically thick, but adds that self-scattering for particles with very high albedos () is important (Zhu et al., 2019). In that case, scattering diminishes the intensities , making the emission appear (marginally) optically thin even if the true is arbitrarily high. That said, the high requirement maps onto a narrow range (): it is worth considering the plausibility of populating the layers of disks with a very specific size distribution, or if this is just a change of variable for the fine-tuning problem (from to at a special altitude). The third idea is a physical argument: it takes the marginally thin optical depths at face value and considers a self-regulating exchange between and in local pressure maxima (Stammler et al., 2019). In this case, particle evolution simulations can explain the data if a fraction (10%) of the solid mass is converted into planetesimals whenever the solids-to-gas ratio approaches unity.
While these ideas are fleshed out, it is important to evaluate more generally the implications of the two optically thick hypotheses. High optical depths are natural explanations for the – relation, as well as the low (Zhu et al., 2019; Liu, 2019) or in the inner disk regions (Figure 9) and substructure rings (Carrasco-González et al., 2016, 2019; Tsukagoshi et al., 2016; Huang et al., 2018a). However, this would force a re-evaluation of traditional estimates of disk masses and densities (Section 2), shift the interpretations of various demographic trends (Section 6), and perhaps severely complicate the analyses of spectral line observations (e.g., Weaver et al., 2018). Given the scope of what is at stake, identifying the origins of this fine-tuning puzzle is certainly a high priority.
10.3.4 Sample Bias and Resolution Limitations
The current sample of very high resolution measurements in the mm continuum or scattered light is biased in favor of larger, brighter disks that preferentially orbit more massive host stars (Andrews et al., 2018b; Garufi et al., 2018). This is a practical restriction, but also in some sense by design. To find and measure substructures with characteristic sizes at the resolutions (and inner working angles) available from current facilities requires them to be located at –50 au. A more representative target, around a host with half the mass and 5–10 lower , would typically have its tracer emission concentrated within that critical radius. If the substructures closer to the stellar hosts are like those we find at larger (i.e., widths ), these smaller disks will appear smooth even if they are also riddled with substructures.
Indeed, there is plenty of evidence that the distribution of continuum substructure sizes extends below -scales and current resolution limits (e.g., from the many partially resolved features mentioned by Huang et al. 2018b). The advantageous distance of the TW Hya disk offers an instructive example: nearly all of its rings and gaps are narrow enough that they would be indistinguishable from an unperturbed emission profile if the system were moved out to the nearest young clusters (see Andrews et al., 2016; Huang et al., 2018a). This is not to say that efforts to find especially large substructures in more representative samples are undesirable: rather, the point is that any conclusions about the prevalence of substructures need to be contextualized to the accessible range of substructure sizes.
10.3.5 Kinematics
Another approach to quantifying substructures in involves a search for the associated deviations in the radial velocity profile of the gas, . These non-Keplerian motions can be identified when the residual velocity profile, , flips sign over a narrow spatial range: that signal can then be related to the local pressure gradient (Section 10.1). Observational constraints on the spatial patterns of offer independent, kinematic insights on substructures that complement their intensity characterizations based on high resolution spectral line or continuum images.
With sufficient resolution and sensitivity, (sub-)mm spectral line datasets can be used to reconstruct azimuthally-averaged profiles in the line photosphere layers (Teague et al., 2018a, c; Pérez et al., 2018a). That technique has been used to identify kinematic perturbations with 5–10% amplitudes (at roughly percent level precision) that spatially coincide with known substructures in the mm continuum. Naturally, the azimuthal averaging required to tease out small signals means that it is unclear whether or not those kinematic deviations are axisymmetric. If the perturbations are tracing the spiral wakes expected from planet-disk interactions, the signal would peak in the immediate vicinity of the perturber (Pérez et al., 2015b, 2018a; Kanagawa et al., 2015; Teague et al., 2018a; Zhang et al., 2018). Especially strong localized sign-flips have been identified in a few cases (Pinte et al., 2018b, 2019; Casassus & Pérez, 2019), lending striking support to such a dynamical origin even if the perturber itself cannot yet be directly detected.
Such kinematics constraints on disk properties are still in a relatively early stage of development, both observationally and theoretically. Nevertheless, they hold immense promise in their synergy with the more traditional measurements emphasized throughout this review. Leveraging these techniques together will be a necessary step in the push toward a more quantitative characterization of substructure properties.
10.3.6 Vertical Perturbations
The discussion above emphasizes the (, )-plane, but there are also clear signs of substructures in the vertical () dimension. These can be inferred indirectly from infrared variability (Muzerolle et al., 2009; Flaherty et al., 2012; Rebull et al., 2014), especially in cases where the variations follow a “see-saw” spectral pattern with enhancements at shorter (lower, warmer ) accompanied by depletions at longer (higher, cooler ), and vice versa (Espaillat et al., 2011). These time-domain phenomena are presumably associated with the stellar obscuration and disk shadowing that occur when the vertical distribution of inner disk material is perturbed (e.g., Turner et al., 2010). In some cases, that shadowing can be seen directly in scattered light images (Garufi et al., 2014; Benisty et al., 2018), as illustrated in Figure 12. This obscuration can be quite variable on short timescales, indicating a clumpy distribution of occulting material in the inner disk (e.g., Stolker et al., 2017; Pinilla et al., 2018c). Debes et al. (2017) discovered an especially compelling example, where an outer disk shadow moves at a rate consistent with inner disk orbital timescales. There is a hypothesis that spirals identified in scattered light could be associated with such behavior (Kama et al., 2016a; Montesinos et al., 2016).
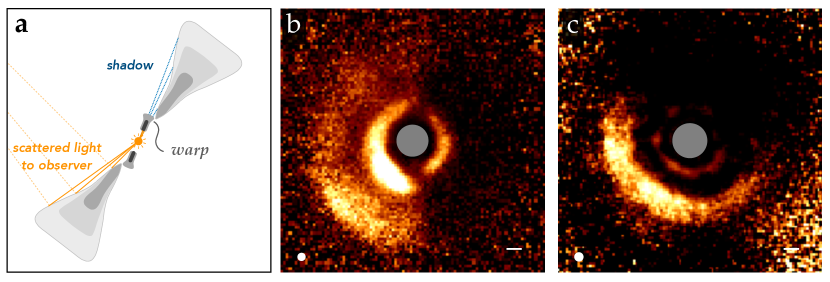
In most examples, shadows require a persistent vertical substructure in the inner disk. This is often associated with a warp, since even modest changes in the orbital inclination distribution of the disk material generate pronounced observational effects (Nealon et al., 2019). Warped geometries have been inferred kinematically with resolved spectral line data, based on the spatial variation of the projected (line-of-sight) velocities (Rosenfeld et al., 2012b, 2014; Casassus et al., 2015a; Loomis et al., 2017). Large warps or misalignments (“broken” disks) can also induce scattered light shadows at larger ; the locations and azimuthal extents of the shadows help constrain the inner disk geometry (Marino et al., 2015; Stolker et al., 2016; Facchini et al., 2018; Pinilla et al., 2018c; Casassus et al., 2018).
In any case, a variety of vertical substructures are inferred at locations (and with sizes) that are well below current resolution capabilities. Nevertheless, their effects are manifested on much larger scales in the (, ) behavior of key tracers. The important lesson is that current observations are sensitive to substructures in all three spatial dimensions.
10.4 Emerging Insights
The specific topic of disk substructures has generated immense interest. The many new opportunities for high resolution observations of disks have triggered a marked pivot in the field toward their interpretation. Despite the deluge in the literature, it is worth keeping in mind that assessments of the broader impacts that substructures have on disk evolution and planet formation are still being actively developed. Nevertheless, it is also clear from their prevalence alone that substructures are fundamental aspects of disks: they likely have profound effects on every practical and physical facet of planet formation research.
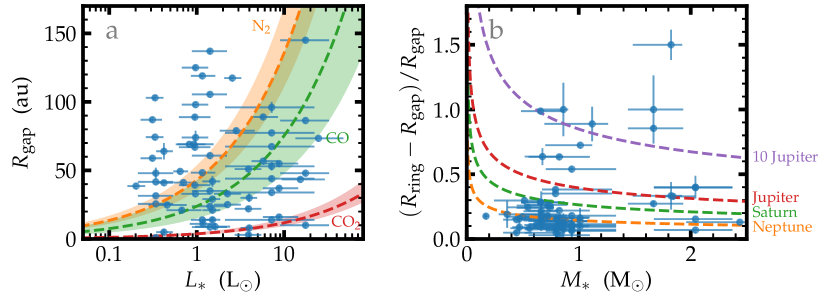
The current priority is to develop a more quantitative understanding of the physical mechanism(s) responsible for generating substructures and how they impact (or perhaps reveal ongoing) planet formation. At this point, it is fair to conclude that none of the potential origins discussed in Section 10.2 can be categorically excluded. Without rehashing a detailed comparison of the data and model predictions, there are a few generic points about the emerging themes of this analysis that are worth highlighting.
One important conclusion is that the simple empirical signatures expected from models of particle migration around snowlines (Section 10.2.3) are not observed (van Terwisga et al., 2018; Long et al., 2018b; Huang et al., 2018b; van der Marel et al., 2019). Those signatures include a rough scaling to the pattern of ring/gap locations in the mm continuum and an spacing between them, and originate from the hypothesis that such substructures occur at special locations corresponding to the condensation temperatures of abundant volatiles. Figure 13a demonstrates that these patterns are not obvious in the data. However, there is considerable diversity in the model predictions, and one cannot rule out that any individual feature (or the collection of features in individual disks) might be associated with snowlines (Zhang et al., 2015; van der Marel et al., 2018a). More extensive vetting of this hypothesis will consider the non-trivial uncertainties in the disk temperatures (Section 4.3) and the dependence of condensation temperatures on the bulk ice composition and local gas pressure. Meanwhile, some theoretical consensus would be useful: recent models predict either emission enhancements or depletions, located either inside or outside the snowline (Section 10.2.3). It would help to know whether or not that fungible range of outcomes represents an inherent physical ambiguity.
There are additional insights that disfavor the snowline hypothesis, in that there is quantitative evidence that many observed substructures do trace particle traps at local gas pressure maxima. The subset of resolved mm continuum rings are found to have the high amplitudes and narrow widths ( ) predicted for these traps (Dullemond et al., 2018). Complementary support for that conclusion is also available from the demographics (Pinilla et al., 2018b), kinematics (Teague et al., 2018a, c), diverse tracer-dependent morphologies in ring/cavity substructures (Dong et al., 2012; van der Marel et al., 2015b), and narrow azimuthal extents of continuum emission with low at the peaks of arc substructures (Birnstiel et al., 2013; van der Marel et al., 2015a; Casassus et al., 2015b). These constraints lend credibility to the fluid mechanics or planet-disk interactions hypotheses for substructure origins, although robustly discriminating between those options is perhaps not yet practical (Flock et al., 2015; Ruge et al., 2016; Dong et al., 2018).
That said, the mechanism(s) that generate these very detailed disk substructures really color the global perspective on what information can be gleaned from disk properties. If fluid perturbations from various (M)HD processes are ultimately responsible, then disks are genuinely in a classical “protoplanetary” phase, representative of incipient planet formation. Detailed measurements of their properties would illustrate how disk substructures are fundamental for making planetesimals. Much of the immediate progress to be made in testing this hypothesis will come from enhanced computational capabilities, to help develop more robust and discriminating predictions. The alternative hypothesis, that substructures are instead produced by perturbations from already-formed planetary systems, has subtle but profound implications for the standard principles of planet formation theories.
To discuss those implications, it helps to consider the masses and orbits of the youthful planetary systems that are inferred from the morphologies of the disk substructures. With reference to simulations of disk-planet interactions, the locations, widths, and depths of disk gaps (Zhang et al., 2018; Lodato et al., 2019) and cavities (e.g., Zhu et al., 2012) suggest perturber masses from a few M⊕ to 10 MJup orbiting at semimajor axes of 10–150 au (around a representative Sun-like host). Figure 13b illustrates some representative results. Note that this is a different (complementary) region of parameter-space for planetary system architectures than has been probed in exoplanet surveys around mature host stars (early direct imaging constraints overlap at the high-mass end). The timescales to form such planets in the standard (core accretion) formation theory are considerably longer than the typical system ages (1–3 Myr). So, if such planets already exist, they require that the formation process starts very early – perhaps overlapping with the epoch of star (and disk) formation itself – or is substantially accelerated (e.g., perhaps with some variant of pebble accretion; Ormel & Klahr 2010; Lambrechts & Johansen 2012). In either case planetesimal formation must be efficient and prolific over a wide range of disk radii, presumably aided by an earlier generation of substructures (perhaps generated by an assortment of fluid dynamical mechanisms that are more prevalent during the embedded phase).
The planet-disk interaction hypothesis is certainly an exciting prospect, since it offers potential opportunities to observationally constrain planet formation timescales, planetary accretion and satellite formation (through studies of circumplanetary material), and the evolution of planetary system architectures (i.e., planetary migration). And there is increasing confidence in this option, especially from observations of strong gas depletion in disk cavities (van der Marel et al., 2015b, 2016b), spatially isolated perturbations to the disk gas dynamics that coincide with substructures (Casassus & Pérez, 2019; Pinte et al., 2019), and most importantly the direct imaging detections of young giant planets in the cavity of the PDS 70 disk (Keppler et al., 2018; Müller et al., 2018; Haffert et al., 2019). Nevertheless, there is still much work to do regarding the origins of disk substructures: assessing these forking paths is the single most important task of the coming decade in this field.
11 SYNOPSIS & OUTLOOK
[SUMMARY POINTS]
-
1.
New quantitative insights on key structure parameters are starting to bear fruit, but the intrinsic uncertainties on physical conditions suggest it is important to consider empirical metrics and translate predictions into the data-space.
-
2.
There is clear evidence for multi-dimensional demographic relationships between disk properties (mm continuum luminosities, sizes) and various dynamical (), environmental (e.g., multiplicity), and evolutionary factors.
-
3.
While observations provide strong, qualitative support for the predicted behaviors of particle growth and migration models (particularly the spatial segregation of particle sizes and the radial gradient in the solids-to-gas ratio), there is a timescale discrepancy that suggests a smooth gas pressure profile is a poor assumption.
-
4.
Small-scale substructures with a range of morphologies are found on scales comparable to throughout many (and perhaps all) disks, with dimensions and contrasts consistent with expectations for particle trapping in local gas pressure maxima.
-
5.
The origins of these substructures are not yet clear: leading contenders include an assortment of fluid instabilities or dynamical interactions with young planets. In any case, the implications are profound, in that (physical and observational) disk properties could be determined by perturbations at very small scales.
[FUTURE ISSUES]
-
1.
Quantitative constraints on the density and temperature structure of the gas in disks are essential to enable progress in the field. Investments in deep, high resolution observations of molecular spectral line emission should be prioritized.
-
2.
The velocity dimension of those spectral line datasets is a rich frontier for reaping physical information. Kinematic studies of turbulent motions and non-Keplerian deviations to the velocity field are expected to create many new opportunities to address theoretical predictions from a complementary perspective.
-
3.
There is vast potential to develop a better understanding of disk properties encoded in their demographic relationships (and associated scatter). Expanding that work to more diverse samples (e.g., ages, multiplicity parameters) and additional metrics (e.g., deeper, resolved spectral line data) would be highly valuable.
-
4.
Progress on quantifying the evolution of disk solids will require a continued pursuit of spatial variations in the mm/cm continuum spectrum and polarization properties. Folding those properties into demographics studies would be especially illuminating.
-
5.
A shift to quantitative characterizations of disk substructures – density contrasts, diffusion, particle sizes, kinematics, or their empirical equivalents – would provide welcome guidance for theoretical predictions and help better assess their origins.
-
6.
An appraisal of how the prevalence, morphologies, locations, and scales of disk substructures depend on host properties, global disk characteristics, environment, and especially age could reveal patterns that help contextualize general demographic trends and clarify the mechanics and variety of the processes that generate them.
DISCLOSURE STATEMENT
The author is not aware of any affiliations, memberships, funding, or financial holdings that might be perceived as affecting the objectivity of this review.
ACKNOWLEDGMENTS
I am very grateful to Myriam Benisty, Til Birnstiel, Marco Tazzari, and David Wilner for their detailed counsel and assistance with some of the ideas and figures in this review. Xuening Bai, John Carpenter, Kees Dullemond, Michiel Hogerheijde, Feng Long, Antonella Natta, Karin Öberg, Paola Pinilla, Richard Teague, Nienke van der Marel, Ewine van Dishoeck, Jonathan Williams, and Zhaohuan Zhu provided helpful, detailed comments on drafts that helped to substantially improve the writing, organization, and general presentation of ideas. Juan Alcalá, Jane Huang, Meredith Hughes, Kevin Flaherty, and James Owen offered useful advice that helped crystallize ideas and writing strategies. I also want to thank Megan Ansdell, Paolo Cazzoletti, Lucas Cieza, Ian Czekala, Ruobing Dong, Nathan Hendler, Stefan Kraus, Tomoyuki Kudo, Ryan Loomis, Sebastian Pérez, Dary Ruiz-Rodriguez, Pat Sheehan, Roy van Boekel, Gerrit van der Plas, and Sierk van Terwisga, in addition to some of those listed above, for kindly sharing their data. This review made extensive use of the numpy (van der Walt et al., 2011), matplotlib (Hunter, 2007), astropy (Astropy Collaboration et al., 2018), and dsharp-opac (Birnstiel et al., 2018) software packages, as well as NASA’s Astrophysics Data System and the SIMBAD database, operated at CDS, Strasbourg, France.
References
- Aikawa et al. (1997) Aikawa Y, Umebayashi T, Nakano T, Miyama SM. 1997. Ap. J. Lett. 486:L51
- Akeson & Jensen (2014) Akeson RL, Jensen ELN. 2014. Ap. J. 784:62
- Akeson et al. (2019) Akeson RL, Jensen ELN, Carpenter J, et al. 2019. Ap. J. 872:158
- Akiyama et al. (2016) Akiyama E, Hashimoto J, Liu HB, et al. 2016. Astron. J. 152:222
- Akiyama et al. (2015) Akiyama E, Muto T, Kusakabe N, et al. 2015. Ap. J. Lett. 802:L17
- Alexander et al. (2014) Alexander R, Pascucci I, Andrews S, Armitage P, Cieza L. 2014. In Protostars and Planets VI, ed. H Beuther, RS Klessen, CP Dullemond, T Henning, pp. 475-496. Tucson: Univ. Ariz. Press
- ALMA Partnership et al. (2015) ALMA Partnership, Brogan CL, Pérez LM, et al. 2015. Ap. J. Lett. 808:L3
- Alves et al. (2019) Alves FO, Caselli P, Girart JM, et al. 2019. Science 366:90-93
- Andersen et al. (2019) Andersen BC, Stephens IW, Dunham MM, et al. 2019. Ap. J. 873:54
- Andrews et al. (2013) Andrews SM, Rosenfeld KA, Kraus AL, Wilner DJ. 2013. Ap. J. 771:129
- Andrews & Williams (2005) Andrews SM, Williams JP. 2005. Ap. J. 631:1134-1160
- Andrews & Williams (2007a) —. 2007a. Ap. J. 659:705-728
- Andrews & Williams (2007b) —. 2007b. Ap. J. 671:1800-1812
- Andrews et al. (2009) Andrews SM, Wilner DJ, Hughes AM, Qi C, Dullemond CP. 2009. Ap. J. 700:1502-1523
- Andrews et al. (2010) —. 2010. Ap. J. 723:1241-1254
- Andrews et al. (2018b) Andrews SM, Huang J, Pérez LM, et al. 2018b. Ap. J. Lett. 869:L41
- Andrews et al. (2018a) Andrews SM, Terrell M, Tripathi A, et al. 2018a. Ap. J. 865:157
- Andrews et al. (2011) Andrews SM, Wilner DJ, Espaillat C, et al. 2011. Ap. J. 732:42
- Andrews et al. (2012) Andrews SM, Wilner DJ, Hughes AM, et al. 2012. Ap. J. 744:162
- Andrews et al. (2016) Andrews SM, Wilner DJ, Zhu Z, et al. 2016. Ap. J. Lett. 820:L40
- Ansdell et al. (2016) Ansdell M, Williams JP, van der Marel N, et al. 2016. Ap. J. 828:46
- Ansdell et al. (2017) Ansdell M, Williams JP, Manara CF, et al. 2017. Astron. J. 153:240
- Ansdell et al. (2018) Ansdell M, Williams JP, Trapman L, et al. 2018. Ap. J. 859:21
- Armitage (2011) Armitage PJ. 2011. Annu. Rev. Astron. Astrophys. 49:195-236
- Artymowicz & Lubow (1994) Artymowicz P, Lubow SH. 1994. Ap. J. 421:651-667
- Astropy Collaboration et al. (2018) Astropy Collaboration, Price-Whelan AM, Sipőcz BM, et al. 2018. Astron. J. 156:123
- Ataiee et al. (2013) Ataiee S, Pinilla P, Zsom A, et al. 2013. Astron. Astrophys. 553:L3
- Avenhaus et al. (2018) Avenhaus H, Quanz SP, Garufi A, et al. 2018. Ap. J. 863:44
- Avenhaus et al. (2014) Avenhaus H, Quanz SP, Schmid HM, et al. 2014. Ap. J. 781:87
- Bacciotti et al. (2018) Bacciotti F, Girart JM, Padovani M, et al. 2018. Ap. J. Lett. 865:L12
- Bae et al. (2015) Bae J, Hartmann L, Zhu Z. 2015. Ap. J. 805:15
- Bae & Zhu (2018) Bae J, Zhu Z. 2018. Ap. J. 859:118
- Bae et al. (2017) Bae J, Zhu Z, Hartmann L. 2017. Ap. J. 850:201
- Bai & Stone (2013) Bai X-N, Stone JM. 2013. Ap. J. 769:76
- Bai & Stone (2014) —. 2014. Ap. J. 796:31
- Balbus & Hawley (1991) Balbus SA, Hawley JF. 1991. Ap. J. 376:214-222
- Barenfeld et al. (2017a) Barenfeld SA, Carpenter JM, Ricci L, Isella A. 2017a. Ap. J. 827:142
- Barenfeld et al. (2017b) Barenfeld SA, Carpenter JM, Sargent AI, Isella A, & Ricci L. 2017b. Ap. J. 851:85
- Barge & Sommeria (1995) Barge P, Sommeria J. 1995. Astron. Astrophys. 295:L1-L4
- Baruteau et al. (2014) Baruteau C, Crida A, Paardekooper S-J, et al. 2014. In Protostars and Planets VI, ed. H Beuther, RS Klessen, CP Dullemond, T Henning, pp. 667-689. Tucson: Univ. Ariz. Press
- Baruteau & Zhu (2016) Baruteau C, Zhu Z. 2016. MNRAS 458:3927-3941
- Bate (2018) Bate MR. 2018. MNRAS 475:5618-5658
- Beckwith et al. (1990) Beckwith SVW, Sargent AI, Chini RS, Guesten R. 1990. Astron. J. 99:924-945
- Beckwith & Sargent (1991) Beckwith SVW, Sargent AI. 1991. Ap. J. 381:250-258
- Beckwith & Sargent (1993) —. 1993. Ap. J. 402:280-291
- Bell et al. (2013) Bell CPM, Naylor T, Mayne NJ, Jeffries RD, Littlefair SP. 2013. MNRAS 434:806-831
- Benisty et al. (2015) Benisty M, Juhasz A, Boccaletti A, et al. 2015. Astron. Astrophys. 578:L6
- Benisty et al. (2017) Benisty M, Stolker T, Pohl A, et al. 2017. Astron. Astrophys. 597:A42
- Benisty et al. (2018) Benisty M, Juhász A, Facchini S, et al. 2018. Astron. Astrophys. 619:A171
- Benz et al. (2014) Benz W, Ida S, Alibert Y, et al. 2014. In Protostars and Planets VI, ed. H Beuther, RS Klessen, CP Dullemond, T Henning, pp. 691-713. Tucson: Univ. Ariz. Press
- Bergin et al. (2013) Bergin EA, Cleeves LI, Gorti U, et al. 2013. Nature 493:644-646
- Bertrang et al. (2017) Bertrang GHM, Flock M, Wolf S. 2017. MNRAS 464:L61-L64
- Bertrang & Wolf (2017) Bertrang GHM, Wolf S. 2017. MNRAS 469:2869-2878
- Béthune et al. (2016) Béthune W, Lesur G, & Ferreira J. 2016. Astron. Astrophys. 589:A87
- Birnstiel et al. (2009) Birnstiel T, Dullemond CP, Brauer F. 2009. Astron. Astrophys. 503:L5-L8
- Birnstiel et al. (2010) —. 2010. Astron. Astrophys. 513:A79
- Birnstiel et al. (2011) Birnstiel T, Ormel CW, Dullemond CP. 2011. Astron. Astrophys. 525:A11
- Birnstiel et al. (2012) Birnstiel T, Klahr H, Ercolano B. 2012, Astron. Astrophys. 539:A148
- Birnstiel et al. (2013) Birnstiel T, Dullemond CP, Pinilla P. 2013. Astron. Astrophys. 550:L8
- Birnstiel & Andrews (2014) Birnstiel T, Andrews SM. 2014. Ap. J. 780:153
- Birnstiel et al. (2015) Birnstiel T, Andrews SM, Pinilla P, Kama M. 2015. Ap. J. Lett. 813:L14
- Birnstiel et al. (2018) Birnstiel T, Dullemond CP, Zhu Z, et al. 2018. Ap. J. Lett. 869:L45
- Blandford & Payne (1982) Blandford RD, Payne, DG. 1982. MNRAS 199:883-903
- Boehler et al. (2013) Boehler Y, Dutrey A, Guilloteau S, Piétu V. 2013. MNRAS 431:1573-1586
- Boehler et al. (2018) Boehler Y, Ricci L, Weaver E, et al. 2018. Ap. J. 853:162
- Bohn et al. (2019) Bohn AJ, Kenworthy MA, Ginski C, et al. 2019. Astron. Astrophys. 624:A87
- Booth et al. (2019) Booth AS, Walsh C, Ilee JD, et al. 2019. Ap. J. Lett. 882:L31
- Bosman et al. (2018) Bosman AD, Walsh C, van Dishoeck E. 2018. Astron. Astrophys. 618:A182
- Boss (1997) Boss, AP. 1997. Science 276:1836-1839
- Boudet et al. (2005) Boudet N, Mutschke H, Nayral C, et al. 2005. Ap. J. 633:272-281
- Brauer et al. (2007) Brauer F, Dullemond CP, Johansen A, et al. 2007. Astron. Astrophys. 469:1169-1182
- Brauer et al. (2008) Brauer F, Dullemond CP, Henning T. 2008. Astron. Astrophys. 480:859-877
- Brauer et al. (2017) Brauer R, Wolf S, Flock M. 2017. Astron. Astrophys. 607:A104
- Breslau et al. (2014) Breslau A, Steinhausen M, Vincke K, Pfalzner S. 2014. Astron. Astrophys. 565:A130
- Brinch et al. (2016) Brinch C, Jørgensen JK, Hogerheijde MR, Nelson RP, Gressel O. 2016. Ap. J. Lett. 830:L16
- Brown et al. (2009) Brown JM, Blake GA, Qi C, et al. 2009. Ap. J. 704:496-502
- Bruderer (2013) Bruderer S. 2013. Astron. Astrophys. 559:A46
- Calvet et al. (1991) Calvet N, Patino A, Magris GC, D’Alessio P. 1991. Ap. J. 380:617-630
- Calvet et al. (2002) Calvet N, D’Alessio P, Hartmann L, et al. 2002. Ap. J. 568:1008-1016
- Carrasco-González et al. (2016) Carrasco-González C, Henning T, Chandler CJ, et al. 2016. Ap. J. Lett. 821:L16
- Carrasco-González et al. (2019) Carrasco-González C, Sierra A, Flock M, et al. 2019. Ap. J. 883:71
- Casassus et al. (2013) Casassus S, van der Plas G, Pérez S, et al. 2013. Nature 493:191-194
- Casassus et al. (2015a) Casassus S, Marino S, Pérez S, et al. 2015a. Ap. J. 811:92
- Casassus et al. (2015b) Casassus S, Wright CM, Marino S, et al. 2015b. Ap. J. 812:126
- Casassus et al. (2018) Casassus S, Avenhaus H, Pérez S, et al. 2018. MNRAS 477:5104-5114
- Casassus & Pérez (2019) Casassus S, Pérez S. 2019. Ap. J. Lett. 883:L41
- Cazzoletti et al. (2018) Cazzoletti P, van Dishoeck EF, Pinilla P, et al. 2018. Astron. Astrophys. 619:A161
- Chiang & Goldreich (1997) Chiang EI, Goldreich P. 1997. Ap. J. 490:368-376
- Chiang & Laughlin (2013) Chiang E, Laughlin G. 2013. MNRAS 431:3444-3455
- Cho & Lazarian (2007) Cho J, Lazarian A. 2007. Ap. J. 669:1085-1097
- Christiaens et al. (2014) Christiaens V, Casassus S, Pérez S, van der Plas G, Ménard F. 2014. Ap. J. Lett. 785:L12
- Ciesla & Cuzzi (2006) Ciesla FJ, Cuzzi JN. 2006. Icarus 181:178-204
- Cieza et al. (2015) Cieza L, Williams J, Kourkchi E, et al. 2015. MNRAS 454:1909-1920
- Cieza et al. (2016) Cieza LA, Casassus S, Tobin J, et al. 2016. Nature 535:258-261
- Cieza et al. (2019) Cieza LA, Ruíz-Rodríguez D, Hales A, et al. 2019. MNRAS 482:698-714
- Clarke & Pringle (1993) Clarke CJ, Pringle JE. 1993. MNRAS 261:190-202
- Clarke et al. (2018) Clarke CJ, Tazzari M, Juhász A, et al. 2018. Ap. J. Lett. 866:L6
- Cleeves et al. (2013) Cleeves LI, Adams FC, Bergin EA, Visser R. 2013. Ap. J. 777:28
- Cleeves et al. (2017) Cleeves LI, Bergin EA, Öberg KI, et al. 2017. Ap. J. Lett. 843:L3
- Cox et al. (2017) Cox EG, Harris RJ, Looney LW, et al. 2017. Ap. J. 851:83
- Cuello et al. (2019b) Cuello N, Dipierro G, Mentiplay D, et al. 2019. MNRAS 483:4114-4139
- Cuzzi et al. (2001) Cuzzi JN, Hogan RC, Paque JM, et al. 2001. Ap. J. 546:496-508
- Cuzzi & Zahnle (2004) Cuzzi JN, Zahnle KJ. 2004. Ap. J. 614:490-496
- Cuzzi et al. (2014) Cuzzi JN, Estrada PR, Davis, SS. 2014. Ap. J. Suppl. 210:21
- Czekala et al. (2015) Czekala I, Andrews SM, Jensen ELN, et al. 2015. Ap. J. 806:154
- D’Alessio et al. (1997) D’Alessio P, Calvet N, Hartmann L. 1997. Ap. J. 474:397-406
- D’Alessio et al. (2001) —. 2001. Ap. J. 553:321-334
- D’Alessio et al. (1998) D’Alessio P, Cantó J, Calvet N, Lizano S. 1998. Ap. J. 500:411-427
- D’Alessio et al. (1999) D’Alessio P, Calvet N, Hartmann L, Lizano S, Cantó J. 1999. Ap. J. 527:893-909
- D’Alessio et al. (2006) D’Alessio P, Calvet N, Hartmann L, Franco-Hernández R, Servín H. 2006. Ap. J. 638:314-335
- Dartois et al. (2003) Dartois E, Dutrey A, Guilloteau S. 2003. Astron. Astrophys. 399:773-787
- de Boer et al. (2016) de Boer J, Salter G, Benisty M, et al. 2016. Astron. Astrophys. 595:A114
- de Juan Ovelar et al. (2012) de Juan Ovelar M, Kruijssen JMD, Bressert E, et al. 2012. Astron. Astrophys. 546:L1
- Debes et al. (2017) Debes JH, Poteet CA, Jang-Condell H, et al. 2017. Ap. J. 835:205
- Dent et al. (2019) Dent WRF, Pinte C, Cortes PC, et al. 2019. MNRAS 482:L29-L33
- Dipierro et al. (2015) Dipierro G, Pinilla P, Lodato G, Testi L. 2015. MNRAS 451:974-986
- Dipierro et al. (2016) Dipierro G, Laibe G, Price DJ, Lodato G. 2016. MNRAS 459:L1-L5
- Dittrich et al. (2013) Dittrich K, Klahr H, Johansen A. 2013. Ap. J. 763:117
- Dodson-Robinson & Salyk (2011) Dodson-Robinson SE, Salyk C. 2011. Ap. J. 738:131
- Dohnanyi (1969) Dohnanyi JS. 1969. Journal Geo. Research 74:2531-2554
- Dominik & Tielens (1997) Dominik C, Tielens AGGM. 1997. Ap. J. 480:647-673
- Dong et al. (2012) Dong R, Rafikov R, Zhu Z, et al. 2012. Ap. J. 750:161
- Dong et al. (2015) Dong R, Zhu Z, Rafikov RR, Stone, JM. 2015. Ap. J. Lett. 809: L5
- Dong et al. (2017) Dong R, Li S, Chiang E, Li H. 2017. Ap. J. 843:127
- Dong et al. (2018c) Dong R, Liu S-y, Eisner J, et al. 2018a. Ap. J. 860:124
- Dong et al. (2018) Dong R, Najita JR, Brittain S. 2018b. Ap. J. 862:103
- Draine (2006) Draine BT. 2006. Ap. J. 636:1114-1120
- Dra̧żkowska & Alibert (2017) Dra̧żkowska J, Alibert Y. 2017. Astron. Astrophys. 608:A92
- Dra̧żkowska et al. (2016) Dra̧żkowska J, Alibert Y, Moore B. 2016. Astron. Astrophys. 594:A105
- Dubrulle et al. (1995) Dubrulle B, Morfill G, Sterzik M. 1995. Icarus 114:237-246
- Duchêne et al. (2010) Duchêne G, McCabe C, Pinte C, et al. 2010. Ap. J. 712:112-129
- Dullemond & Dominik (2004a) Dullemond CP, Dominik C. 2004a. Astron. Astrophys. 417:159-168
- Dullemond & Dominik (2004b) —. 2004b. Astron. Astrophys. 421:1075-1086
- Dullemond & Dominik (2005) —. 2005. Astron. Astrophys. 434:971-986
- Dullemond et al. (2001) Dullemond CP, Dominik C, Natta A. 2001. Ap. J. 560:957-969
- Dullemond & Penzlin (2018) Dullemond CP, Penzlin ABT. 2018. Astron. Astrophys. 609:A50
- Dullemond et al. (2002) Dullemond CP, van Zadelhoff GJ, Natta A. 2002, Astron. Astrophys. 389:464-474
- Dullemond et al. (2018) Dullemond CP, Birnstiel T, Huang J, et al. 2018. Ap. J. Lett. 869:L46
- Dullemond et al. (2020) Dullemond CP, Isella A, Andrews SM, Skobleva I, Dzyurkevich N. 2020. Astron. Astrophys. in press, arXiv:1911.12434
- Dutrey et al. (2003) Dutrey A, Guilloteau S, Simon M. 2003. Astron. Astrophys. 402:1003-1011
- Dzyurkevich et al. (2013) Dzyurkevich N, Turner NJ, Henning T, Kley W. 2013. Ap. J. 765:114
- Eisner et al. (2018) Eisner JA, Arce HG, Ballering NP, et al. 2018. Ap. J. 860:77
- Ercolano & Pascucci (2017) Ercolano B, Pascucci I. 2017. Royal Soc. Open Sci. 4:170114
- Espaillat et al. (2007) Espaillat C, Calvet N, D’Alessio P, et al. 2007. Ap. J. Lett. 670:L135-L138
- Espaillat et al. (2011) Espaillat C, Furlan E, D’Alessio P, et al. 2011. Ap. J. 728:49
- Espaillat et al. (2014) Espaillat C, Muzerolle J, Najita J, et al. 2014. In Protostars and Planets VI, ed. H Beuther, RS Klessen, CP Dullemond, T Henning, pp. 497-520. Tucson: Univ. Ariz. Press
- Estrada et al. (2016) Estrada PR, Cuzzi JN, Morgan DA. 2016. Ap. J. 818:200
- Facchini et al. (2017) Facchini S, Birnstiel T, Bruderer S, van Dishoeck EF. 2017. Astron. Astrophys. 605:A16
- Facchini et al. (2016) Facchini S, Clarke CJ, Bisbas TG. 2016. MNRAS 457:3593-3610
- Facchini et al. (2018) Facchini S, Juhász A, Lodato G. 2018. MNRAS 473:4459-4475
- Facchini et al. (2019) Facchini S, van Dishoeck EF, Manara CF, et al. 2019. Astron. Astrophys. 626:L2
- Favre et al. (2013) Favre C, Cleeves LI, Bergin EA, Qi C, Blake GA. 2013. Ap. J. Lett. 776:L38
- Finkbeiner et al. (1999) Finkbeiner DP, Davis M, Schlegel DJ. 1999. Ap. J. 524:867-886
- Flaherty et al. (2012) Flaherty KM, Muzerolle J, Rieke G, et al. 2012. Ap. J. 748:71
- Flaherty et al. (2015) Flaherty KM, Hughes AM, Rosenfeld KA, et al. 2015. Ap. J. 813:99
- Flaherty et al. (2017) Flaherty KM, Hughes AM, Rose SC, et al. 2017. Ap. J. 843:150
- Flaherty et al. (2018) Flaherty KM, Hughes AM, Teague R, et al. 2018. Ap. J. 856:117
- Flaherty et al. (2019) Flaherty K, Hughes AM, Simon JB, et al. 2019. Ap. J. submitted
- Flock et al. (2011) Flock M, Dzyurkevich N, Klahr H, Turner NJ, Henning T. 2011. Ap. J. 735:122
- Flock et al. (2015) Flock M, Ruge JP, Dzyurkevich N, et al. 2015. Astron. Astrophys. 574:A68
- Follette et al. (2015) Follette KB, Grady CA, Swearingen JR, et al. 2015. Ap. J. 798:132
- Fukagawa et al. (2010) Fukagawa M, Tamura M, Itoh Y, et al. 2010. Pub. Ast. Soc. Japan 62:347
- Furlan et al. (2011) Furlan E, Luhman KL, Espaillat C, et al. 2011. Ap. J. Supp. 195:3
- Gammie (1996) Gammie CF. 1996. Ap. J. 457:355-362
- Gárate et al. (2019) Gárate M, Birnstiel T, Dra̧żkowska J, Stammler SM. 2019. arXiv e-prints arXiv:1906.07708
- Garufi et al. (2014) Garufi A, Quanz SP, Schmid HM, et al. 2014. Astron. Astrophys. 568:A40
- Garufi et al. (2016) —. 2016. Astron. Astrophys. 588:A8
- Garufi et al. (2018) Garufi A, Benisty M, Pinilla P, et al. 2018. Astron. Astrophys. 620:A94
- Ginski et al. (2016) Ginski C, Stolker T, Pinilla P, et al. 2016. Astron. Astrophys. 595:A112
- Goldreich & Ward (1973) Goldreich P, Ward WR. 1973. Ap. J. 183:1051-1062
- Goldreich & Kylafis (1981) Goldreich P, Kylafis ND. 1981. Ap. J. Lett. 243:L75-L78
- Goldreich & Tremaine (1980) Goldreich P, Tremaine S. 1980. Ap. J. 241:425-441
- Gonzalez et al. (2017) Gonzalez JF, Laibe G, Maddison ST. 2017. MNRAS 467:1984-1996
- Grady et al. (2013) Grady CA, Muto T, Hashimoto J, et al. 2013. Ap. J. 762:48
- Greaves & Rice (2010) Greaves JS, Rice WKM. 2010. MNRAS 407:1981-1988
- Guilloteau et al. (2011) Guilloteau S, Dutrey A, Piétu V, Boehler Y. 2011. Astron. Astrophys. 529:A105
- Guilloteau et al. (2012) Guilloteau S, Dutrey A, Wakelam V, et al. 2012. Astron. Astrophys. 548:A70
- Guilloteau et al. (2016) Guilloteau S, Piétu V, Chapillon E, et al. 2016. Astron. Astrophys. 586:L1
- Güttler et al. (2010) Güttler C, Blum J, Zsom A, Ormel CW, Dullemond, CP. 2010. Astron. Astrophys. 513:A56
- Guzmán et al. (2018) Guzmán VV, Huang J, Andrews SM, et al. 2018. Ap. J. Lett. 869:L48
- Haffert et al. (2019) Haffert SY, Bohn AJ, de Boer J, et al. 2019. Nature Astronomy 3:749-754
- Haisch et al. (2001) Haisch KE, Lada EA, Lada CJ. 2001. Ap. J. Lett. 553:L153-L156
- Hall et al. (2019) Hall C, Dong R, Rice K, et al. 2019. Ap. J. 871:228
- Harris et al. (2012) Harris RJ, Andrews SM, Wilner DJ, Kraus AL. 2012. Ap. J. 751:115
- Hartmann et al. (1998) Hartmann L, Calvet N, Gullbring E, D’Alessio P. 1998. Ap. J. 495:385-400
- Hashimoto et al. (2011) Hashimoto J, Tamura M, Muto T, et al. 2011. Ap. J. Lett. 729:L17
- Heese et al. (2017) Heese S, Wolf S, Dutrey A, Guilloteau S. 2017. Astron. Astrophys. 604:A5
- Heinemann & Papaloizou (2009) Heinemann T, Papaloizou JCB. 2009. MNRAS 397:64-74
- Hendler et al. (2020) Hendler N, Pascucci I, Pinilla P, et al. 2020. Ap. J., in press, arXiv:2001.02666
- Henning & Stognienko (1996) Henning T, Stognienko R. 1996. Astron. Astrophys. 311:291-303
- Hernández et al. (2007) Hernández J, Hartmann L, Megeath T, et al. 2007. Ap. J. 662:1067-1081
- Hollenbach et al. (1994) Hollenbach D, Johnstone D, Lizano S, Shu F. 1994. Ap. J. 428:654-669
- Huang et al. (2018a) Huang J, Andrews SM, Cleeves LI, et al. 2018a. Ap. J. 852:122
- Huang et al. (2018b) Huang J, Andrews SM, Dullemond CP, et al. 2018b. Ap. J. Lett. 869:L42
- Huang et al. (2018c) Huang J, Andrews SM, Pérez LM, et al. 2018c. Ap. J. Lett. 869:L43
- Hughes et al. (2008) Hughes AM, Wilner DJ, Qi C, Hogerheijde MR. 2008. Ap. J. 678:1119-1126
- Hughes et al. (2009a) Hughes AM, Wilner DJ, Cho J, et al. 2009a. Ap. J. 704:1204-1217
- Hughes et al. (2009b) Hughes AM, Andrews SM, Espaillat C, et al. 2009b. Ap. J. 698:131-142
- Hughes et al. (2011) Hughes AM, Wilner DJ, Andrews SM, Qi C, Hogerheijde MR. 2011. Ap. J. 727:85
- Hull et al. (2018) Hull CLH, Yang H, Li Z-Y, et al. 2018. Ap. J. 860:82
- Hunter (2007) Hunter JD. 2007. Comp. in Sci. and Eng. 9:90
- Isella et al. (2007) Isella A, Testi L, Natta A, et al. 2007. Astron. Astrophys. 469:213-222
- Isella et al. (2009) Isella A, Carpenter JM, Sargent AI. 2009. Ap. J. 701:260-282
- Isella et al. (2010) —. 2010. Ap. J. 714:1746-1761
- Isella et al. (2013) Isella A, Pérez LM, Carpenter JM, et al. 2013. Ap. J. 775:30
- Isella et al. (2016) Isella A, Guidi G, Testi L, et al. 2016. Phys. Rev. Lett. 117:251101
- Isella et al. (2018) Isella A, Huang J, Andrews SM, et al. 2018. Ap. J. Lett. 869:L49
- Jensen & Akeson (2014) Jensen ELN, Akeson R. 2014. Nature 511:567-569
- Jensen et al. (1994) Jensen ELN, Mathieu RD, Fuller GA. 1994. Ap. J. Lett. 429:L29-L32
- Johansen et al. (2007) Johansen A, Oishi JS, Mac Low M-M, et al. 2007. Nature 448:1022-1025
- Johansen et al. (2009) Johansen A, Youdin A, Klahr H. 2009. Ap. J. 697:1269-1289
- Johnstone et al. (1998) Johnstone D, Hollenbach D, Bally J. 1998. Ap. J. 499:758-776
- Jørgensen et al. (2009) Jørgensen JK, van Dishoeck EF, Visser R, et al. 2009. Astron. Astrophys. 507:861-879
- Juhász & Rosotti (2018) Juhász A, Rosotti GP. 2018. MNRAS 474:L32-L36
- Kama et al. (2016a) Kama M, Pinilla P, Heays AN. 2016a. Astron. Astrophys. 593:L20
- Kama et al. (2016b) Kama M, Bruderer S, Carney M, et al. 2016b. Astron. Astrophys. 588:A108
- Kamp & Dullemond (2004) Kamp I, Dullemond CP. 2004. Ap. J. 615:991-999
- Kanagawa et al. (2015) Kanagawa KD, Tanaka H, Muto T, Tanigawa T, Takeuchi T. 2015. MNRAS 448:994-1006
- Kataoka et al. (2014) Kataoka A, Okuzumi S, Tanaka H, Nomura H. 2014. Astron. Astrophys. 568:A42
- Kataoka et al. (2015) Kataoka A, Muto T, Momose M, et al. 2015. Ap. J. 809:78
- Kataoka et al. (2016a) Kataoka A, Muto T, Momose M, Tsukagoshi T, Dullemond, CP. 2016a. Ap. J. 820:54
- Kataoka et al. (2016b) Kataoka A, Tsukagoshi T, Momose M, et al. 2016b. Ap. J. Lett. 831:L12
- Kataoka et al. (2019) Kataoka A, Okuzumi S, Tazaki R. 2019. Ap. J. Lett. 874:L6
- Kenyon & Hartmann (1987) Kenyon SJ, Hartmann L. 1987. Ap. J. 323:714-733
- Keppler et al. (2018) Keppler M, Benisty M, Müller A, et al. 2018. Astron. Astrophys. 617:A44
- Klahr & Bodenheimer (2003) Klahr HH, Bodenheimer P. 2003, Ap. J. 582:869-892
- Klahr & Bodenheimer (2006) —. 2006. Ap. J. 639:432-440
- Klahr & Henning (1997) Klahr HH, Henning T. 1997. Icarus 128:213-229
- Kley & Dirksen (2006) Kley W, Dirksen G. 2006. Astron. Astrophys. 447:369-377
- Kley & Nelson (2012) Kley W, Nelson RP. 2012. Annu. Rev. Astron. Astrophys. 50:211-249
- Kratter & Lodato (2016) Kratter K, Lodato G. 2016. Annu. Rev. Astron. Astrophys. 54:271-311
- Kraus et al. (2011) Kraus AL, Ireland MJ, Martinache F, Hillenbrand LA. 2011. Ap. J. 731:8
- Kraus et al. (2017) Kraus S, Kreplin A, Fukugawa M, et al. 2017. Ap. J. Lett. 848:L11
- Krijt et al. (2015) Krijt S, Ormel CW, Dominik C, Tielens AGGM. 2015. Astron. Astrophys. 574:A83
- Kudo et al. (2018) Kudo T, Hashimoto J, Muto T, et al. 2018. Ap. J. Lett. 868:L5
- Kurtovic et al. (2018) Kurtovic NT, Pérez LM, Benisty M, et al. 2018. Ap. J. Lett. 869:L44
- Laibe et al. (2012) Laibe G, Gonzalez JF, Maddison ST. 2012. Astron. Astrophys. 537:A61
- Lambrechts & Johansen (2012) Lambrechts M, Johansen A. 2012. Astron. Astrophys. 544:A32
- Laughlin & Bodenheimer (1994) Laughlin G, Bodenheimer P. 1994. Ap. J. 436:335-354
- Lesur et al. (2015) Lesur G, Hennebelle P, Fromang S. 2015. Astron. Astrophys. 582:L9
- Li et al. (2014) Li Z-Y, Banerjee R, Pudritz RE, et al. 2014. In Protostars and Planets VI, ed. H Beuther, RS Klessen, CP Dullemond, T Henning, pp. 173-194. Tucson: Univ. Ariz. Press
- Lin & Papaloizou (1979) Lin DNC, Papaloizou J. 1979. MNRAS 186:799-812
- Lin & Papaloizou (1986) —. 1986. Ap. J. 309:846-857
- Liu (2019) Liu HB. 2019. Ap. J. Lett. 877:L22
- Lodato et al. (2019) Lodato G, Dipierro G, Ragusa E, et al. 2019. MNRAS 486:453-461
- Lommen et al. (2010) Lommen DJP, van Dishoeck EF, Wright CM, et al. 2010. Astron. Astrophys. 515:A77
- Long et al. (2017a) Long F, Herczeg GJ, Pascucci I, et al. 2017. Ap. J. 844:99
- Long et al. (2018a) —. 2018a, Ap. J. 863:61
- Long et al. (2018b) Long F, Pinilla P, Herczeg GJ, et al. 2018b. Ap. J. 869:17
- Long et al. (2019) Long F, Herczeg GJ, Harsono D, et al. 2019. Ap. J. 882:49
- Loomis et al. (2017) Loomis RA, Öberg KI, Andrews SM, MacGregor MA. 2017. Ap. J. 840:23
- Lorén-Aguilar & Bate (2015) Lorén-Aguilar P, Bate MR. 2015. MNRAS 453:L78-L82
- Lorén-Aguilar & Bate (2016) —. 2016. MNRAS 457:L54-L58
- Louvet et al. (2018) Louvet F, Dougados C, Cabrit S, et al. 2018. Astron. Astrophys. 618:A120
- Lovelace et al. (1999) Lovelace RVE, Li H, Colgate SA, et al. 1999. Ap. J. 513:805-810
- Lynden-Bell & Pringle (1974) Lynden-Bell D, Pringle JE. 1974. MNRAS 168:603-637
- Lyra et al. (2009) Lyra W, Johansen A, Zsom A, Klahr H, Piskunov N. 2009. Astron. Astrophys. 497:869-888
- Lyra & Lin (2013) Lyra W, Lin MK. 2013. Ap. J. 775:17
- Manara et al. (2016) Manara CF, Rosotti G, Testi L, et al. 2016. Astron. Astrophys. 591:L3
- Manara et al. (2018) Manara CF, Morbidelli A, Guillot T. 2018. Astron. Astrophys. 618:L3
- Manara et al. (2019) Manara CF, Tazzari M, Long F, et al. 2019. Astron. Astrophys. 628:A95
- Mann & Williams (2009) Mann RK, Williams JP. 2009. Ap. J. Lett. 694:L36-L40
- Mann & Williams (2010) —. 2010. Ap. J. 725:430-442
- Mann et al. (2014) Mann RK, Di Francesco J, Johnstone D, et al. 2014. Ap. J. 784:82
- Marino et al. (2015) Marino S, Pérez S, Casassus S. 2015. Ap. J. Lett. 798:L44
- Maury et al. (2019) Maury AJ, André P, Testi L, et al. 2019. Astron. Astrophys. 621:A76
- Mayama et al. (2012) Mayama S, Hashimoto J, Muto T, et al. 2012. Ap. J. Lett. 760:L26
- McCabe et al. (2011) McCabe C, Duchêne G, Pinte C, et al. 2011. Ap. J. 727:90
- McClure et al. (2016) McClure MK, Bergin EA, Cleeves LI, et al. 2016. Ap. J. 831:167
- Menu et al. (2014) Menu J, van Boekel R, Henning T, et al. 2014. Astron. Astrophys. 564:A93
- Miguel et al. (2011) Miguel Y, Guilera OM, Brunini A. 2011. MNRAS 412:2113-2124
- Min et al. (2016) Min M, Rab C, Woitke P, Dominik C, Ménard F. 2016. Astron. Astrophys. 585:A13
- Miotello et al. (2014) Miotello A, Bruderer S, van Dishoeck EF. 2014. Astron. Astrophys. 572:A96
- Miotello et al. (2016) Miotello A, van Dishoeck EF, Kama M, Bruderer S. 2016. Astron. Astrophys. 594:A85
- Miotello et al. (2017) Miotello A, van Dishoeck EF, Williams JP, et al. 2017. Astron. Astrophys. 599:A113
- Miotello et al. (2018) Miotello A, Facchini S, van Dishoeck EF, Bruderer S. 2018. Astron. Astrophys. 619:A113
- Miyake & Nakagawa (1993) Miyake K, Nakagawa Y. 1993. Icarus 106:20-41
- Monnier et al. (2017) Monnier JD, Harries TJ, Aarnio A, et al. 2017. Ap. J. 838:20
- Monnier et al. (2019) Monnier JD, Harries TJ, Bae J, et al. 2019. Ap. J. 872:122
- Montesinos et al. (2016) Montesinos M, Pérez S, Casassus S, et al. 2016. Ap. J. Lett. 823:L8
- Mulders & Dominik (2012) Mulders GD, Dominik C. 2012. Astron. Astrophys. 539:A9
- Mulders (2018) Mulders GD. 2018. In Handbook of Exoplanets, ed. H Deeg, J Belmonte, 153. Springer, Cham
- Müller et al. (2018) Müller A, Keppler M, Henning T, et al. 2018. Astron. Astrophys. 617:L2
- Muro-Arena et al. (2018) Muro-Arena GA, Dominik C, Waters LBFM, et al. 2018. Astron. Astrophys. 614:A24
- Muto et al. (2012) Muto T, Grady CA, Hashimoto J, et al. 2012. Ap. J. Lett. 748:L22
- Muzerolle et al. (2009) Muzerolle J, Flaherty K, Balog Z, et al. 2009. Ap. J. Lett. 704:L15-L19
- Najita & Kenyon (2014) Najita JR, Kenyon SJ. 2014. MNRAS 445:3315-3329
- Nakagawa et al. (1986) Nakagawa Y, Sekiya M, Hayashi C. 1986. Icarus 67:375-390
- Natta (1993) Natta A. 1993. Ap. J. 412:761-770
- Nealon et al. (2018) Nealon R, Dipierro G, Alexander R, Martin RG, Nixon C. 2018. MNRAS 481:20-35
- Nealon et al. (2019) Nealon R, Pinte C, Alexander R, Mentiplay D, Dipierro G. 2019. MNRAS 484:4951-4962
- Nixon et al. (2018) Nixon CJ, King AR, Pringle JE. 2018. MNRAS 477:3273-3278
- Öberg et al. (2011) Öberg KI, Qi C, Fogel JKJ, et al. 2011. Ap. J. 734:98
- Ohashi et al. (2018) Ohashi S, Kataoka A, Nagai H, et al. 2018. Ap. J. 864:81
- Okuzumi et al. (2012) Okuzumi S, Tanaka H, Kobayashi H, Wada K. 2012. Ap. J. 752:106
- Okuzumi et al. (2016) Okuzumi S, Momose M, Sirono S-i, Kobayashi H, Tanaka H. 2016. Ap. J. 821:82
- Ormel & Klahr (2010) Ormel CW, Klahr HH. 2010. Astron. Astrophys. 520:A43
- Owen & Lai (2017) Owen JE, Lai D. 2017. MNRAS 469:2834-2844
- Paardekooper & Mellema (2006) Paardekooper S-J, Mellema G. 2006. Astron. Astrophys. 453:1129-1140
- Pan et al. (2011) Pan L, Padoan P, Scalo J, et al. 2011. Ap. J. 740:6
- Panić et al. (2009) Panić O, Hogerheijde MR, Wilner D, Qi C. 2009. Astron. Astrophys. 501:269-278
- Pascucci et al. (2016) Pascucci I, Testi L, Herczeg GJ, et al. 2016. Ap. J. 831:125
- Pérez et al. (2012) Pérez LM, Carpenter JM, Chandler CJ, et al. 2012. Ap. J. Lett. 760:L17
- Pérez et al. (2014) Pérez LM, Isella A, Carpenter JM, Chandler CJ. 2014. Ap. J. Lett. 783:L13
- Pérez et al. (2015a) Pérez LM, Chandler CJ, Isella A, et al. 2015a. Ap. J. Lett. 813:41
- Pérez et al. (2015b) Pérez S, Dunhill A, Casassus S, et al. 2015b. Ap. J. Lett. 811:L5
- Pérez et al. (2016) Pérez LM, Carpenter JM, Andrews SM, et al. 2016. Science 353:1519-1521
- Pérez et al. (2018a) Pérez S, Casassus S, Benítez-Llambay P. 2018a. MNRAS 480:L12-L17
- Pérez et al. (2018b) Pérez LM, Benisty M, Andrews SM, et al. 2018b. Ap. J. Lett. 869:L50
- Pérez et al. (2019a) Pérez S, Casassus S, Baruteau C, et al. 2019a. Astron. J. 158:15
- Pfalzner (2013) Pfalzner S. 2013. Astron. Astrophys. 549:A82
- Piétu et al. (2007) Piétu V, Dutrey A, Guilloteau S. 2007. Astron. Astrophys. 467:163-178
- Piétu et al. (2014) Piétu V, Guilloteau S, Di Folco E, Dutrey A, Boehler Y. 2014. Astron. Astrophys. 564:A95
- Pinilla et al. (2012a) Pinilla P, Birnstiel T, Ricci L, et al. 2012a. Astron. Astrophys. 538:A114
- Pinilla et al. (2012b) Pinilla P, Benisty M, Birnstiel T. 2012b. Astron. Astrophys. 545:A81
- Pinilla et al. (2013) Pinilla P, Birnstiel T, Benisty M, et al. 2013. Astron. Astrophys. 554:A95
- Pinilla et al. (2017a) Pinilla P, Pérez LM, Andrews S, et al. 2017a. Ap. J. 839:99
- Pinilla et al. (2017b) Pinilla P, Pohl A, Stammler SM, Birnstiel T. 2017b. Ap. J. 845:68
- Pinilla et al. (2017c) Pinilla P, Quiroga-Nuñez LH, Benisty M, et al. 2017c. Ap. J. 846:70
- Pinilla et al. (2018a) Pinilla P, Natta A, Manara CF, et al. 2018a. Astron. Astrophys. 615:A95
- Pinilla et al. (2018b) Pinilla P, Tazzari M, Pascucci I, et al. 2018b. Ap. J. 859:32
- Pinilla et al. (2018c) Pinilla P, Benisty M, de Boer J, et al. 2018c. Ap. J. 868:85
- Pinte et al. (2016) Pinte C, Dent WRF, Ménard F, et al. 2016. Ap. J. 816:25
- Pinte et al. (2007) Pinte C, Fouchet L, Ménard F, Gonzalez J-F, Duchêne G. 2007. Astron. Astrophys. 469:963-971
- Pinte et al. (2008) Pinte C, Padgett DL, Ménard F, et al. 2008. Astron. Astrophys. 489:633-650
- Pinte et al. (2018a) Pinte C, Ménard F, Duchêne G, et al. 2018a. Astron. Astrophys. 609:A47
- Pinte et al. (2018b) Pinte C, Price DJ, Ménard F, et al. 2018b. Ap. J. Lett. 860:L13
- Pinte et al. (2019) Pinte C, van der Plas G, Ménard F, et al. 2019. Nature Ast. 459
- Pollack et al. (1994) Pollack JB, Hollenbach D, Beckwith S, et al. 1994. Ap. J. 421:615-639
- Powell et al. (2017) Powell D, Murray-Clay R, Schlichting HE. 2017. Ap. J. 840:93
- Qi et al. (2011) Qi C, D’Alessio P, Öberg KI, et al. 2011. Ap. J. 740:84
- Qi et al. (2019) Qi C, Öberg KI, Espaillat CC, et al. 2019. Ap. J. 882:160
- Quanz et al. (2013) Quanz SP, Avenhaus H, Buenzli E, et al. 2013. Ap. J. Lett. 766:L2
- Quanz et al. (2011) Quanz SP, Schmid HM, Geissler K, et al. 2011. Ap. J. 738:23
- Rafikov (2016) Rafikov RR. 2016. Ap. J. 831:122
- Raghavan et al. (2010) Raghavan D, McAlister HA, Henry TJ, et al. 2010. Ap. J. Suppl. 190:1-42
- Rapson et al. (2015) Rapson VA, Kastner JH, Andrews SM, et al. 2015. Ap. J. Lett. 803:L10
- Reboussin et al. (2015) Reboussin L, Wakelam V, Guilloteau S, Hersant F, Dutrey A. 2015. Astron. Astrophys. 579:A82
- Rebull et al. (2014) Rebull LM, Cody AM, Covey KR, et al. 2014. Astron. J. 148:92
- Regály et al. (2012) Regály Z, Juhász A, Sándor Z, et al. 2012. MNRAS 419:1701-1712
- Ricci et al. (2010a) Ricci L, Testi L, Natta A, Brooks KJ. 2010a. Astron. Astrophys. 521:A66
- Ricci et al. (2010b) Ricci L, Testi L, Natta A, et al. 2010b. Astron. Astrophys. 512:A15
- Ricci et al. (2012) Ricci L, Trotta F, Testi L, et al. 2012. Astron. Astrophys. 540:A6
- Ricci et al. (2013) Ricci L, Isella A, Carpenter JM, Testi L. 2013. Ap. J. Lett. 764:L27
- Ricci et al. (2014) Ricci L, Testi L, Natta A, et al. 2014. Ap. J. 791:20
- Rice et al. (2004) Rice WKM, Lodato G, Pringle JE, Armitage PJ, Bonnell IA. 2004. MNRAS 355:543
- Rice et al. (2006) Rice WKM, Armitage PJ, Wood K, Lodato G. 2006. MNRAS 373:1619-1626
- Richard et al. (2016) Richard S, Nelson RP, Umurhan OM. 2016. MNRAS 456:3571-3584
- Rodriguez et al. (2018) Rodriguez JE, Loomis R, Cabrit S, et al. 2018. Ap. J. 859:150
- Ros & Johansen (2013) Ros K, Johansen A. 2013. Astron. Astrophys. 552:A137
- Ros et al. (2019) Ros K, Johansen A, Riipinen I, Schlesinger D. 2019. Astron. Astrophys. 629:A65
- Rosenfeld et al. (2012a) Rosenfeld KA, Andrews SM, Wilner DJ, Stempels HC. 2012a. Ap. J. 759:119
- Rosenfeld et al. (2012b) Rosenfeld KA, Qi C, Andrews SM, et al. 2012b. Ap. J. 757:129
- Rosenfeld et al. (2013a) Rosenfeld KA, Andrews SM, Hughes AM, Wilner DJ, Qi C. 2013a. Ap. J. 774:16
- Rosenfeld et al. (2014) Rosenfeld KA, Chiang E, Andrews SM. 2014. Ap. J. 782:62
- Rosotti et al. (2014) Rosotti GP, Dale JE, de Juan Ovelar M, et al. 2014. MNRAS 441:2094-2110
- Rosotti et al. (2016) Rosotti GP, Juhasz A, Booth RA, Clarke CJ. 2016. MNRAS 459:2790-2805
- Rosotti et al. (2019a) Rosotti GP, Booth RA, Tazzari M, et al. 2019a. MNRAS 486:L63-L68
- Rosotti et al. (2019b) Rosotti GP, Tazzari M, Booth RA, et al. 2019b. MNRAS 486:4829-4844
- Ruge et al. (2016) Ruge JP, Flock M, Wolf S, et al. 2016. Astron. Astrophys. 590:A17
- Ruíz-Rodríguez et al. (2018) Ruíz-Rodríguez D, Cieza LA, Williams JP, et al. 2018. MNRAS 478:3674-3692
- Saito & Sirono (2011) Saito E, Sirono S-i. 2011. Ap. J. 728:20
- Schneider et al. (2003) Schneider G, Wood K, Silverstone MD, et al. 2003. Astron. J. 125:1467-1479
- Schoonenberg & Ormel (2017) Schoonenberg D, Ormel CW. 2017. Astron. Astrophys. 602:A21
- Schwarz et al. (2016) Schwarz KR, Bergin EA, Cleeves LI, et al. 2016. Ap. J. 823:91
- Segura-Cox et al. (2018) Segura-Cox DM, Looney LW, Tobin JJ, et al. 2018. Ap. J. 866:161
- Shariff & Cuzzi (2011) Shariff K, Cuzzi JN. 2011. Ap. J. 738:73
- Sheehan & Eisner (2017) Sheehan PD, Eisner JA. 2017. Ap. J. 851:45
- Shi & Chiang (2014) Shi JM, Chiang E. 2014. Ap. J. 789:34
- Simon & Armitage (2014) Simon JB, Armitage PJ. 2014. Ap. J. 784:15
- Simon et al. (2017) Simon M, Guilloteau S, Di Folco E, et al. 2017. Ap. J. 844:158
- Sirono (2011) Sirono S-i. 2011. Ap. J. 735:131
- Stammler et al. (2017) Stammler SM, Birnstiel T, Panić O, Dullemond CP, Dominik C. 2017. Astron. Astrophys. 600:A140
- Stammler et al. (2019) Stammler SM, Dra̧żkowska J, Birnstiel T, et al. 2019 Ap. J. Lett. 884:L5
- Stephens et al. (2017) Stephens IW, Yang H, Li Z-Y, et al. 2017. Ap. J. 851:55
- Stevenson & Lunine (1988) Stevenson DJ, Lunine JI. 1988. Icarus. 75:146-155
- Stolker et al. (2016) Stolker T, Dominik C, Min M, et al. 2016. Astron. Astrophys. 596:A70
- Stolker et al. (2017) Stolker T, Sitko M, Lazareff B, et al. 2017. Ap. J. 849:143
- Störzer & Hollenbach (1999) Störzer H, Hollenbach D. 1999. Ap. J. 515:669-684
- Suriano et al. (2017) Suriano SS, Li Z-Y, Krasnopolsky R, Shang H. 2017. MNRAS 468:3850-3868
- Suriano et al. (2018) —. 2018. MNRAS 477:1239-1257
- Surville et al. (2016) Surville C, Mayer L, Lin DNC. 2016. Ap. J. 831:82
- Suzuki et al. (2016) Suzuki TK, Ogihara M, Morbidelli AR, Crida A, Guillot T. 2016. Astron. Astrophys. 596:A74
- Takahashi & Inutsuka (2014) Takahashi SZ, Inutsuka S-i. 2014. Ap. J. 794:55
- Takahashi & Inutsuka (2016) —. 2016. Astron. J. 152:184
- Takahashi & Muto (2018) Takahashi SZ, Muto T. 2018 Ap. J. 865:102
- Takeuchi & Lin (2002) Takeuchi T, Lin DNC. 2002. Ap. J. 581:1344-1355
- Takeuchi & Lin (2005) —. 2005. Ap. J. 623:482-492
- Tang et al. (2012) Tang Y-W, Guilloteau S, Piétu V, et al. 2012. Astron. Astrophys. 547:A84
- Tang et al. (2017) Tang Y-W, Guilloteau S, Dutrey A, et al. 2017. Ap. J. 840:32
- Tazaki et al. (2017) Tazaki R, Lazarian A, Nomura H. 2017. Ap. J. 839:56
- Tazzari et al. (2016) Tazzari M, Testi L, Ercolano B, et al. 2016. Astron. Astrophys. 588:A53
- Tazzari et al. (2017) Tazzari M, Testi L, Natta A, et al. 2017. Astron. Astrophys. 606:A88
- Teague et al. (2018a) Teague R, Bae J, Bergin EA, Birnstiel T, Foreman-Mackey D. 2018a. Ap. J. Lett. 860:L12
- Teague et al. (2018c) Teague R, Bae J, Birnstiel T, Bergin EA. 2018b. Ap. J. 868:113
- Teague et al. (2019) Teague, R, Bae, J, Huang, J, Bergin EA. 2019. Ap. J. Lett. in press
- Teague et al. (2018b) Teague R, Henning T, Guilloteau S, et al. 2018. Ap. J. 864:133
- Teague et al. (2016) Teague R, Guilloteau S, Semenov D, et al. 2016. Astron. Astrophys. 592:A49
- Teiser & Wurm (2009) Teiser J, Wurm G. 2009. MNRAS 393:1584-1594
- Terebey et al. (1984) Terebey S, Shu FH, Cassen P. 1984. Ap. J. 286:529-551
- Testi et al. (2014) Testi L, Birnstiel T, Ricci L, et al. 2014. In Protostars and Planets VI, ed. H Beuther, RS Klessen, CP Dullemond, T Henning, pp. 339-361. Tucson: Univ. Ariz. Press
- Testi et al. (2016) Testi L, Natta A, Scholz A, et al. 2016. Astron. Astrophys. 593:A111
- Thamm et al. (1994) Thamm E, Steinacker J, Henning T. 1994. Astron. Astrophys. 287:493-502
- Tobin et al. (2015) Tobin JJ, Looney LW, Wilner DJ, et al. 2015. Ap. J. 805:125
- Tobin et al. (2016) Tobin JJ, Kratter KM, Persson MV, et al. 2016. Nature 538:483-486
- Tomida et al. (2017) Tomida K, Machida MN, Hosokawa T, Sakurai Y, Lin CH. 2017. Ap. J. Lett. 835:L11
- Toomre (1964) Toomre A. 1964. Ap. J. 139:1217-1238
- Trapman et al. (2019) Trapman L, Facchini S, Hogerheijde MR, van Dishoeck EF, Bruderer S. 2019. Astron. Astrophys. 629:A79
- Trapman et al. (2017) Trapman L, Miotello A, Kama M, van Dishoeck EF, Bruderer S. 2017. Astron. Astrophys. 605:A69
- Tripathi et al. (2017) Tripathi A, Andrews SM, Birnstiel T, Wilner DJ. 2017. Ap. J. 845:44
- Tripathi et al. (2018) Tripathi A, Andrews SM, Birnstiel T, et al. 2018. Ap. J. 861:64
- Tsukagoshi et al. (2016) Tsukagoshi T, Nomura H, Muto T, et al. 2016. Ap. J. Lett. 829:L35
- Tsukagoshi et al. (2019a) Tsukagoshi T, Momose M, Kitamura Y, et al. 2019a. Ap. J. 871:5
- Tsukagoshi et al. (2019b) Tsukagoshi T, Muto T, Nomura H, et al. 2019b. Ap. J. Lett. 878:L8
- Turner et al. (2010) Turner NJ, Carballido A, Sano T. 2010. Ap. J. 708:188-201
- Turner et al. (2014) Turner NJ, Fromang S, Gammie C, et al. 2014. In Protostars and Planets VI, ed. H Beuther, RS Klessen, CP Dullemond, T Henning, pp. 411-432. Tucson: Univ. Ariz. Press
- Tychoniec et al. (2018) Tychoniec L, Tobin JJ, Karska A, et al. 2018. Ap. J. Suppl. 238:19
- Uribe et al. (2011) Uribe AL, Klahr H, Flock M, Henning T. 2011. Ap. J. 736:85
- van Boekel et al. (2004) van Boekel R, Waters LBFM, Dominik C, et al. 2004. Astron. Astrophys. 418:177-184
- van Boekel et al. (2017) van Boekel R, Henning T, Menu J, et al. 2017. Ap. J. 837:132
- van der Marel et al. (2016a) van der Marel N, Cazzoletti P, Pinilla P, Garufi A. 2016a. Ap. J. 832:178
- van der Marel et al. (2019) van der Marel N, Dong R, Di Francesco J, Williams JP, Tobin J. 2019. Ap. J. 872:112
- van der Marel et al. (2015a) van der Marel N, Pinilla P, Tobin J, et al. 2015a. Ap. J. Lett. 810:L7
- van der Marel et al. (2015b) van der Marel N, van Dishoeck E, Bruderer S, Pérez LM, Isella A. 2015b. Astron. Astrophys. 579:A106
- van der Marel et al. (2016b) van der Marel N, van Dishoeck EF, Bruderer S, et al. 2016b. Astron. Astrophys. 585:A58
- van der Marel et al. (2016c) van der Marel N, Verhaar BW, van Terwisga S, et al. 2016c. Astron. Astrophys. 592:A126
- van der Marel et al. (2018a) van der Marel N, Williams JP, Bruderer S. 2018a. Ap. J. Lett. 867:L14
- van der Marel et al. (2013) van der Marel N, van Dishoeck EF, Bruderer S, et al. 2013. Science 340:1199-1202
- van der Marel et al. (2018b) van der Marel N, Williams JP, Ansdell M, et al. 2018b. Ap. J. 854:177
- van der Plas et al. (2017) van der Plas G, Ménard F, Ward-Duong K, et al. 2016. Ap. J. 819:102
- van der Plas et al. (2017) van der Plas G, Ménard F, Canovas H, et al. 2017. Astron. Astrophys. 607:A55
- van der Walt et al. (2011) van der Walt S, Colbert SC, Varoquaux G. 2011. Comp. in Sci. and Eng. 13:22
- van Terwisga et al. (2018) van Terwisga SE, van Dishoeck EF, Ansdell M, et al. 2018. Astron. Astrophys. 616:A88
- van Terwisga et al. (2019) van Terwisga SE, Hacar A, van Dishoeck EF. 2019. Astron. Astrophys. 628:A85
- van Zadelhoff et al. (2001) van Zadelhoff G-J, van Dishoeck EF, Thi W-F, Blake GA. 2001. Astron. Astrophys. 377:566-580
- Villenave et al. (2019) Villenave M, Benisty M, Dent WRF, et al. 2019. Astron. Astrophys. 624:A7
- Ward-Duong et al. (2018) Ward-Duong K, Patience J, Bulger J, et al. 2018. Astron. J. 155:54
- Weaver et al. (2018) Weaver E, Isella A, Boehler J. 2018. Ap. J. 853:113
- Weidenschilling (1977a) Weidenschilling SJ. 1977a. Astrophys. Space Sci. 51:153-158
- Weidenschilling (1977b) —. 1977b. MNRAS 180:57-70
- Weinberger et al. (2002) Weinberger AJ, Becklin EE, Schneider G, et al. 2002. Ap. J. 566:409-418
- Whipple (1972) Whipple FL. 1972. In From Plasma to Planet, ed. A Elvius, pp. 211-232. New York: Wiley
- Williams & Best (2014) Williams JP, Best WMJ. 2014. Ap. J. 788:59
- Williams et al. (2019) Williams JP, Cieza L, Hales A, et al. 2019. Ap. J. Lett. 875:L9
- Williams & Cieza (2011) Williams JP, Cieza LA. 2011. Annu. Rev. Astron. Astrophys. 49:67-117
- Williams & McPartland (2016) Williams JP, McPartland C. 2016. Ap. J. 830:32
- Williams et al. (2014) Williams JP, Mann RK, Di Francesco J, et al. 2014. Ap. J. 796:120
- Windmark et al. (2012a) Windmark F, Birnstiel T, Güttler C, et al. 2012a. Astron. Astrophys. 540:A73
- Windmark et al. (2012b) Windmark F, Birnstiel T, Ormel CW, Dullemond CP. 2012b. Astron. Astrophys. 544:L16
- Winter et al. (2018a) Winter AJ, Booth RA, Clarke CJ. 2018a. MNRAS 479:5522-5531
- Woitke et al. (2016) Woitke P, Min M, Pinte C, et al. 2016. Astron. Astrophys. 586:A103
- Wünsch et al. (2005) Wünsch R, Klahr H, Różyczka M. 2005. MNRAS 362:361-368
- Xiang-Gruess (2016) Xiang-Gruess M. 2016. MNRAS 455:3086-3100
- Yang et al. (2017a) Yang CC, Johansen A, Carrera D. 2017a. Astron. Astrophys. 606:A80
- Yang et al. (2017b) Yang H, Li Z-Y, Looney LW, Girart JM, Stephens IW. 2017b. MNRAS 472:373-388
- Youdin (2011) Youdin AN. 2011. Ap. J. 731:99
- Youdin & Goodman (2005) Youdin AN, Goodman J. 2005. Ap. J. 620:459-469
- Youdin & Shu (2002) Youdin AN, Shu FH. 2002. Ap. J. 580:494-505
- Yu et al. (2016) Yu M, Willacy K, Dodson-Robinson SE, Turner NJ, Evans NJ. 2016. Ap. J. 822:53
- Yu et al. (2017) Yu M, Evans NJ, Dodson-Robinson SE, Willacy K, Turner NJ. 2017. Ap. J. 841:39
- Yu et al. (2019) Yu S-Y, Ho LC, Zhu Z. 2019. Ap. J. 877:100
- Zhang et al. (2016) Zhang K, Bergin EA, Blake GA, et al. 2016. Ap. J. Lett. 818:L16
- Zhang et al. (2017) Zhang K, Bergin EA, Blake GA, Cleeves LI, Schwarz, KR. 2017 Nature Astronomy 1:0130
- Zhang et al. (2019) Zhang K, Bergin EA, Schwarz KR, et al. 2019. Ap. J. 883:98
- Zhang et al. (2015) Zhang K, Blake GA, Bergin EA. 2015. Ap. J. Lett. 806:L7
- Zhang et al. (2018) Zhang S, Zhu Z, Huang J, et al. 2018. Ap. J. Lett. 869:L47
- Zhu et al. (2015) Zhu Z, Dong R, Stone JM, Rafikov RR. 2015. Ap. J. 813:88
- Zhu et al. (2012) Zhu Z, Nelson RP, Dong R, Espaillat C, Hartmann L. 2012. Ap. J. 755:6
- Zhu et al. (2011) Zhu Z, Nelson RP, Hartmann L, Espaillat C, Calvet N. 2011. Ap. J. 729:47
- Zhu et al. (2014) Zhu Z, Stone JM, Rafikov RR, Bai X-N. 2014. Ap. J. 785:122
- Zhu et al. (2019) Zhu Z, Zhang S, Jiang YF, et al. 2019. Ap. J. Lett. 877:L18
- Zhu (2019) Zhu Z. 2019. MNRAS 483:4221-4241
- Zsom et al. (2010) Zsom A, Ormel CW, Güttler C, Blum J, Dullemond CP. 2010. Astron. Astrophys. 513:A57