Change Detection in Dynamic Attributed Networks
Article Type:
Overview
Abstract
A network provides powerful means of representing complex relationships between entities by abstracting entities as vertices, and relationships as edges connecting vertices in a graph. Beyond the presence or absence of relationships, a network may contain additional information that can be attributed to the entities and their relationships. Attaching these additional attribute data to the corresponding vertices and edges yields an attributed graph. Moreover, in the majority of real-world applications, such as online social networks, financial networks and transactional networks, relationships between entities evolve over time. \justifyChange detection in dynamic attributed networks is an important problem in many areas, such as fraud detection, cyber intrusion detection and health care monitoring. It is a challenging problem because it involves a time sequence of attributed graphs, each of which is usually very large and can contain many attributes attached to the vertices and edges, resulting in a complex, high dimensional mathematical object. \justifyIn this survey we provide an overview of some of the existing change detection methods that utilize attribute information. We categorize these methods based on the levels of structure in the graph that are exploited to detect changes. These levels are vertices, edges, subgraphs, communities and the overall graph. We focus our attention on the strengths and weaknesses of these methods, including performance and scalability. Finally we discuss some publicly available dynamic network datasets and give a brief overview of simulation models to generate synthetic dynamic attributed networks.
GRAPHICAL TABLE OF CONTENTS
1 INTRODUCTION
Rapid developments in the field of information technology have resulted in a proliferation of datasets over the past few decades. Examples include supermarket transaction data, credit card records, medical records, and records of telephone call information. The availability of large datasets led to a high demand for new methods to extract useful information. Thus the field of data mining started to develop. Data mining involves methods for exploring, analysing, and modelling large datasets to find valid, novel, and interpretable patterns (Fayyad et al.,, 1996). The area of data mining which attempts to discover unusual occurrences in dynamic (time-varying) datasets is called change detection. Detecting changes provides early warnings of events that can have serious impact. For example, early detection of an abrupt change in the stock market could help improve decision making and avoid possible losses for businesses due to wrong decisions and weak trading systems. The majority of traditional data mining methods assume entities in a dataset to be independent, and ignore the natural relationships among them (Huang and Gao,, 2014). However, entities in most real-world datasets are not independent, but are related to each other in different ways. For accurate change detection, it is vital to consider these underlying relationships. For example, the extent to which a transaction is fraudulent in credit card data can be identified more accurately by considering the usual purchasing behaviour of the card-holder as well as the usual purchasing behaviours of other card holders who bought the same product (Singh and Singh,, 2015). The need for regarding such inherent dependencies among entities has aroused interest for network-based change detection methods.
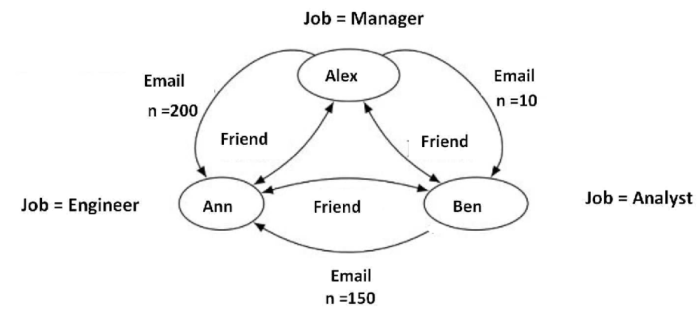
A network is a collection of entities, that have inherent relationships. Some examples include a social network of friendships among people, a communication network of company employees connected by phone calls, emails or text messages, and a biological network of neurons connected by their synapses. A network can be mathematically conceptualized as a graph by associating entities with vertices, and relationships with edges connecting vertices in the graph. For example, in the graph representation of a social network like Facebook, vertices may represent friends and edges represent friendship connections. It is also possible to capture more information by attaching additional attribute data to the vertices and edges, resulting in an attributed graph. An illustrative example of a small attributed graph of three vertices is shown in Figure 2. Each vertex is tagged with attribute information about the job role of the corresponding employee, while the edges are tagged with attribute information based on the type of relationship (whether the relationship is based on friendship or email sending patterns). An edge can be further weighted to quantify the corresponding relationship. In the example given in Figure 2, the edges representing email sending patterns are weighted to represent the number of emails.
Most real-world networks evolve as time progresses. That is, the entities and their relationships keep evolving with time. This type of relational data can be represented as a dynamic network. For example, a communication network of a company is a dynamic network because new employees (entities) join the network and communication patterns (relationships) are modified continuously. A dynamic network can be represented as a time sequence of graphs, each representing the entities (as vertices) and their relationships (as edges) at a given time instant.
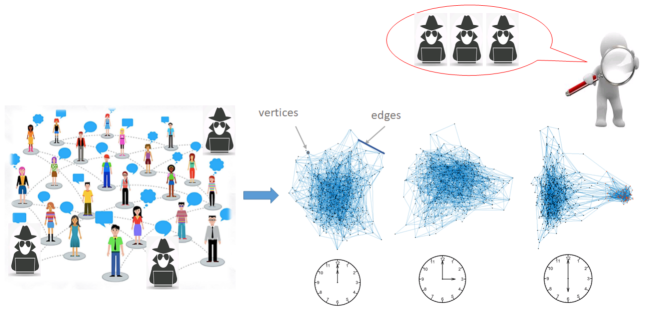
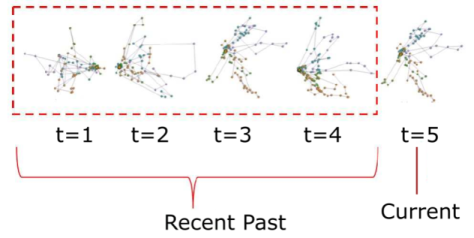
Change detection in dynamic networks is the process of continuously monitoring a network for deviations in the behaviour of entities and their relationship structure. Figure 3 illustrates this based on a toy example. The graph obtained at the current time instant represents the current behaviour of entities and their relationships, while the sequence of graphs inside the window containing the recent past time instants, characterise profile behaviour. A general change detection method aims to build a model based on the profile behaviour of the graph during the recent past, and search for deviations in the behaviour of the current graph with respect to the model. The majority of change detection methods monitor a representative summary extracted from the overall graph, or parts of the graph, such as vertices, edges or subgraphs111 A subgraph is a subset of vertices and edges in the graph. to characterise behaviour and analyse deviations. For example, in order to detect fraudulent collaborations in social networks, Yu et al., (2014) track the properties of communities, while Neil et al., 2013b observe the appearance of unlikely edges to detect intrusions in a computer network. The choice of unit (either overall graph, vertices, edges or subgraphs) to track over time to detect changes, mainly depends on the given application.
Change detection in dynamic networks has many vital applications:
-
•
Social network analysis:
Changes in popular social networks such as Facebook, Twitter, LinkedIn or Youtube may arise as a result of individuals or groups of individuals making deviations in their usual relationship patterns. For example, a group of fraudsters in an on-line auction network who previously had no relationships may suddenly collaborate to boost the reputation of their product. Such changes will be reflected as changes in the corresponding dynamic network, so change detection enables detection of those fraudsters (Pandit et al.,, 2007). -
•
Financial market analysis:
A financial network represents the dynamic inter-relationships between the world’s various financial markets. Changes in international trade or countries’ stock markets at a certain point in time, correspond to changes in the structure of the corresponding financial network (Durante and Dunson,, 2014) . Such changes should be detected early to minimize financial crisis situations. -
•
Network traffic monitoring:
A dynamic computer network can be represented as a time sequence of edge attributed graphs, where the vertices represent the computers, and the edges represent the volume of traffic between each pair of computers. A change in the usual amount of traffic between a pair of computers may indicate a fault in the system or even an intrusion. Such changes can be detected by continuously tracking the edges over time (Sun et al.,, 2006). -
•
Analysis of earth-science data:
Earth scientists detect natural disasters by analysing data about variables such as vegetation cover, temperature, and pressure at certain locations over time. Natural disasters such as wildfires correspond to abrupt changes in the time-series of these variables. However, these variables are most often inherently correlated with each other. Accounting for these inherent correlations, by formulating a network, and applying network-based change detection methods, increase the detection ability of such natural disasters (Cheng et al.,, 2008). -
•
Connectomic applications:
Connectomics involves the study of inter-relationships among different regions of the brain. Inter-relationships between brain regions can be observed over time, and represented as a dynamic network. A sudden neurological failure such as an epilepsy attack, will correspond to a change in the structure of the network (Durante et al.,, 2014). Hence, change detection can be used to improve diagnosis and treatment of such medical conditions.
In order to accurately detect changes, we need to consider the following issues:
Scale and dynamics: Many real-world networks are considerably large in size. For example, the Facebook contains more than one billion users,222http://newsroom.fb.com/company-info/ and the World Wide Web consists of more than 40 billion web pages333http://www.worldwidewebsize.com/. A graph representing the entity-relationships in these datasets is also large, with billions of vertices and edges. If such data are collected in real time, the speed at which they arrive is also an issue. We require fast methods to study the structure of such graphs at each time instant.
Complexity: As mentioned previously, the vertices and edges of a graph can be tagged with attributes capturing specific information about entities and their relationships. A change detection method should effectively combine all available and useful information in order to obtain accurate results. However, the inclusion of edge and vertex attributes increases the complexity.
Lack of prior information: Data we receive often arrives with no a priori knowledge about the underlying situation. Hence, we have no knowledge about the recent past behaviour, and this should be obtained from the data using a method that is both accurate and computationally efficient (Nickel,, 2013).
In this review we discuss several literature to date on change detection methods in dynamic attributed networks.
Our paper is organized as follows. First in Section 3, we review previous surveys that address the problem of change detection in dynamic networks. In Section 2, we define the graph theoretic notations that we utilize throughout the paper. In Section 4 we first describe the structure of our paper and how we categorize methods for change detection. We further clarify what we consider as attribute information when reviewing past literature. In the next five subsections, we provide a thorough review of different change detection methods based on the categorization introduced in Section 4. In Section 4.1, we review methods that detect changes in the overall graph. These methods detect points in time where the majority of vertices, edges, subgraphs or communities change their behaviour compared to recent past. In Section 4.2, we review methods that focus on detecting changes in vertex behaviour. Section 4.3 discusses methods that detect abnormally evolving edges in the network. A subgraph is a collection of vertices and edges. Section 4.4 reviews methods that detect changes in subgraph behaviour. In this category, we separately discuss methods on communities (Section 4.4), which are a special type of subgraph. In Section 5, we critically assess the strengths and weaknesses of different approaches with respect to computational efficiency and applicability in different situations. We also mention procedures that can be utilized for evaluating a novel method developed for a dynamic network. Finally in Section 6, we provide a concluding summary of our review.
2 NOTATION AND TERMINOLOGY
A network can be mathematically represented as a graph, , where is a set of vertices and is a set of edges. An edge connects two vertices and can be directed or undirected. For example, in the case of a simple graph with vertices, will contain a list of those edges that are present in the graph. From this edge list, the presence or absence of an edge between each pair of vertices can be encoded as an binary adjacency matrix, , where each element, , is if the edge between vertices and appears in , and otherwise. In an attributed graph, additional information is assigned to the edges or vertices or both, this information is called a weight. An attributed graph can be encoded as an weighted adjacency matrix, , and is the non-negative weight of the edge between vertices and , and means that vertices and are not connected by an edge. In this review, we consider graphs where the edge weights are proportional to the strength of the relationship between the corresponding entities.
A dynamic attributed network can be mathematically represented as a time sequence of attributed graphs, where . Since our focus is on a dynamic attributed network with a fixed set of entities, we will have as a special case.
3 OTHER RELATED SURVEYS
Akoglu et al., (2015) surveys a vast variety of methods that do change detection in dynamic unattributed networks. They categorize these methods based on the type of graph summary extracted as well as the type of change detected. They review feature-based methods, decomposition-based methods, community-based methods and window-based methods. Feature-based methods calculate graph summaries based on graph properties such as the degree distribution of the network. Decomposition-based methods apply matrix or tensor decomposition techniques on the adjacency matrix or tensor, representing the network. Community-based methods monitor the communities in the network to detect structural changes. Window-based methods incorporate the idea of a moving window over the time sequence of graphs to detect changes from the recent past behaviour. They present a thorough treatment on the subject of change detection methods derived for unattributed dynamic networks. However, Akoglu et al., do not address the problem of detecting changes in dynamically changing attributed networks.
Aggarwal and Subbian, (2014) is another survey paper that covers some change detection methods on dynamic networks. The main goal of their paper is to give a comprehensive review on methods for studying the evolutionary behaviour of a dynamic network. They review a few methods that quantify the changes occurring in the vertices and edges. The discussed changes focus on centrality of vertices, behaviour of communities and shortest path distances between vertices. They further discuss the applicability of each method to slowly evolving networks and streaming networks. In addition to change detection methods, Aggarwal and Subbian, provide a comprehensive discussion on dynamic network generation mechanisms.
Given a time sequence of graphs, Ranshous et al., (2015) provide a thorough review on methods that detect vertices, edges, subgraphs or time instants that depict irregular evolutionary behaviour compared to the rest of the network. Their review is organized based on the underlying design principles of those methods, such as those based on community detection, graph compression, matrix decomposition and distance metric calculation. Although Ranshous et al., (2015) cover methods that detect changes in a dynamic network, the main goal of their survey paper is not reviewing change detection methods that exploit attribute information.
While all the above mentioned survey papers cover different aspects of previous change detection methods, their overall focus is different from ours. In our paper we give a deeper discussion on change detection methods that specifically focus on utilizing attribute information. Furthermore, previous survey papers categorize methods based on the underlying methodologies behind the algorithms employed for change detection. The framework we follow is different. We take into account the levels of structure selected from each graph, to monitor over time for change detection.
4 CATEGORIZATION OF METHODS
As detailed in Section 1, changes in a dynamic network are deviations from usual activities, and change detection is the process of monitoring a time sequence of graphs to detect such deviations. Most change detection methods follow a common procedure as follows:
-
1.
Given a time sequence of graphs, determine the smallest unit in the graph (e.g., a vertex, an edge, a subgraph or the entire graph) that needs to be monitored over time to detect the change.
-
2.
At each time instant, extract a good summary measure from the graph that accurately represents the behaviour of the smallest unit selected.
-
3.
Calculate the dissimilarity between the summary measure obtained for the current time instant and a summary measure representing the profile behaviour of the unit during the recent past time instants. This dissimilarity measure is the change score for the current time instant.
Based on the unit selected, we divide the change detection methods reviewed into four main categories. They are methods that detect,
-
1.
changes in the overall graph (Section 4.1),
-
2.
changes in vertices (Section 4.2),
-
3.
changes in edges (Section 4.3), and
- 4.
Within each category we discuss methods that use vertex attributes and edge attributes. The attributes that we consider can be additional information about the entities and their relationships in the corresponding network or can be vertex or edge properties calculated from the adjacency matrix of the graph. Examples include quantitative attributes such as vertex degree (Borges et al.,, 2011) and edge weight (Idé and Kashima,, 2004), and categorical attributes such as vertex type (Jiang et al.,, 2015) and edge type (Koutra et al.,, 2012).
4.1 CHANGES IN THE OVERALL GRAPH
A change in the overall graph occurs when the majority of entities in a network change their usual relationship patterns. For example, Akoglu and Faloutsos, (2010) observe a mobile communication network over a six months period and discover that most people change their usual communication patterns during the Christian New Year. Changes in the behaviour of most vertices or edges in the graph are considered to be a change in the behaviour of the overall graph. Detecting changes in the overall graph is sometimes referred to as event detection (Ranshous et al.,, 2015).
In a computer network, we can obtain information regarding a set of computers and their interactions over time. Each interaction between a pair of computers contains attribute information such as connection type or number of connections. Idé and Kashima, (2004) represent such a computer network as an attributed and undirected graph, where the edge attributes are the number of connections between two computers at any given time instant. Each attributed graph is then represented as a weighted adjacency matrix, . The goal of Idé and Kashima, (2004)’s change detection method is to find time instants at which the majority of the edge attributes in the graph show significant deviation from the recent past. As it can be computationally inefficient to track each edge over time, the authors employ a spectral decomposition approach for this purpose. A positive semi-definite symmetric matrix, , can be decomposed as , where is an orthonormal matrix with columns containing the unit eigenvectors of , and is a diagonal matrix containing the corresponding eigenvalues (Horn and Johnson,, 2012). Idé and Kashima, (2004) extract the principal eigenvector corresponding to the maximum eigenvalue and use it as the representative summary of the graph. The principal eigenvector is a non-negative vector, where larger elements correspond to vertices that have high connectivity or have neighbours with high connectivity in the graph. Hence, Idé and Kashima, call this vector the activity vector, . This way, the time sequence of graphs can now be represented as a time sequence of activity vectors. At each time instant, , singular value decomposition (SVD) is performed on the matrix whose columns are the activity vectors from the recent past time instants, and the profile behaviour is represented by the principal left singular vector, , which Idé and Kashima, (2004) call the typical activity vector. Finally a change score, , is obtained for each time instant by calculating the dot product between and given by
| (1) |
As and are unit vectors, corresponds to the cosine of the angle between and . Greater deviations from the recent past behaviour correspond to larger angles which give higher change scores. The activity vector at the detected change point is further investigated to detect the vertices that are mostly responsible for the change.
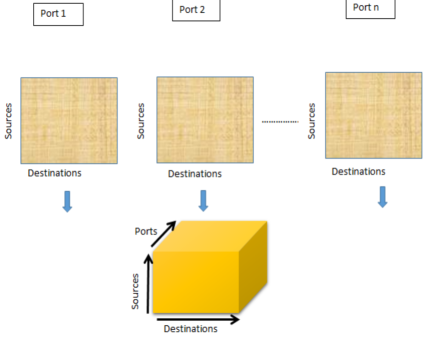
In most real-world phenomena, we have multiple sources of information describing different types of relationships associated with entities, which can be captured by a multi-view network. For example, we can build a multi-view network over a given set of people based on their relationships over multiple social networking sites such as Facebook, Twitter and Youtube (Tang et al.,, 2012). A multi-view network is conceptualized as a multi-graph, which is a graph with multiple edge attributes. When a graph has multiple edge attributes, a tensor is preferable to a matrix in order to capture the complex connectivity structure. A tensor is a multidimensional array 444Note that a matrix is a special type of tensor, that is of dimension two.. There are two ways to represent a dynamic multi-view network as a tensor. First, a dynamic multi-view network can be represented as a time sequence of three-dimensional tensors. Here, the first two dimensions of each tensor denote the vertices, and the third dimension denotes the categorical edge attributes. For example, consider a dataset containing port usage in a computer network observed at specific time instants. This dataset may contain the source IP addresses, destination IP addresses, and the port numbers used. Each time instant can then be represented as a tensor, where the first two dimensions represent the sources and destinations, and the third dimension represents the port numbers. The tensor elements may be weighted or binary. In a weighted tensor, each element quantifies a communication between the corresponding source and destination via the corresponding port. Figure 4 shows how the sources, destinations, and ports are represented as a three dimensional tensor. The second way is to represent the whole multi-view dynamic network as a four dimensional tensor. The first three dimensions constitute the tensor in the first method, while time is added as the fourth dimension.
As discussed above, a tensor can be used to represent both quantitative and categorical edge attributes pertaining to a dynamic network. Thus, we review some previous tensor-based change detection methods. The majority of tensor-based change detection methods use tensor decomposition to obtain a low-rank approximation, , of the original tensor, , at each time instant (a detailed review on tensor decomposition methods is provided in Kolda and Bader, (2009)). The reconstruction error, , measures how well the tensor is approximated at that time instant. Sun et al., (2006) decompose each tensor, , and obtain the reconstruction error, . If is standard deviations away from the mean of error values so far, that time instant is characterized as a change point. The tensor-based change detection methods that we find in the literature mainly differ by the technique employed to decompose the tensor. For example, Kolda and Sun, (2008) detect change points by doing Memory Efficient Tucker (MET) decomposition. MET addresses the immediate blow-up problem which occurs when the input and output tensors exceed the available memory space during computations for large and sparse graphs. Papalexakis et al., (2012), on the other hand, employ the PARAFAC tensor decomposition technique (Harshman,, 1972) in their change detection method. For a comprehensive discussion on tensors and tensor decomposition methods, we direct the reader to Kolda and Bader, (2009). Furthermore, a collection of tensor-based anomaly detection methods is extensively surveyed in Fanaee-T and Gama, (2016).
Calculating similarity between graphs is a well studied problem (Faloutsos,, 2009), but there are a very few papers that make use of the attributes of vertices or edges. Papadimitriou et al., (2010) introduce several similarity metrics to detect change points in an evolving web network. This network is represented as a time sequence of directed, attributed graphs where vertices correspond to active web pages, and attributed edges represent the number of hyperlinks between these web pages. Papadimitriou et al., calculate similarity between consecutive graphs based on the ranks of the vertices and edges. The rank of a vertex is calculated using its quality score obtained from the PageRank method in Eiron et al., (2004). The rank of an edge is calculated by multiplying the weight of a given edge by the quality of the vertices adjacent to it and then normalizing by a constant factor. By comparing similarity between all consecutive graphs, a time sequence of similarity measures is obtained. The measure is for perfect dissimilarity and for perfect similarity. Papadimitriou et al., use a simple thresholding algorithm to detect time instants with high dissimilarity. However, time series analysis techniques can be used after obtaining a time sequence of similarity scores as a more sophisticated method to detect change points. For example, autoregressive integrated moving average (ARIMA) method was employed in Pincombe, (2005)’s change detection algorithm.
Gahrooei and Paynabar, (2017) use a probabilistic model based approach to detect global structural changes occurring in a dynamic attributed network. They model each static attributed graph using a generalized linear model (GLM), where the probability of an edge between two vertices is defined as a function of the categorical attributes attached to them. For example, in a social network, these attributes can be the age, location and occupation of the corresponding entities. The GLM assumes each edge to be generated from a probability distribution in the exponential family, such as Bernoulli, Poisson, normal, gamma and so on. Thus, the GLM framework facilitates to model a range of edge attributes such as edge existence, rate of connectivity and volume of connections. The dependency between the time sequence of graphs is captured by constructing a state-space model on the parameters of the GLM, and by using an extended Kalman filter to estimate and update parameters over time. The parameters estimated at are used to predict the graph at and calculate Pearson residuals. These residuals are monitored over time using an exponentially weighted moving average (EWMA) control chart to detect global structural changes in the stream of graphs.
Non parametric probabilistic methods have the flexibility of defining the structure of the model from the data itself without adhering to prior assumptions. One of the most basic non-parametric methods is the histogram. Borges et al., (2011) employ a histogram-based approach to detect change points by studying the distribution of vertex attributes in a dynamic network. At each time instant, eight vertex attributes such as degree, betweenness, closeness, eigenvector centrality and so on are collected for every vertex in the graph. Given a time sequence of graphs, the joint probability distribution of the eight vertex attributes is defined as a histogram, . The histogram for the joint vertex attributes up to time instant , is then converted to a density estimate, using add-one smoothing method. The divergence between the two density estimates, and , is then measured using the cross entropy between them. This is defined as the change score for . A high divergence score implies significant change in the behaviour of the global structure compared to the past.
McCulloh and Carley, (2011) describe a method based on cumulative sum (CUSUM) control chart to detect changes in a dynamic social network. Changes are detected for graph level measures (such density, eigenvector centrality) as well as vertex level measures (closeness, betweenness) averaged over the graph. At each time instant, the mean and variance of the measure during recent past is compared with the current measure to calculate the CUSUM’s and statistics. These measures are then compared to a control limit to determine if a change is indicated. Once a change point is detected, the corresponding network is further investigated to identify the responsible entities or connections. The CUSUM chart is well suited for detecting small or gradual changes in an unsupervised environment. However, this approach assumes the network measures to be normally distributed. Thus, the application of this method is limited.
Change detection methods discussed in Section 4.1 focus on deviations in the behaviour of the overall network. Some changes occurring in the network might not affect the whole network. These changes would go unnoticed, unless the investigation is narrowed down to local structures.
4.2 CHANGES IN VERTICES
Vertex-based methods are very useful when we want to track the behaviour of important entities in the network. Akoglu and Faloutsos, (2010) optimize the decomposition-based strategies discussed in Idé and Kashima, (2004) (Section 4.1) to detect changes in vertex behaviour. The inputs to their algorithm are twelve vertex attributes observed at each vertex over time. The whole dataset is first represented as a three-dimensional array, where the three dimensions are the N vertices, F attributes, and time instants. To detect changes of vertex , the slice of the array corresponding to vertex is first selected. A window of size is then defined over F time series. The correlation between each pair of attributes within the window is calculated using Pearson’s correlation coefficient, resulting in a correlation matrix for all F attributes. By moving the window to cover all time instants, a time sequence of correlation matrices is obtained. Let be the value of attribute for vertex at time instant . The slice corresponding to vertex includes the set of time sequences, for and . Let be defined as the matrix calculated at time instant for vertex , where each element, , gives the absolute value of the correlation between and by
| (2) |
where
| (3) |
and
| (4) |
Each element in denotes the strength of the relationship between each pair of attributes. Thus, matrices are analogous to the weighted adjacency matrices analysed in Idé and Kashima, (2004) (Section 4.1). Akoglu and Faloutsos, (2010) apply Idé and Kashima, (2004)’s activity vector-based change detection procedure over to detect changes in vertex ’s behaviour. However, for a large dynamic network consisting of a large number of entities, it would not be computationally efficient to detect changes in every vertex’s behaviour using this method. Hence, this method is more suitable to track a small number of selected vertices that are identified as interesting in advance.
In most scientific studies, data are generated as multivariate time series. Some examples include, climate studies where time varying data are collected on multiple variables such as temperature, precipitation and water discharges (Jarušková,, 1997) and studies on financial markets where data on asset returns are observed over time (Lavielle and Teyssiere,, 2006). Given multivariate time series data, a change in the correlation structure may indicate a change-point in the overall system. For example, neurons in parts of the brain show extreme synchronisation at the time of occurrence of a seizure (Jérémy et al.,, 2009). Thus, many researches have been conducted in detecting correlation changes in multivariate time series data (Aue et al.,, 2009; Müller et al.,, 2005; Bulteel et al.,, 2014; Cabrieto et al.,, 2017). As discussed previously in Section 4.2, Akoglu and Faloutsos, (2010) obtain a time sequence of graphs from multivariate time series data and detect changes in their correlation structure. We believe that it would be worthwhile to investigate the suitability of such a graph-based approach to tackle the change-point detection problem in multivariate time series data.
In Jiang et al., (2015), the similarity between the categorical vertex attributes in the graph are used to calculate a weighted adjacency matrix, where the weights can be the correlation coefficient or the cosine similarity between the vector of attributes attached to the two vertices forming an edge. However, Jiang et al., (2015)’s goal is edge prediction. Nevertheless, this idea can also be utilized for the purpose of change detection. For example, it is possible to combine the weighted adjacency matrix obtained using categorical vertex attributes with the weighted adjacency matrix obtained using quantitative vertex attributes (Akoglu and Faloutsos,, 2010) or edge attributes (Idé and Kashima,, 2004) using a tensor (see Section 4.1 for a detailed discussion on tensors). It would be interesting to investigate whether the addition of categorical vertex attributes can improve change detection performance.
Rossi et al., (2013) use multiple vertex attributes to detect vertices with unusual transitions in their behaviour. Each time instant is first represented as a vertex-by-attribute matrix, . These attributes for the vertices are calculated from the graph by using Rolx method discussed in Henderson et al., (2012). Using Non-negative Matrix Factorization (NMF) (Henderson et al.,, 2012), each is then decomposed as , where and . The columns of matrix contain the latent factors for the attributes in , which are described as roles in the paper. Thus, the rows of describe the membership of each vertex corresponding to the roles at time instant . For each consecutive pair of time instants, the role transition model for a particular vertex, , is estimated using NMF as . Based on the estimated role membership matrix, , the change score for vertex is calculated as . Using this method, significant changes in a vertex’s role transition behaviour can be detected. The drawback of being restricted to compare only consecutive time instants is removed by employing a stacked transition model. This model generalizes the former concept to compare previous time instants from recent past with the current time instant .
4.3 CHANGES IN EDGES
These methods aim to detect individual edges or groups of edges that show changes in their behaviour. Some examples of edge-based changes include the appearance of an edge between two vertices in the graph which represents entities that are very unlikely to interact with each other, or a large increase or decrease in the weight of an edge compared to the recent past. For example, in an author conference network, we may observe an author who usually publishes papers only in conference proceedings related to a particular research area. However, at a certain point in time, he switches to a new research area and publishes a paper in a related conference proceedings. This forms an irregular connection with respect to his past connections in the network (Koutra et al.,, 2012).
Sricharan and Das, (2014) use a method based on commute time distances to detect changes involving edges. Given a graph, the commute time distance between vertex and vertex is the expected return path length between vertex and vertex (Lovász,, 1993). A fast and reliable method was introduced by Khoa and Chawla, (2012) to calculate commute time distances between vertices in large graphs. Sricharan and Das, (2014) adopt this method to detect edges that undergo changes in a time sequence of attributed graphs with weighted edges. Their change detection method, CAD (commute time-based anomaly detection) measures change in the commute time distance between two vertices in a graph inorder to detect changes in the associated edges. First, the commute time distances between every pair of vertices in a graph are calculated. The change-score, , for an edge between vertex and vertex is then given by
| (5) |
where is the weighted adjacency matrix and is the commute time distance matrix. A change in the edge weight between vertices, and , in turn affects the commute time distances between the neighbours of vertex and vertex . Measuring the change using and alone has been shown to result in many high change scores even for unchanged edges. Thus, Sricharan and Das, (2014) include the term, , in Equation 5 to address this problem of false detections. According to the experimental results in Sricharan and Das, (2014), CAD shows good performance in detecting changing relationships in many real-world networks. However, as CAD can only perform pairwise comparisons between consecutive graphs, it cannot be applied when several graphs from the recent past are required to characterize usual behaviour.
Heard et al., (2010) detect suspicious connections in a communication network with attributed edges using a two stage Bayesian approach. The number of communications between two vertices in a given time instant is taken as the edge attribute of the corresponding network. The edges in each time instant are modelled as a discrete time counting process. Based on the distribution derived from previous time instants, edges in the current time instant are assigned a p-value to quantify change. The vertices connected to the edges going through change are also detected. Finally, substructures formed by the detected vertices are further examined to identify suspicious regions in the network. Turcotte, (2014) in their work extended Heard et al.,’s work by adjusting the model to incorporate seasonality, which is a common characteristic in time varying communication networks.
In Section 4.1, we discuss how the reconstruction error of a tensor can be employed to detect changes in a dynamic multi-view network. Let be the tensor at time instant at which a global structural change has occurred. The search can be further narrowed down to detect edges that have changed their behaviour the most. This can be achieved by examining the elements of the residual tensor, (Ranshous et al.,, 2015). The elements in that show the highest scores correspond to edges that have changed most.
4.4 CHANGES IN SUBGRAPHS
In some scenarios, unusual activity spreads throughout a certain neighbourhood in a network and prevails for some time period. For example, in a road network that consists of street intersections connected by road segments, an accident may suddenly increase the traffic density in road segments near to the accident. Such a change is reflected as a change in the behaviour of some vertices and edges in the corresponding graph, where road segments are denoted as edges and street intersections are denoted as vertices. In this case, rather than observing the behaviour of individual vertices or edges, it is more useful to keep track of a local region in the graph. A local region is a subgraph formed by a set of vertices that lie in close proximity to each other (Idé et al.,, 2009), such as, a set of vertices in a -path (discussed later in the section) (Neil et al., 2013a, ), or a clique555A clique is a set of vertices, that are pairwise connected to each other. (Chen et al.,, 2012).
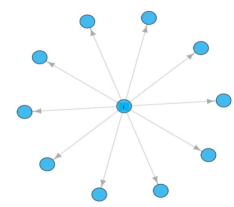
The concept of a scan statistic originated in spatial statistics and image analysis to detect regions of unusual activity (Marchette,, 2012). Scan statistics were then adopted in the area of network analysis to detect anomalous regions in a graph. Usually, a subgraph is defined centred at each vertex in the graph and a statistic is calculated. The subgraphs that show unusual values for this statistic are highlighted as anomalous. Priebe et al., (2005) use a scan statistics approach for change detection by detecting a subgraph that shows an unusual increase in interactions with respect to the recent past. The authors apply this method to a time sequence of graphs extracted from the Enron e-mail corpus666https://www.cs.cmu.edu/~./enron/. Each graph represents the email communications between a group of Enron executives during a week, and contains directed, binary edges. The th order neighbourhood of vertex is the set of all vertices that lie within a shortest path length of at most in the graph. The locality statistic for vertex , , at time instant is defined as the size of its -order neighbourhood. The locality statistic, , can also be considered as an attribute attached to a vertex at a given time instant. The maximum of the locality statistics, , is identified as the scan statistic at that time instant. By moving a window of length over the time sequence of scan statistics, a change score is obtained at each time instant. Time instants that give high change scores are detected as change points. For a given change point, , the vertices corresponding to are regarded as the vertices responsible for the detected change. When , the subgraph defining in Priebe et al., (2005) resembles a star that is centred at vertex (Figure 5).
Computer networks are vulnerable to attacks by intruders. One common type of intruder behaviour is intruder traversal (Neil et al., 2013a, ). For example, an intruder sends an email containing a link to a malicious web site to a set of users. When a user clicks on the link, the user’s computer gets infected and the intruder gains access to that computer. From this computer the intruder then compromises to another computer in a similar manner. In this way, the intruder traverses the whole computer network, accessing valuable data at each infected computer. Figure 6 illustrates the traversal behaviour of an intruder in a network.
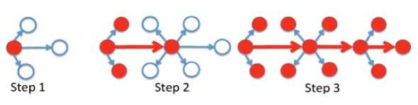
Neil et al., 2013a introduce a -path shaped subgraph to detect intruder traversal in a computer network. A -path is a directed subgraph, where both its size and diameter are equal to (Kolaczyk,, 2009). Neil et al., 2013a obtain scan statistics by fitting a Hidden Markov Model (HMM) on the edges of each -path in the graph. Similar to the procedure followed in Priebe et al., (2005), -paths that show different behaviour compared to their recent past are detected using a moving window approach.
A chatter anomaly is a group of vertices that show increased number of connections compared to their past behaviour. Pao et al., (2011) compare the power of several statistical tests in detecting a chatter anomaly appearing in an Erdős Rènyi random graph (Erdős and Rényi,, 1959). They showed that none of the considered global (size,order) as well as local (degree, size of th order neighbourhood) graph attributes produced a uniformly powerful test for the purpose of the detection of the chatter anomaly. A recent study by Park et al., (2013) utilizes these graph attributes simultaneously to detect change points caused by a chatter anomaly in a dynamic network. The graphs are assumed to be generated from a latent process model (Lee and Priebe,, 2011) (detailed discussed in Section 5). The new statistic the authors derive, is a linear combination of the nine graph attributes discussed in Pao et al., (2011)’s work. Tang et al., (2013) investigate the same test statistic for change detection on an attributed random graph, where the edges are annotated with a single categorical attribute.
Although not directly targeted at change detection, the ‘Timecrunch’ algorithm introduced in Shah et al., (2015) employ an information theoretic approach to understand the behaviour of a particular subgraph observed at each time instant. They assume that the most common types of subgraphs that can be found in real world networks are stars, full and near cliques, full and near bipartite cores and chains (Kleinberg et al.,, 1999). Each time instant is analysed to find the above mentioned subgraph types. Using a Minimum Description Length (MDL) principle, the temporal behaviour of these subgraphs is inferred. Two subgraphs in different time instants are identified as the same type, only if there is a substantial overlap in the set of vertices comprising them. Subgraphs that appear only at one time instant are classified as ‘Oneshot’. A subgraph that appears over a period of consecutive time instants is called as ‘Ranged’. Some subgraphs appear and disappear in random time instants, these are characterized as ‘Flickering’. Subgraphs that appear at fixed time intervals showing a seasonal behaviour are characterized as ‘Periodic’. ‘Constant’ subgraphs are the ones that are found to be present across all time instants.
Communities
A community is a special type of subgraph. There exist several definitions of a community in the network analysis literature. In some publications that use probabilistic model-based approaches to detect community structure in graphs (Holland et al.,, 1983; Aicher et al.,, 2014), a community is defined as a set of vertices that are stochastically equivalent. In other publications, a community is defined as a dense subgraph. Some examples along this line of research include, community detection through spectral clustering (Ng et al.,, 2001), hierarchical clustering (Newman,, 2004) and maximization of the so called “Newman–Girvan” modularity function (Newman,, 2004). In all the latter mentioned publications, a community consists of a group of vertices that have higher number of edges within the group than between the group and the rest of the graph. For example, in a social network, a community may correspond to a board of directors in a company who have stronger connections among themselves than with others.
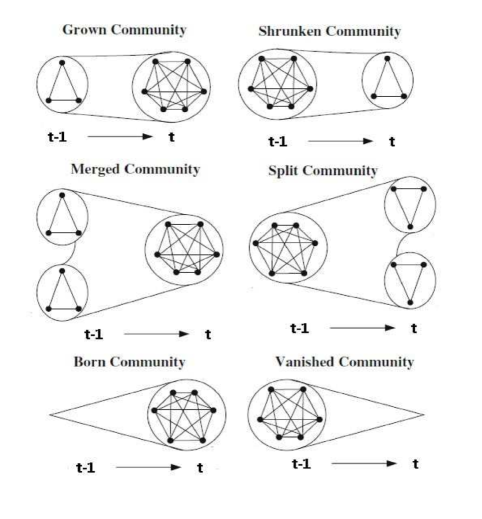
Communities in real-world networks are usually stable over time (Koujaku et al.,, 2013). Thus, deformation in community structure is a good indication of a change occurring in the network. Chen et al., (2012) define a community as a dense subgraph and discuss six basic changes that can occur in community structure of a graph (Figure 7):
-
1.
Grown community
Vertices get added into a smaller community, causing the community to grow into a larger community. The size of the community at time instant is greater than its size at . -
2.
Shrunken community
Community members leave a community, causing the community to become smaller. The size of the community at time instant is less than its size at . -
3.
Merged community
At time instant , there were two communities. These two communities join together and form a single larger community at time instant . -
4.
Split community
One community at time instant divides into two communities at time instant . -
5.
Born community
The edges between a set of vertices increase and form a community at time instant . This scenario uses the same notion as the form scenario discussed in Peel and Clauset, (2015). -
6.
Vanished community
A community that prevailed at time instant disappears at time instant because relationships between members cease to exist. The same change is also referred to as fragment in Peel and Clauset, (2015).
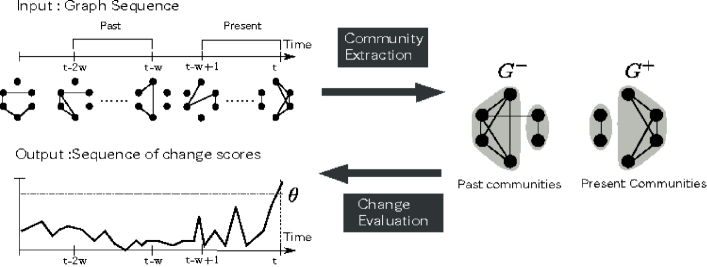
Koujaku et al., (2015) perform experiments to detect the above-mentioned six types of changes in community structure. Their method employs two moving windows for change score calculation. At each time instant, the first window contains time instants from to and the second window contains time instants from to . Let be the graph constructed from the time instants in the first window and let be the graph constructed from the time instants in the second window. A set of communities, , and another set, , are extracted777Koujaku et al., (2015) explore three algorithms, (i) graph scan (Wang et al.,, 2008), (ii) extraction method (Zhao et al.,, 2011), and (iii) dense core (Koujaku et al.,, 2013), for community extraction. from and , respectively. A change score, , is then calculated by using the Variational Information (VI) (Meilă,, 2003) between and . This is given by
| (6) | |||||
where and are the entropy and mutual entropy defined as
| (7) |
| (8) |
Finally, once a time sequence of change scores is obtained, a threshold, , is defined and time instants with change scores exceeding this threshold are detected as change points. Figure 8 is an illustration of Koujaku et al., (2015)’s change detection procedure.
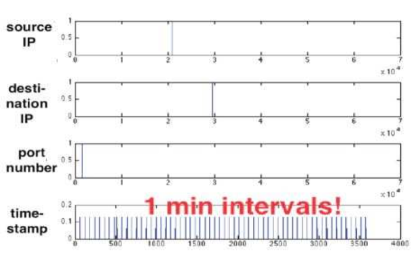
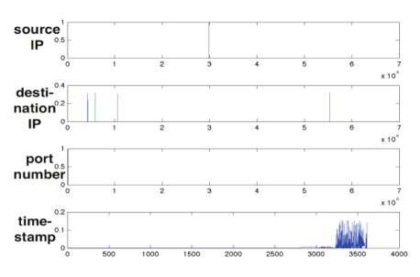
In Section 4.1, we discuss how we can represent a dynamic network with multiple edge attributes as a four-dimensional tensor. Koutra et al., (2012) represent the traffic measurements of a computer network as an tensor, , where the four dimensions represent source IP addresses, destination IP addresses, port numbers of the connections and time instants, respectively. They then do PARAFAC decomposition (Harshman,, 1970) and obtain factor matrices, and , where . Each column of represents a community of sources (source IP addresses) that have higher number of connections within themselves. Each column of represents a community of destinations (destination IP addresses). The columns of correspond to the port numbers of the connections established between communities represented by the respective columns in and , while the columns of give temporal profiles of these communities. Koutra et al., select the most important columns of these factor matrices, track them inorder to investigate changes in user behaviour and to detect intruder attacks in the computer network. For example, Figure 9 shows a plot of the same columns taken from each of the factor matrices, ,, and . We observe suspicious behaviour on port . The connection on port by a particular source IP address to a particular destination IP address is established periodically with perfectly evenly spaced spikes of activity. This type of behaviour is called a bot attack. Intruders in computer networks often exhibit this type of behaviour (Koutra et al.,, 2012). In Figure 10, from another common column taken from each of the four factor matrices, we observe an overwhelming burst of traffic concentrated in a certain time interval on port by a particular IP address connected to several destination IP addresses. This type of behaviour resembles a human browsing several websites during a given time interval.
Koutra et al., (2012)’s tensor-based change detection method is called tensor-splat. Tensor-splat is used for detecting changes in many real-world networks. For example, the DBLP dataset888http://dblp.uni-trier.de/xml/ consists of a large collection of papers that appeared at different conferences written by a number of authors over several years. Koutra et al., (2012) build a tensor with dimensions, , with the three dimensions representing authors, conferences, and years, respectively. When the tensor is decomposed using PARAFAC as described earlier, the communities indicated by the factor matrix representing authors, signify groups of authors who come from similar research areas. Using tensor-splat, Koutra et al., detect bridge authors who gradually changed their research area over time.
Peel and Clauset, (2015) discuss a parametric probabilistic approach to change detection. They assume each graph in the time sequence to be generated from a generalized hierarchical random graph model (GHRG), which is an improved version of the hierarchical random graph model (HRG) discussed in Clauset et al., (2007). Considering a community as a group of vertices that are stochastically equivalent, this model has the ability to capture assortative and disassortative community structure, while at the same time providing interpretable results for different types of networks. Peel and Clauset, detect change points as the time instants where the model parameters differ significantly from the expected model. By defining a window, a posterior Bayes factor is calculated between every pair of consecutive graphs to decide whether there is a parameter change or not. The maximum Bayes factor obtained within a window is the test statistic. This way, a time sequence of test statistics is obtained by moving the window across all graphs in the sequence. This sequence of test statistics is then input into a threshold calculation algorithm to detect the change points. The probabilistic model in Peel and Clauset, (2015) can easily be replaced with any random graph model. Thus, any model that can handle the vertex or edge attribute information can replace the GHRG model. For example we can employ the Weighted Stochastic Block Model (WSBM) (Aicher et al.,, 2014), that models both edge presence and edge weights (categorical or quantitative) of the graph.
5 DISCUSSION
As there are various types of change detection methods available, it is difficult to decide which ones would be useful for a given scenario. Selecting a method can be done by evaluating it’s performance. One may apply the method to a real world scenario and check whether the results agree with their ground truth information. Several dynamic datasets are available online for this purpose. The Enron email dataset (http://www.cs.cmu.edu/~enron/) provides information regarding emails exchanged in the Enron company. Enron was declared bankrupt in 2002 due to accountancy fraud activities by the top level executives. Since the Enron dataset is rich with ground truth information, it is used to evaluate the performance of many change detection methods (Azarnoush et al.,, 2016; Li et al.,, 2016; Peel and Clauset,, 2015; Rossi et al.,, 2013; Tang et al.,, 2008). Another popular dynamic network dataset is the Dblp dataset (http://dblp.uni-trier.de/db/). It contains bibliographic information in the area of computer science. Koutra et al., (2012), Yu et al., (2014), Sun et al., (2006) and Ji et al., (2013) are some of the papers that use the Dblp dataset in their experiments. Their discussions are helpful in evaluating the outcomes of a new change detection method. Furthermore, Ranshous et al., (2015) in their review paper, provide a comprehensive collection of publicly available datasets. In addition to these resources, we find some more interesting dynamic network datasets in <http://projects.csail.mit.edu/dnd/>. However, majority of these datasets do not contain multiple attribute information on vertices and edges. We direct the interested reader to <http://leitang.net/heterogeneous_network.html>, which provides access to three datasets, Enron, Dblp and You-tube that are rich with attribute information and also contain references to past publications that have analysed these datasets. Moreover, the ‘High School Contact and Friendship’ dataset available at <http://www.sociopatterns.org/datasets/> contains heterogeneous edge information that can be useful in obtaining an attributed dynamic network.
Another way to evaluate the quality of a method is by applying it to a simulated network. Leskovec et al., (2005) proposed a model that can generate a network with several real-world graph properties such as ‘preferential attachment’, ‘shrinking diameter’ and ‘densification power law characteristic’. We refer the reader to Aggarwal and Subbian, (2014) and the references therein for a detailed description about these characteristics. The graph at time is generated by the Kronecker product of the binary adjacency matrix at time by itself. A certain drawback of this method is the result of large multiplicities on the edges due to the Kronecker product between binary matrices. Leskovec et al., call this as the ‘staircase effect’. This problem has been resolved by the use of Stochastic Kronecker graphs. This produces a time sequence of weighted graphs where the weight of an edge is the probability of its existence. Akoglu et al., (2008) extend the above mentioned Kronecker recursion method to a tensor-based method. Initially the dynamic network is represented as a 3-dimensional tensor where the first and second dimensions represent the adjacency matrix of the graph and the third dimension represents time. Then the initial tensor is multiplied times recursively by itself to obtain the final tensor that represents the data. Empirical results in Akoglu et al., (2008) show how the graphs generated by this proposed network generator successfully mimic real world properties in weighted and unweighted dynamic networks.
Some authors apply the concepts of latent position models (Hoff et al.,, 2002) to generate a time series of graphs. Latent position models are a group of random graph models that characterize the structure of the graph using latent vectors associated with the vertices. Lee and Priebe, (2011), propose the latent process model to generate a time sequence of graphs with weighted edges. This model is developed based on the concept of the Random Dot Product Graph (RDPG) model (Nickel,, 2007). The RDPG model is a special type of latent position model. Here, the probability of each edge in the graph is given by the dot product of the latent vectors associated with the two vertices forming the edge. In the latent process model, the weighted edges are a function of a continuous-time finite-state stochastic process emanating from the vertices. Using a time sequence of networks generated from this model, Park et al., (2013) detect change points caused by chatter anomalies (see section 4.2) appearing in time. Wang et al., (2014) also detected chatter anomalies by generating a dynamic network according to a time varying Stochastic Block Model (SBM) (Holland et al.,, 1983). The SBM is a random graph model that groups the vertices in the graph into several blocks, and the probability of an edge between two vertices depend mainly on their block membership. For each vertex in the graph, Wang et al., generate a latent vector using a Dirichlet distribution. Similar to an RDPG model, the probability of an edge between two vertices is then defined as the dot product of the corresponding latent vectors. By tuning the parameters of the Dirichlet distribution, the authors generate graphs from an SBM (Sussman et al.,, 2012). To get a general understanding about the underlying mechanisms of each of these random graph models, we direct the reader to Goldenberg et al., (2010) and Salter-Townshend et al., (2012).
6 CONCLUSION
In this paper, we review several change detection methods for dynamic attributed networks. We mainly categorize these approaches based on the structure level of the graph investigated to quantify the change. We also provide useful resources for dynamic network datasets. Finally, we review different synthetic network generating mechanisms for the interested reader.
The field of change detection in dynamic networks is a new and growing area. However, there are only a handful of publications that exploit vertex and edge attribute information. Addition of attribute information result in high dimensional data, that complicate the detection procedure in a dynamic scenario. However, due to its huge applicability to many real world situations, the popularity of this research area is rapidly growing. There is a high demand for scalable algorithms that can efficiently analyse this type of data (Big Data). Throughout this review paper, we guide the reader to possible paths of exploration in this direction.
ACKNOWLEDGEMENTS
The author extends her gratitude to Dr. Dominic Lee, Prof. Elena Moltchanova, Dr. Jeanette McLeod and Mr. Roger Jarquin from the School of Mathematics and Statistics, University of Canterbury, New Zealand, for providing insight and expertise that greatly assisted this work.
References
- Aggarwal and Subbian, (2014) Aggarwal, C. and Subbian, K. (2014). Evolutionary network analysis: A survey. ACM Computing Surveys (CSUR), 47(1):10.
- Aicher et al., (2014) Aicher, C., Jacobs, A. Z., and Clauset, A. (2014). Learning latent block structure in weighted networks. arXiv preprint arXiv:1404.0431.
- Akoglu and Faloutsos, (2010) Akoglu, L. and Faloutsos, C. (2010). Event detection in time series of mobile communication graphs. In Army Science Conference, pages 77–79.
- Akoglu et al., (2008) Akoglu, L., McGlohon, M., and Faloutsos, C. (2008). Rtm: Laws and a recursive generator for weighted time-evolving graphs. In Data Mining, 2008. ICDM’08. Eighth IEEE International Conference on, pages 701–706. IEEE.
- Akoglu et al., (2015) Akoglu, L., Tong, H., and Koutra, D. (2015). Graph based anomaly detection and description: a survey. Data Mining and Knowledge Discovery, 29(3):626–688.
- Aue et al., (2009) Aue, A., Hörmann, S., Horváth, L., Reimherr, M., et al. (2009). Break detection in the covariance structure of multivariate time series models. The Annals of Statistics, 37(6B):4046–4087.
- Azarnoush et al., (2016) Azarnoush, B., Paynabar, K., Bekki, J., and Runger, G. (2016). Monitoring temporal homogeneity in attributed network streams. Journal of Quality Technology, 48(1):28–43.
- Borges et al., (2011) Borges, N., Coppersmith, G., Meyer, G. G., Priebe, C. E., et al. (2011). Anomaly detection for random graphs using distributions of vertex invariants. In Information Sciences and Systems (CISS), 2011 45th Annual Conference on, pages 1–6. IEEE.
- Bulteel et al., (2014) Bulteel, K., Ceulemans, E., Thompson, R. J., Waugh, C. E., Gotlib, I. H., Tuerlinckx, F., and Kuppens, P. (2014). Decon: A tool to detect emotional concordance in multivariate time series data of emotional responding. Biological psychology, 98:29–42.
- Cabrieto et al., (2017) Cabrieto, J., Tuerlinckx, F., Kuppens, P., Grassmann, M., and Ceulemans, E. (2017). Detecting correlation changes in multivariate time series: A comparison of four non-parametric change point detection methods. Behavior research methods, 49(3):988–1005.
- Chen et al., (2012) Chen, Z., Hendrix, W., and Samatova, N. F. (2012). Community-based anomaly detection in evolutionary networks. Journal of Intelligent Information Systems, 39(1):59–85.
- Cheng et al., (2008) Cheng, H., Tan, P.-N., Potter, C., and Klooster, S. (2008). A robust graph-based algorithm for detection and characterization of anomalies in noisy multivariate time series. In 2008 IEEE International Conference on Data Mining Workshops, pages 349–358. IEEE.
- Clauset et al., (2007) Clauset, A., Moore, C., and Newman, M. E. (2007). Structural inference of hierarchies in networks. In Statistical network analysis: models, issues, and new directions, pages 1–13. Springer.
- Durante and Dunson, (2014) Durante, D. and Dunson, D. B. (2014). Bayesian dynamic financial networks with time-varying predictors. Statistics & Probability Letters, 93:19–26.
- Durante et al., (2014) Durante, D., Dunson, D. B., and Vogelstein, J. T. (2014). Nonparametric bayes modeling of populations of networks. arXiv preprint arXiv:1406.7851.
- Eiron et al., (2004) Eiron, N., McCurley, K. S., and Tomlin, J. A. (2004). Ranking the web frontier. In Proceedings of the 13th international conference on World Wide Web, pages 309–318. ACM.
- Erdős and Rényi, (1959) Erdős, P. and Rényi, A. (1959). On random graphs. Publicationes Mathematicae Debrecen, 6:290–297.
- Faloutsos, (2009) Faloutsos, L. A. M. M. C. (2009). Anomaly detection in large graphs.
- Fanaee-T and Gama, (2016) Fanaee-T, H. and Gama, J. (2016). Tensor-based anomaly detection: An interdisciplinary survey. Knowledge-Based Systems, 98:130–147.
- Fayyad et al., (1996) Fayyad, U., Piatetsky-Shapiro, G., and Smyth, P. (1996). From data mining to knowledge discovery in databases. AI magazine, 17(3):37.
- Gahrooei and Paynabar, (2017) Gahrooei, M. R. and Paynabar, K. (2017). Change detection in a dynamic stream of attributed networks. arXiv preprint arXiv:1711.04441.
- Goldenberg et al., (2010) Goldenberg, A., Zheng, A. X., Fienberg, S. E., and Airoldi, E. M. (2010). A survey of statistical network models. Foundations and Trends® in Machine Learning, 2(2):129–233.
- Harshman, (1970) Harshman, R. A. (1970). Foundations of the parafac procedure: Models and conditions for an” explanatory” multi-modal factor analysis.
- Harshman, (1972) Harshman, R. A. (1972). Determination and proof of minimum uniqueness conditions for parafac1. UCLA Working Papers in phonetics, 22(111-117):3.
- Heard et al., (2010) Heard, N. A., Weston, D. J., Platanioti, K., Hand, D. J., et al. (2010). Bayesian anomaly detection methods for social networks. The Annals of Applied Statistics, 4(2):645–662.
- Henderson et al., (2012) Henderson, K., Gallagher, B., Eliassi-Rad, T., Tong, H., Basu, S., Akoglu, L., Koutra, D., Faloutsos, C., and Li, L. (2012). Rolx: structural role extraction & mining in large graphs. In Proceedings of the 18th ACM SIGKDD international conference on Knowledge discovery and data mining, pages 1231–1239. ACM.
- Hoff et al., (2002) Hoff, P. D., Raftery, A. E., and Handcock, M. S. (2002). Latent space approaches to social network analysis. Journal of the american Statistical association, 97(460):1090–1098.
- Holland et al., (1983) Holland, P. W., Laskey, K. B., and Leinhardt, S. (1983). Stochastic blockmodels: First steps. Social networks, 5(2):109–137.
- Horn and Johnson, (2012) Horn, R. A. and Johnson, C. R. (2012). Matrix analysis. Cambridge university press.
- Huang and Gao, (2014) Huang, Y. and Gao, X. (2014). Clustering on heterogeneous networks. Wiley Interdisciplinary Reviews: Data Mining and Knowledge Discovery, 4(3):213–233.
- Idé and Kashima, (2004) Idé, T. and Kashima, H. (2004). Eigenspace-based anomaly detection in computer systems. In Proceedings of the tenth ACM SIGKDD international conference on Knowledge discovery and data mining, pages 440–449. ACM.
- Idé et al., (2009) Idé, T., Lozano, A. C., Abe, N., and Liu, Y. (2009). Proximity-based anomaly detection using sparse structure learning. In SDM, pages 97–108. SIAM.
- Jarušková, (1997) Jarušková, D. (1997). Some problems with application of change-point detection methods to environmental data. Environmetrics, 8(5):469–483.
- Jérémy et al., (2009) Jérémy, T., Catherine, M., Guy, G., and Brynjar, K. (2009). Sources of bias in synchronization measures and how to minimize their effects on the estimation of synchronicity: application to the uterine electromyogram. In Recent advances in biomedical engineering. InTech.
- Ji et al., (2013) Ji, T., Yang, D., and Gao, J. (2013). Incremental local evolutionary outlier detection for dynamic social networks. In Machine Learning and Knowledge Discovery in Databases, pages 1–15. Springer.
- Jiang et al., (2015) Jiang, M., Chen, Y., and Chen, L. (2015). Link prediction in networks with nodes attributes by similarity propagation. arXiv preprint arXiv:1502.04380.
- Khoa and Chawla, (2012) Khoa, N. L. D. and Chawla, S. (2012). Large scale spectral clustering using resistance distance and spielman-teng solvers. In Discovery Science, pages 7–21. Springer.
- Kleinberg et al., (1999) Kleinberg, J. M., Kumar, R., Raghavan, P., Rajagopalan, S., and Tomkins, A. S. (1999). The web as a graph: measurements, models, and methods. In Computing and combinatorics, pages 1–17. Springer.
- Kolaczyk, (2009) Kolaczyk, E. D. (2009). Statistical analysis of network data: methods and models. Springer.
- Kolda and Bader, (2009) Kolda, T. G. and Bader, B. W. (2009). Tensor decompositions and applications. SIAM review, 51(3):455–500.
- Kolda and Sun, (2008) Kolda, T. G. and Sun, J. (2008). Scalable tensor decompositions for multi-aspect data mining. In Data Mining, 2008. ICDM’08. Eighth IEEE International Conference on, pages 363–372. IEEE.
- Koujaku et al., (2013) Koujaku, S., Kudo, M., Takigawa, I., and Imai, H. (2013). Structrual change point detection for evolutional networks. In Proceedings of the World Congress on Engineering, volume 1.
- Koujaku et al., (2015) Koujaku, S., Kudo, M., Takigawa, I., and Imai, H. (2015). Community change detection in dynamic networks in noisy environment. In Proceedings of the 24th International Conference on World Wide Web Companion, pages 793–798. International World Wide Web Conferences Steering Committee.
- Koutra et al., (2012) Koutra, D., Papalexakis, E. E., and Faloutsos, C. (2012). Tensorsplat: Spotting latent anomalies in time. In Informatics (PCI), 2012 16th Panhellenic Conference on, pages 144–149. IEEE.
- Lavielle and Teyssiere, (2006) Lavielle, M. and Teyssiere, G. (2006). Detection of multiple change-points in multivariate time series. Lithuanian Mathematical Journal, 46(3):287–306.
- Lee and Priebe, (2011) Lee, N. and Priebe, C. (2011). A latent process model for time series of attributed random graphs. Statistical inference for stochastic processes, 14(3):231–253.
- Leskovec et al., (2005) Leskovec, J., Chakrabarti, D., Kleinberg, J., and Faloutsos, C. (2005). Realistic, mathematically tractable graph generation and evolution, using kronecker multiplication. In Knowledge Discovery in Databases: PKDD 2005, pages 133–145. Springer.
- Li et al., (2016) Li, Z., Sun, D.-y., Li, J., and Li, Z.-f. (2016). Social network change detection using a genetic algorithm based back propagation neural network model. In Advances in Social Networks Analysis and Mining (ASONAM), 2016 IEEE/ACM International Conference on, pages 1386–1387. IEEE.
- Lovász, (1993) Lovász, L. (1993). Random walks on graphs: A survey. Combinatorics: Paul Erdös is, 80:353–397.
- Marchette, (2012) Marchette, D. (2012). Scan statistics on graphs. Wiley Interdisciplinary Reviews: Computational Statistics, 4(5):466–473.
- McCulloh and Carley, (2011) McCulloh, I. and Carley, K. M. (2011). Detecting change in longitudinal social networks. Technical report, Military Academy West Point NY Network Science Center (NSC).
- Meilă, (2003) Meilă, M. (2003). Comparing clusterings by the variation of information. In Learning theory and kernel machines, pages 173–187. Springer.
- Müller et al., (2005) Müller, M., Baier, G., Galka, A., Stephani, U., and Muhle, H. (2005). Detection and characterization of changes of the correlation structure in multivariate time series. Physical Review E, 71(4):046116.
- (54) Neil, J., Hash, C., Brugh, A., Fisk, M., and Storlie, C. B. (2013a). Scan statistics for the online detection of locally anomalous subgraphs. Technometrics, 55(4):403–414.
- (55) Neil, J., Uphoff, B., Hash, C., and Storlie, C. (2013b). Towards improved detection of attackers in computer networks: New edges, fast updating, and host agents. In Resilient Control Systems (ISRCS), 2013 6th International Symposium on, pages 218–224. IEEE.
- Newman, (2004) Newman, M. E. (2004). Detecting community structure in networks. The European Physical Journal B-Condensed Matter and Complex Systems, 38(2):321–330.
- Ng et al., (2001) Ng, A. Y., Jordan, M. I., and Weiss, Y. (2001). On spectral clustering1 analysis and an algorithm. Proceedings of Advances in Neural Information Processing Systems. Cambridge, MA: MIT Press, 14:849–856.
- Nickel, (2007) Nickel, C. L. M. (2007). Random dot product graphs: A model for social networks, volume 68.
- Nickel, (2013) Nickel, M. (2013). Tensor factorization for relational learning. PhD thesis, lmu.
- Pandit et al., (2007) Pandit, S., Chau, D. H., Wang, S., and Faloutsos, C. (2007). Netprobe: a fast and scalable system for fraud detection in online auction networks. In Proceedings of the 16th international conference on World Wide Web, pages 201–210. ACM.
- Pao et al., (2011) Pao, H., Coppersmith, G. A., and Priebe, C. E. (2011). Statistical inference on random graphs: Comparative power analyses via monte carlo. Journal of Computational and Graphical Statistics, 20(2):395–416.
- Papadimitriou et al., (2010) Papadimitriou, P., Dasdan, A., and Garcia-Molina, H. (2010). Web graph similarity for anomaly detection. Journal of Internet Services and Applications, 1(1):19–30.
- Papalexakis et al., (2012) Papalexakis, E. E., Faloutsos, C., and Sidiropoulos, N. D. (2012). Parcube: Sparse parallelizable tensor decompositions. In Machine Learning and Knowledge Discovery in Databases, pages 521–536. Springer.
- Park et al., (2013) Park, Y., Priebe, C. E., and Youssef, A. (2013). Anomaly detection in time series of graphs using fusion of graph invariants. Selected Topics in Signal Processing, IEEE Journal of, 7(1):67–75.
- Peel and Clauset, (2015) Peel, L. and Clauset, A. (2015). Detecting change points in the large-scale structure of evolving networks. In Twenty-Ninth AAAI Conference on Artificial Intelligence.
- Pincombe, (2005) Pincombe, B. (2005). Anomaly detection in time series of graphs using arma processes. ASOR BULLETIN, 24(4):2.
- Priebe et al., (2005) Priebe, C. E., Conroy, J. M., Marchette, D. J., and Park, Y. (2005). Scan statistics on enron graphs. Computational & Mathematical Organization Theory, 11(3):229–247.
- Ranshous et al., (2015) Ranshous, S., Shen, S., Koutra, D., Harenberg, S., Faloutsos, C., and Samatova, N. F. (2015). Anomaly detection in dynamic networks: a survey. Wiley Interdisciplinary Reviews: Computational Statistics, 7(3):223–247.
- Rossi et al., (2013) Rossi, R. A., Gallagher, B., Neville, J., and Henderson, K. (2013). Modeling dynamic behavior in large evolving graphs. In Proceedings of the sixth ACM international conference on Web search and data mining, pages 667–676. ACM.
- Salter-Townshend et al., (2012) Salter-Townshend, M., White, A., Gollini, I., and Murphy, T. B. (2012). Review of statistical network analysis: models, algorithms, and software. Statistical Analysis and Data Mining, 5(4):243–264.
- Shah et al., (2015) Shah, N., Koutra, D., Zou, T., Gallagher, B., and Faloutsos, C. (2015). Timecrunch: Interpretable dynamic graph summarization. In Proceedings of the 21th ACM SIGKDD International Conference on Knowledge Discovery and Data Mining, pages 1055–1064. ACM.
- Singh and Singh, (2015) Singh, P. and Singh, M. (2015). Fraud detection by monitoring customer behavior and activities. International Journal of Computer Applications, 111(11).
- Sricharan and Das, (2014) Sricharan, K. and Das, K. (2014). Localizing anomalous changes in time-evolving graphs. In Proceedings of the 2014 ACM SIGMOD international conference on Management of data, pages 1347–1358. ACM.
- Sun et al., (2006) Sun, J., Tao, D., and Faloutsos, C. (2006). Beyond streams and graphs: dynamic tensor analysis. In Proceedings of the 12th ACM SIGKDD international conference on Knowledge discovery and data mining, pages 374–383. ACM.
- Sussman et al., (2012) Sussman, D. L., Tang, M., Fishkind, D. E., and Priebe, C. E. (2012). A consistent adjacency spectral embedding for stochastic blockmodel graphs. Journal of the American Statistical Association, 107(499):1119–1128.
- Tang et al., (2008) Tang, L., Liu, H., Zhang, J., and Nazeri, Z. (2008). Community evolution in dynamic multi-mode networks. In Proceedings of the 14th ACM SIGKDD international conference on Knowledge discovery and data mining, pages 677–685. ACM.
- Tang et al., (2012) Tang, L., Wang, X., and Liu, H. (2012). Community detection via heterogeneous interaction analysis. Data Mining and Knowledge Discovery, 25(1):1–33.
- Tang et al., (2013) Tang, M., Park, Y., Lee, N. H., and Priebe, C. E. (2013). Attribute fusion in a latent process model for time series of graphs. IEEE Transactions on Signal Processing, 61(7):1721–1732.
- Turcotte, (2014) Turcotte, M. (2014). Intended for: Phd thesis.
- Wang et al., (2008) Wang, B., Phillips, J. M., Schreiber, R., Wilkinson, D. M., Mishra, N., and Tarjan, R. (2008). Spatial scan statistics for graph clustering. In SDM, pages 727–738. SIAM.
- Wang et al., (2014) Wang, H., Tang, M., Park, Y., and Priebe, C. (2014). Locality statistics for anomaly detection in time series of graphs.
- Yu et al., (2014) Yu, R., He, X., and Liu, Y. (2014). Glad: Group anomaly detection in social media analysis. In Proceedings of the 20th ACM SIGKDD international conference on Knowledge discovery and data mining, pages 372–381. ACM.
- Zhao et al., (2011) Zhao, Y., Levina, E., and Zhu, J. (2011). Community extraction for social networks. Proceedings of the National Academy of Sciences, 108(18):7321–7326.