A spectroscopic survey of Abell 1703: is it a rare relaxed cluster hosting a radio halo or a usual merging system?
Abstract
We present the study of the internal dynamics of the intriguing galaxy cluster Abell 1703, a system hosting a probable giant radio halo whose dynamical status is still controversial. Our analysis is based on unpublished spectroscopic data acquired at the Italian Telescopio Nazionale Galileo and data publicly available in the literature. We also use photometric data from the Sloan Digital Sky Survey. We select 147 cluster members and compute the cluster redshift and the global line-of-sight velocity dispersion km s-1. We infer that Abell 1703 is a massive cluster: . The results of our study disagree with the picture of an unimodal, relaxed cluster as suggested by previous studies based on the gravitational lensing analysis and support the view of a perturbed dynamics proposed by recent works based on Chandra X-ray data. The first strong evidence of a dynamically disturbed cluster comes from the peculiarity of the BCG velocity with respect to the first moment of the velocity distribution of member galaxies. Moreover, several statistical tests employed to study the cluster galaxies kinematics find significant evidence of substructure, being Abell 1703 composed by at least two or three subclumps probably caught after the core-core passage. In this observational scenario, the suspected existence of a radio halo in the centre of this cluster is not surprising and well agrees with the theoretical models describing diffuse radio sources in clusters.
keywords:
Galaxies: clusters: general. Galaxies: cluster: individual: Abell 1703. Galaxies: kinematics and dynamics.1 INTRODUCTION
Radio haloes (also giant radio haloes, or GRHs) are diffuse sources found in the central regions of massive () galaxy clusters. Extended over volumes of 1 Mpc3, these low surface brightness features (1 Jy arcsec-2 at 1.4 GHz) have no obvious optical counterparts and roughly follow the intracluster medium (ICM) mass distribution. Their synchrotron steep-spectrum (; ) reveals the existence of a population of relativistic electrons and large-scale magnetic fields spread throughout the ICM (see, e.g., Feretti et al. 2012 for a review).
Until recently, GRHs were always discovered in merging clusters (e.g. van Weeren et al. 2019). Indeed, in the hierarchical scenario of cosmic structure formation, it is a common fact that galaxy groups and subclusters merge together into massive clusters. These processes release enormous amounts of gravitational energy (as large as erg; Sarazin 2002) and induce turbulence in the ICM, which is considered the key mechanism able to accelerate particles to relativistic energies (e.g. Brunetti & Jones 2015).
However, in the last years this picture got more complicated following the discovery of diffuse radio emission in several dynamically relaxed clusters. The first, impacting, case was the extended radio source found in the cluster CL1821+643 (; Bonafede et al. 2014, Boschin et al. 2018), whose size, location and power resemble that of typical GRHs despite the absence of any merging process responsible for its formation. Indeed, this case is not unique, since diffuse radio sources not powered by major mergers have been recently discovered in more clusters in the redshift range 0.1-0.3. For instance, Abell 2390 and Abell 2261 (Sommer et al. 2017) are two more examples of cool-core clusters with Mpc-scale radio sources. Intriguing are also the cases of PSZ1G139.61+24 and Abell 2142. The first one hosts both a mini-halo (a feature tipically found in cool-core relaxed systems, e.g. Gitti et al. 2018) and an underluminous and ultrasteep spectrum radio halo (Savini et al. 2018a). Abell 2142, on its hand, is affected by minor merging activity, as suggested by the cold fronts detected in its ICM. However, as in the case of PSZ1G139.61+24, it also exhibits a double-component extended radio emission (Venturi et al. 2017), with a spectral steepness increasing in the outer regions. These two last examples could be hybrid sources, with mini-halos evolving into GRHs or viceversa (van Weeren et al. 2019). It is expected that the number of these “intermediate” cases will increase considerably in the near future thanks to observational facilities like LOFAR (van Haarlem et al. 2013).
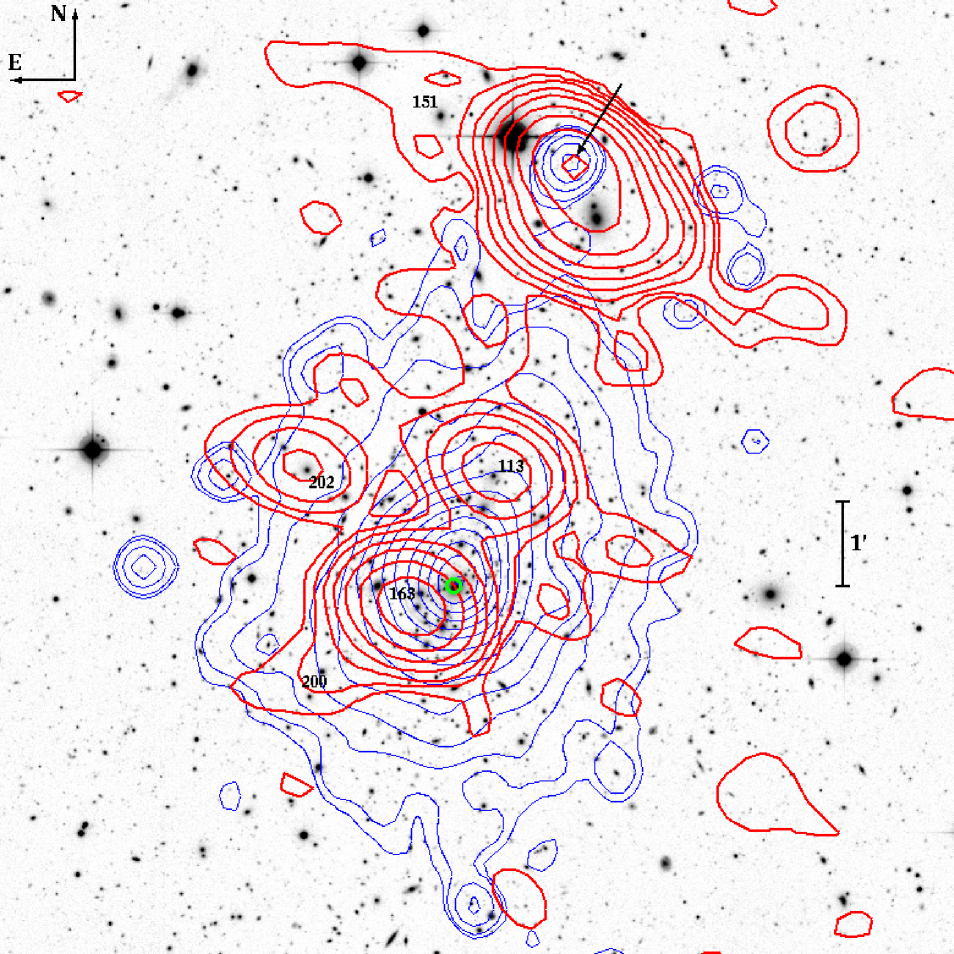
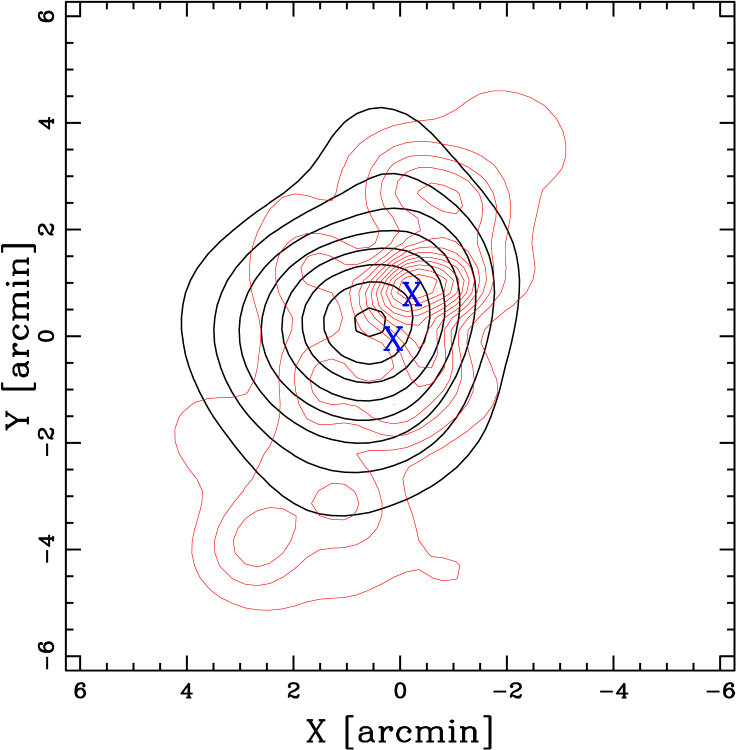
Taking into account this new framework, in this paper we focus on Abell 1703 (hereafter A1703; Abell 1958, Abell et al. 1989), a system at (Allen et al. 1992) whose dynamical status and radio properties might look like the ones of CL1821+643. In fact, several authors claim the possible existence of a radio halo in this cluster. The first hint comes from Owen et al. (1999; see their Table 2), who include A1703 in a list of nine clusters with diffuse radio emission. Indeed, A1703 is the brightest source in Owen et al. sample. More recently, the analysis of archival VLA data at 1.4 GHz showed some evidence of diffuse emission in the central region of the cluster (Govoni 2018, priv. comm.; see also our Fig. 1) despite contamination by radio pointlike sources (see Rizza et al. 2003 and our Sect. 2.1). Finally, Wilber (2018) highlights the presence in A1703 of possible radio halo emission at lower frequencies (120-168 MHz) in the LOFAR Two-Metre Sky Survey (LoTSS). This evidence is also confirmed by Savini et al. (2018b) in their Figure 8, where the contour levels at 144 MHz from LOFAR suggest the existence of a diffuse source in the location of the cluster.
On the other hand, the picture of A1703 that emerges at other wavelengths is controversial and suggest conflicting interpretations about the real dynamical status of this cluster. From the optical point of view A1703 is one of the richest clusters in the photometric catalogue of the SDSS (e.g. Koester et al. 2007) and presents a dominant giant elliptical cD galaxy in its centre (the brightest cluster galaxy; hereafter BCG). Moreover, this cluster shows impressive strong gravitational lensing features (Hennawi et al. 2008) which allowed to reconstruct its internal mass profile. For instance, Limousin et al. (2008), based on imaging data both from space (HST) and ground (Subaru), identified 13 systems forming highly-magnified images. Thanks to spectroscopic (from Keck) and photometric redshifts of these images they found that all the lensing systems can be reproduced by a single NFW (Navarro et al. 1997) profile for the dark matter, thus suggesting that A1703 is a regular, unimodal cluster. A follow-up study by Richard et al. (2009) based on further Keck spectroscopic measurements for seven multiple sources reinforced the evidence that A1703 is a relaxed cluster. More studies based on strong and/or weak gravitational lensing analysis also provided estimates of the cluster mass and the NFW concentration parameter. Even though the results are quite discordant, they all coincide that A1703 is a massive system: and (Oguri et al. 2009, Zitrin et al. 2010, Oguri et al. 2012).
Such a large mass is also consistent with estimates derived from Planck observations of the thermal Sunyaev-Zeldovich effect. In fact, based on measurements of the Compton parameter and the scaling relation of Arnaud et al. (2010), the Planck Collaboration (2016) reports an hydrostatic mass , which corresponds to assuming a NFW profile for the mass distribution.
As for the X-ray band, Piffaretti et al. (2011) report a measurement of the X-ray luminosity of A1703 from ROSAT data: Mpc) erg s-1 in the 0.1-2.4 keV band. Using eq. 10 of Böhringer et al. (2014), this luminosity translates to a mass estimate (in our cosmology, see below), again indicative of a massive cluster. Very recently, Ge et al. (2019) used unpublished Chandra archival data to compute the temperature of the ICM within 0.15-0.75 : keV. These data show that the ICM is elongated in the SSE-NNW direction (see contours in Fig. 1). However, despite the absence of obvious bimodality or more complex substructure, Ge et al. (2019) also report hints of a disturbed dynamics according to the measurements of several X-ray morphological parameters (see their Table 5) and their locations in the morphological planes of Cassano et al. (2010) and Mantz et al. (2015).
Taking into account the scenarios described by studies based on gravitational lensing and X-ray data, it is important to definitively establish whether A1703 is an anomalous relaxed cluster hosting diffuse radio emission or a common merging system. An exhaustive analysis of the kinematics of the cluster galaxy population could have the last word on the true dynamical status of this cluster. Moreover, this analysis would allow to study the possible presence of a merger along the line of sight, which would be difficult if not impossible to detect in the X-ray band. In fact, the spatial and kinematical study of member galaxies represent an effective tool to reveal substructures in clusters and put in evidence pre-merging subgroups or merger remnants (e.g. Boschin et al. 2004; Boschin et al. 2013).
With this context in mind, we used archival spectroscopic data obtained at the Italian Telescopio Nazionale Galileo (TNG) in order to perform the first dynamical analysis of this cluster based on member galaxies. These data sample the central 1 Mpc size region of the cluster characterized by the diffuse X-ray and radio emissions. More data found in the NED Database, most of which obtained by Bayliss et al. (2014; hereafter B14) through spectroscopic measurements with MMT/Hectospec, allowed us to extend our spectroscopic sample to cover a wider area around the cluster (see Fig. 2).
This paper is organized as follows. Sect. 2 describes the TNG observations and data reduction and presents the velocity catalogue. In Sect. 3 we describe our member selection procedure. Sect. 4 and 5 explain the results of the analysis of the cluster structure. Finally, in Sect. 6, we discuss our results and present a portrait of the dynamical status of A1703.
Unless otherwise stated, we indicate errors at the 68% confidence level (hereafter c.l.). Throughout this paper, we use km s-1 Mpc-1 in a flat cosmology with and . In the adopted cosmology, 1corresponds to kpc at the cluster redshift.
2 Galaxy data and velocity catalogue
We used unpublished spectroscopic data stored in the TNG archive (http://archives.ia2.inaf.it/tng) taken in May 2010 (program A21TAC_50; PI: F. Gastaldello). These data consist of five MOS masks mainly sampling the central region of the cluster. Another mask was taken in June 2016 during a technical night. In particular, this last mask allowed to obtain the spectrum of the BCG. For all the six masks we used the LR-B Grism of the instrument DOLoRes111http://www.tng.iac.es/instruments/lrs and obtained spectra for 131 objects. The total exposure times varied from 3600s to 7200s.
We used standard IRAF tasks to reduce the spectra and adopted the cross-correlation technique (Tonry & Davis 1979) to compute redshifts for 104 targets. For 18 galaxies we obtained multiple redshift determinations. They allowed us to obtain a better estimate for the redshift errors. In particular, we found that the nominal cross-correlation errors are underestimated and multiplied them by a factor 2.5 (see Girardi et al. 2011 for details of the redshift computation and their errors). For another five galaxies (IDs. 117, 152, 154, 162 and 180; see Table 1), their redshifts were computed by measuring the wavelengths of the emission lines in their spectra.
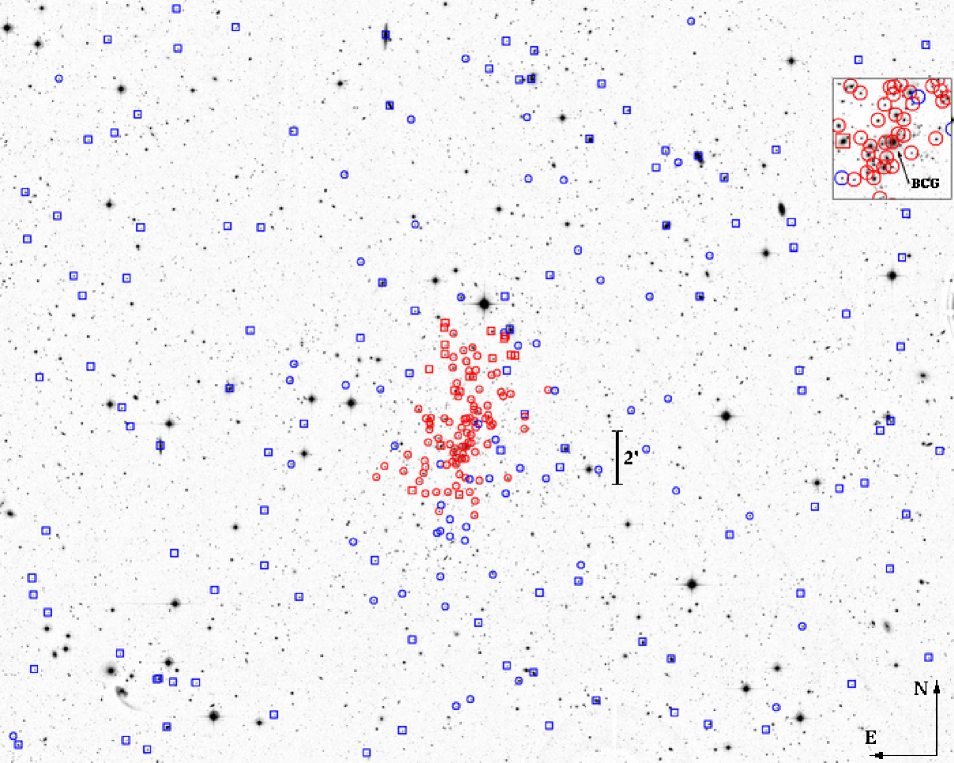
In order to extend our spectroscopic sample to the outskirts of the cluster, we searched the NED database for galaxies with known redshift in the field of A1703. We found 184 objects within a radius of 20from the cluster centre. Most of these objects (177) come from B14, ten of which are in common with our TNG data. To check for eventual systematic deviations, we performed a straight-line fit to the TNG and B14 redshift measurements taking into account the errors on both data sets (see Chapter 15.3 of Press et al. 2007). We find an intercept= and a slope=1.010.03 with a probability=0.52. Thus, we added the remaining 167 B14 galaxies and seven NED galaxies to our sample.
Our final spectroscopic catalogue includes 278 galaxies. The field of A1703 is covered by the SDSS. Its galaxy catalogue also provides us complete photometric information for all the galaxies of the spectroscopic sample in the magnitude bands , , and .
Table 1 lists the velocity catalogue (see also Fig. 2): identification number of each galaxy, ID (Col. 1); redshift source (Col. 2; T:TNG, L:NED, B:B14); right ascension and declination, and (J2000, Col. 3); (dereddened) SDSS magnitude (Col. 4); heliocentric radial velocities, (Col. 5) with errors, (Col. 6).
2.1 Notable galaxies
A1703 is dominated by the galaxy ID 141 (the BCG). It is by far the brightest cluster member, being the magnitude difference with the second brightest member galaxy 1.3. Its colours ( and ) well match the red sequences of cluster early-type galaxies (see our analysis of Sect. 5.2.1) and, consistently, its optical spectrum is that of an elliptical galaxy free of emission lines.
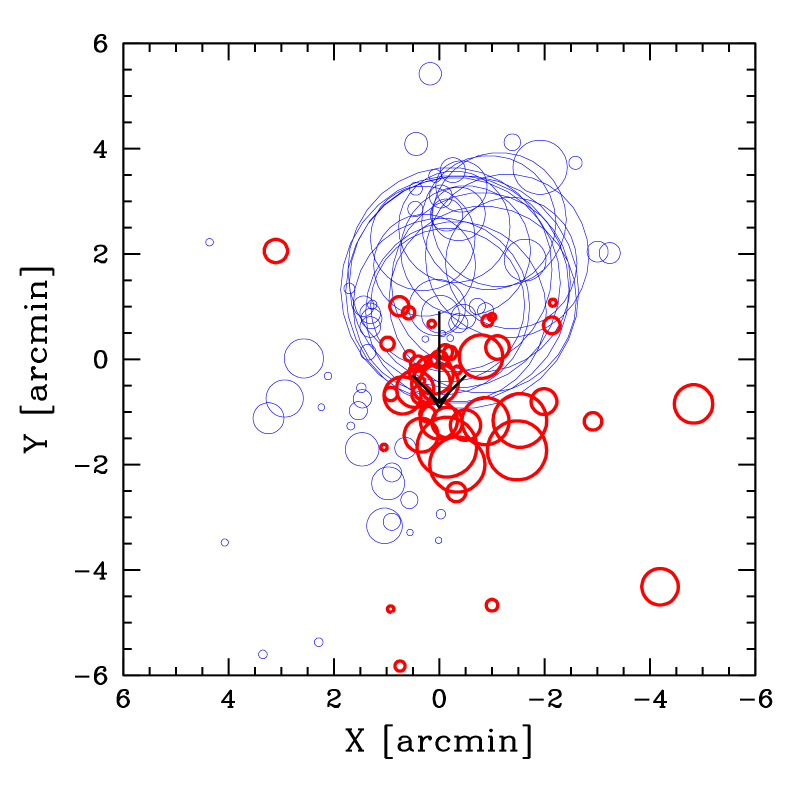
The field of A1703 is populated by several pointlike radio sources. Rizza et al. (2003; see their Table 3) report six sources from high spatial resolution (1.5) VLA images at 20 cm. The counterparts of five of them are the member galaxies IDs. 113, 151, 163, 200 and 202 (see Fig. 1). The sixth one (n. 5 in Table 3 of Rizza et al. 2003), at 5.7SW of the BCG, is not listed in our spectroscopic catalogue. Since its photometric redshift is 0.240.04 (from the SDSS), it is unclear whether it is a cluster member or a foreground object. Finally, at 5NNW of the BCG there is another strong radio source whose possible optical counterpart (highlighted by a black arrow on the top of Fig. 1) is also visible in the X-ray Chandra Image. Due to its faint magnitude (23 from CFHT/Megaprime archival data) we argue that this object is a background AGN.
3 Removal of nonmembers
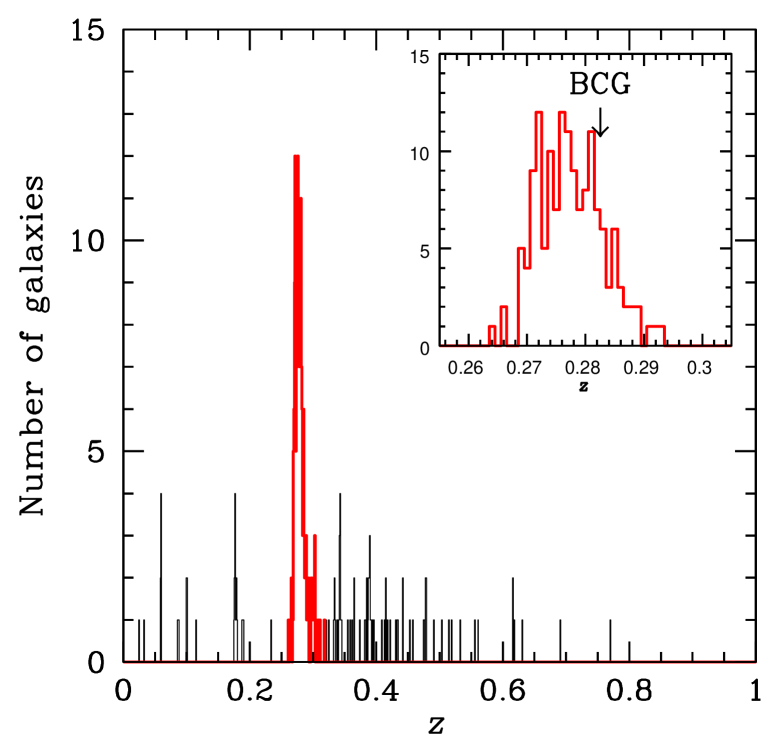
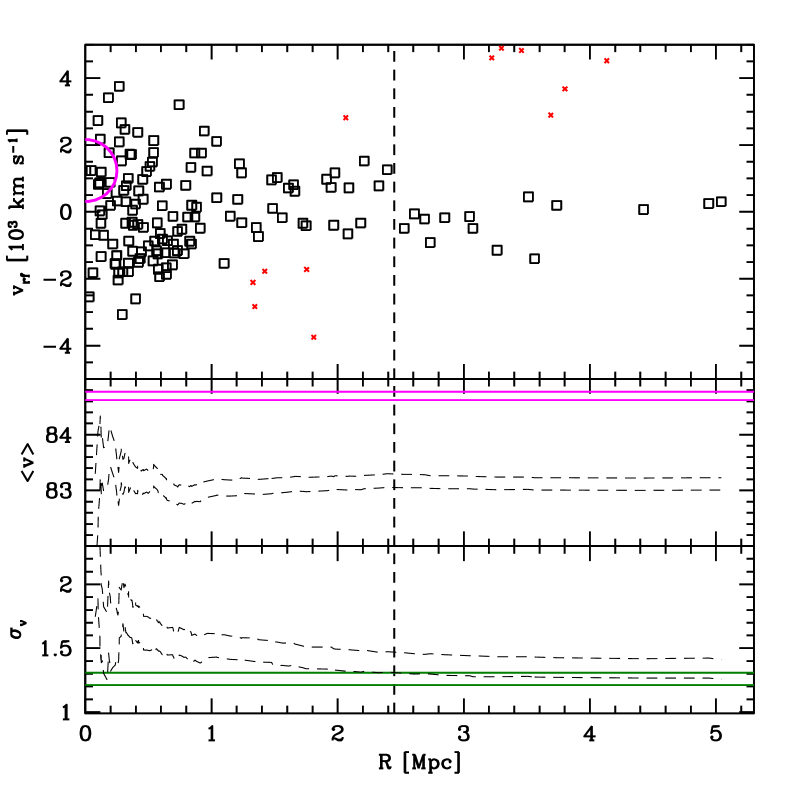
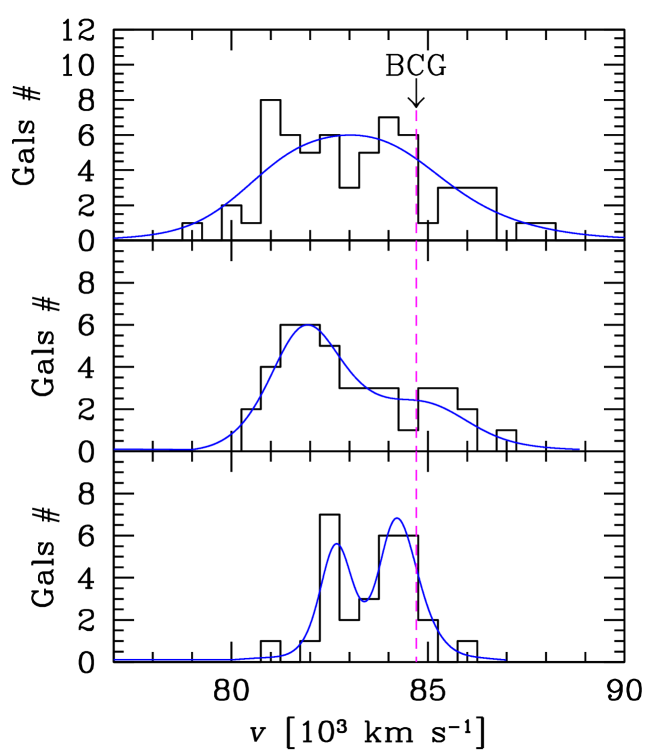
The removal of nonmember galaxies was performed by using the two-step method called “P+G” (see, e.g. Biviano et al. 2013), which combines the 1D adaptive-kernel method DEDICA (1D-DEDICA; Pisani 1993) and the “shifting gapper” method (Fadda 1996). For the centre of A1703 we adopted the position of the BCG (RA=, Dec.=, see Table 1). The 1D-DEDICA method detected A1703 as a peak in the velocity space populated by 170 galaxies (see Fig. 3). Then, we rejected 23 galaxies from this provisional list of cluster members by using the “shifting gapper”, which combines the spatial and velocity information. The final sample contains 147 member galaxies (87 of which observed at the TNG), whose projected phase space is shown in Fig. 4.
4 Global Properties of the velocity distribution
The biweight routines by Beers et al. (1990) provide robust estimates of the first moments of the velocity distribution. Our measurement of the mean velocity is km s(or ). The global line-of-sight (LOS) velocity dispersion is km s-1. Based on the - relation of Munari et al. (2013), inferred from -cold dark matter cosmological -body and hydrodynamical simulations, we estimate a total cluster mass of within Mpc.
5 Cluster substructure
5.1 1D analysis of the velocity distribution
The 1D analysis refers to the study of the higher moments of the velocity distribution of member galaxies (Fig. 3). In particular, we find some evidence of deviation from Gaussianity according to the moments skewness and kurtosis (% and % c.l., respectively). Moreover, there is also marginal evidence of asymmetry according to the asymmetry index (% c.l.; see Bird & Beers 1993 for details).
Very interestingly, the BCG has a significant ( c.l.) peculiar velocity relative to the cluster mean velocity according to the Indicator test by Gebhardt & Beers (1991). In particular, the absolute -normalized BCG peculiar velocity is . This value puts the BCG of A1703 in the far tail of the exponential distribution found by Lauer et al. (2014) studying a sample of 433 BCGs.
We then used the 1D-Kaye Mixture Model method (1D-KMM; Ashman et al. 1994). This test quantifies the statistical significance of bimodality (or more complex structure) in the velocity distribution with respect to a single Gaussian fit. The results are negative, i.e. there is no significant evidence of a two- or three-Gaussian partition. However, if we consider the velocity histograms obtained selecting member galaxies at different (projected) clustercentric distances (see Fig. 5) we unveil a more complex reality. In fact, while in the centre of the cluster (0.5 Mpc) the velocity distribution is fitted by 1D-DEDICA with a single peak curve, at larger clustercentric distances signs of bimodality appear in the form of a fitted asymmetric curve. Then, for Mpc (), the velocity distribution is clearly described by a two-peak curve. The significance of the two peaks, at 82700 and 84200 km s-1, is 99.4% c.l. according to 1D-DEDICA.
5.2 2D analysis of the galaxy distribution
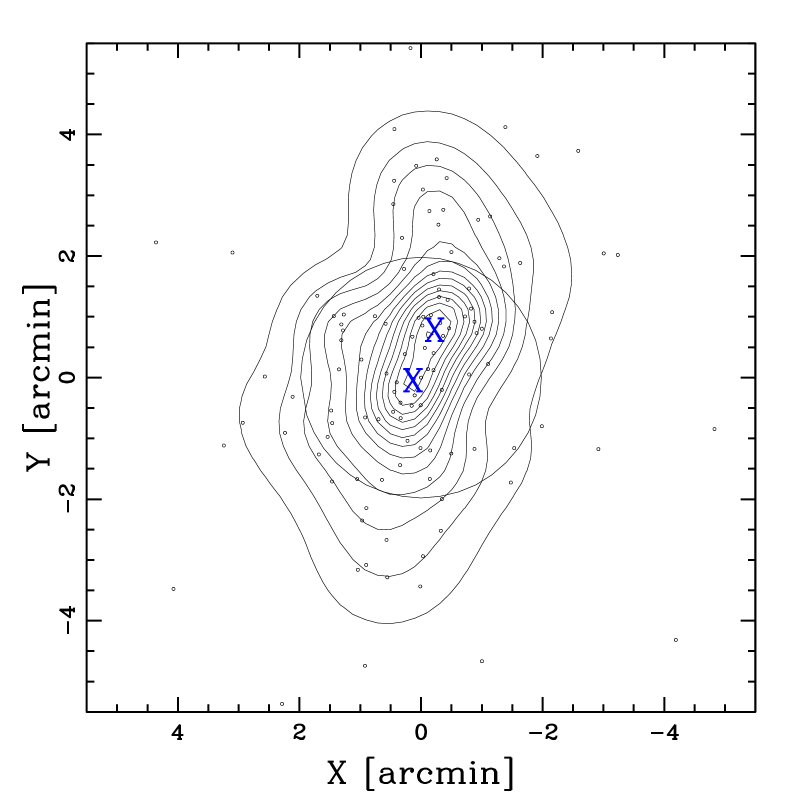
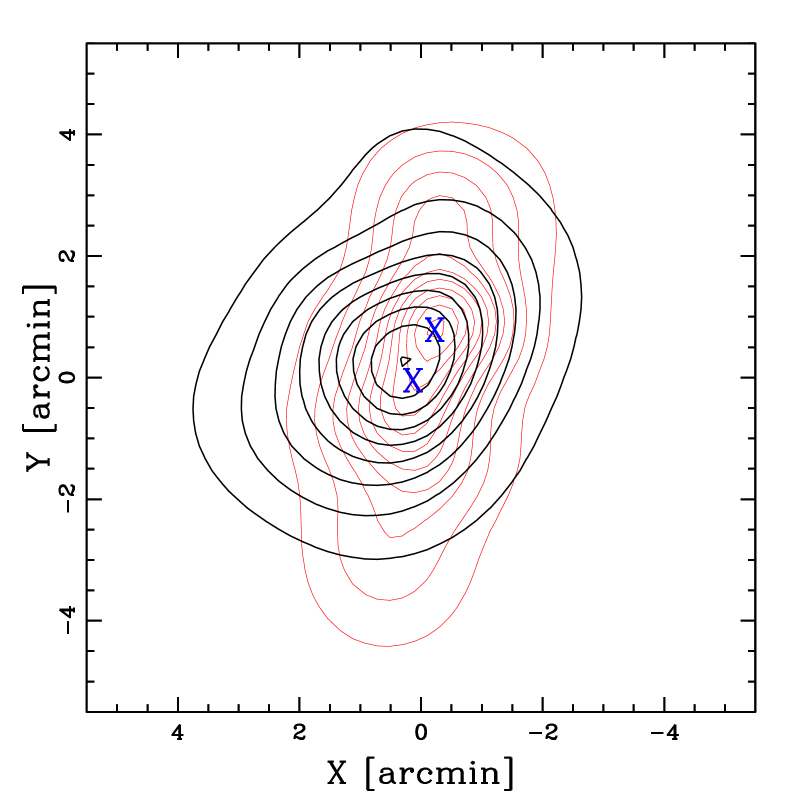
About the analysis of the 2D spatial distribution of the spectroscopic member galaxies, we employed the 2D adaptive-kernel method of Pisani et al. (1996, hereafter 2D-DEDICA). The results are shown in Fig. 6. The cluster is elongated along the SSE-NNW direction, in a similar way to the X-ray isophotes (see Fig. 1). Moreover, this test detects two dense galaxy peaks separated by only 1′. The peak ’S’ (see Table 2) is located close to the BCG (at 8ESE), the peak ’N’ is found at 9SE of the galaxy ID 120. The eventual presence of luminosity segregation in a galaxy cluster can be a sign of disturbed dynamics (e.g. Maurogordato et al. 2011; see the discussion in Sect. 6). This motivates the exploration of the 2D galaxy distribution in different magnitude ranges. Very interestingly, running 2D-DEDICA only on the bright spectroscopic members () the result is completely different with respect to the analysis of the whole spectroscopic sample: the two peaks and the elongation disappear. The distribution of bright members is now much more circular (see Fig. 7) with a centre close to the BCG and to the peak ’S’. Moreover, the distribution of faint spectroscopic members shows a peak in correspondence of the peak ’N’.
5.2.1 Analysis of the photometric sample
We are aware that the spectroscopic sample suffers from magnitude incompleteness. This is caused by constraints in the production process of the TNG MOS masks and the positioning of Hectospec fibers for the galaxies observed by B14.
The SDSS photometry of the cluster field is deep enough to help us alleviate our incompleteness problems. In particular, we select likely members on the basis of both ( vs. ) and ( vs. ) colour-magnitude relations (hereafter CMRs). The CMRs allow us to identify the cluster “red” early-type galaxies (i.e., the dominant cluster population, Dressler 1980) and to reduce the contamination by nonmember galaxies. We determine the CMRs by applying the 2-clipping fitting procedure to the cluster members and obtain –=1.255-0.037 and –=2.365-0.045 (see Fig. 8). Then, within the photometric catalogue we consider as likely “red” cluster members the galaxies with colour indexes – and – within 0.1 mag and 0.15 mag (i.e. the 1-error associated to the fitted intercept) of the respective CMRs.
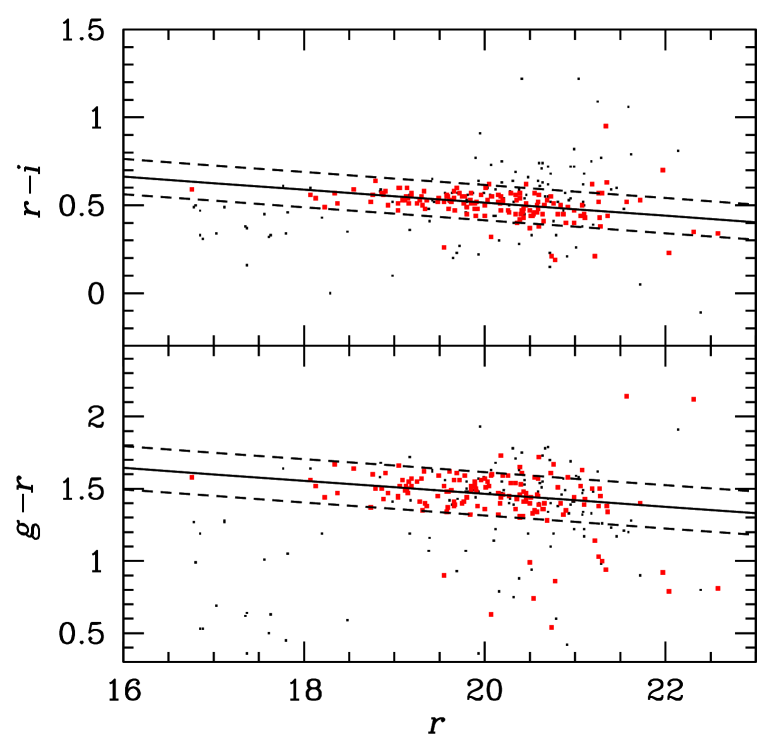
Fig. 9 shows the contour map of the likely cluster members according to 2D-DEDICA. Again, we find that the distribution of bright galaxies () shows just one peak and is only mildly elongated. Only if we consider fainter members (galaxies with ) we recover the SSE-NNW elongation with a maximum galaxy density close to the ’N’ peak of Table 2.
This luminosity segregation is not a unique feature of A1703. In Sect. 6 we discuss this result in more detail.
5.3 3D analysis: combining velocity and position information
As for the 3D analysis, we employed different tools to search for a correlation between velocity and position information, which would be a clear sign of real substructures in the cluster.
First, we searched for an eventual velocity gradient by performing a multiple linear regression fit to the cluster velocity field (den Hartog & Katgert 1996). We find marginal evidence (at the 92% c.l.) of a velocity gradient with PA= degrees in the sample of the 147 spectroscopic cluster members. In particular, the southern region is populated by higher velocity galaxies.
Then, over the same sample we apply the classical -test (Dressler & Schectman 1988, hereafter DS-test), which quantifies substructure searching for subsystems whose mean velocities and/or dispersions deviate from the global cluster values. Very significant substructure (at % c.l., checked by running a Monte Carlo shuffling of the galaxy velocities; Dressler & Schectman 1988) is found in A1703 both with the “canonical” DS-test and its modified version, which consider only the local mean velocity as kinematical indicator (see also, e.g., Girardi et al. 2010 for more details). Again, high velocity galaxies tend to populate the southern region of the cluster.
Later, we resorted to the “hierarchical tree” (Htree) algorithm developed by Serna & Gerbal (1996; see also Adami et al. 2018 and Girardi et al. 2019 for recent applications). We apply it to the catalogue of 147 member galaxies. The method computes the relative binding energies of cluster galaxies and performs a hierarchical clustering analysis to detect galaxy subsystems.
The results of the Htree test are convincing: the cluster hosts two main substructures. In the centre of the dendrogram of Fig. 11 we find the group G2. It contains 35 galaxies and, in particular, the BCG. On the right the group G1 is the most prominent structure. It contains 47 galaxies and is itself substructured in two groups, G12 (12 galaxies) and G11 (21 galaxies). We run the Htree test by assuming a constant value of =150 for the mass-to-light ratio of galaxies, but the results are quite robust against the adopted value of .
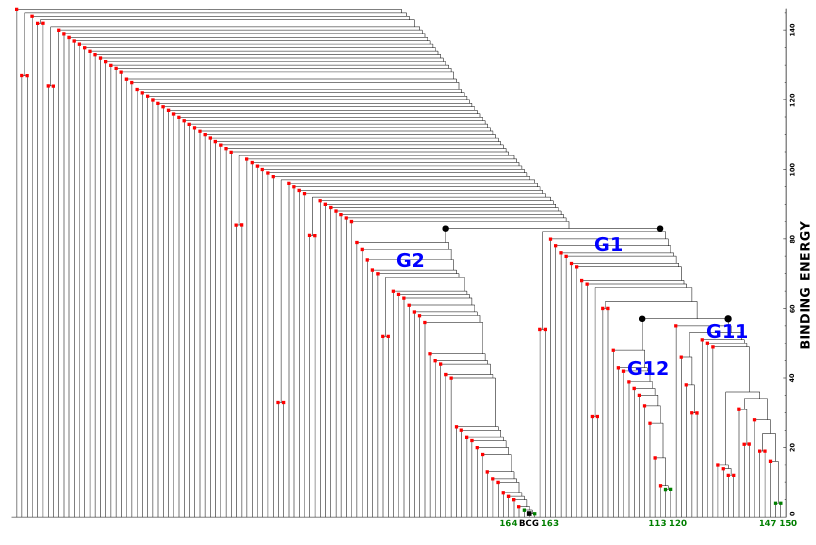
In Table 3 we report the properties of the subclumps found with the Htree method.
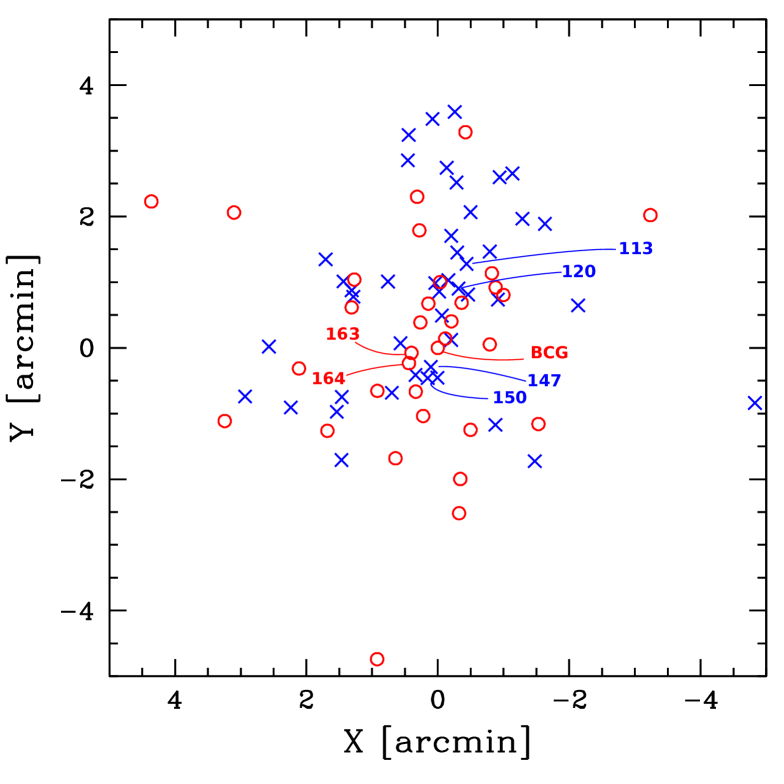
In Fig. 12 we show the positions of the galaxies belonging to the groups G1 and G2. G1 galaxies have lower velocities and populate mainly the northern region of the cluster.
Note that the velocity dispersions of the groups of Table 3 are probably underestimated, since they do not include all the galaxies of the cluster and could just be the cores of more massive structures. To overcome this point we used the 3D version of the KMM test (3D-KMM). In particular, we used the galaxy assignments of the groups G1 and G2 as a first guess when fitting two groups. The algorithm fits a two groups partition at the 98.4% c.l. The results for the two groups are reported in Table 4. Based on the estimates of the velocity dispersions of the two groups, we find from Munari et al. (2013): Mpc and for KMM3D1, Mpc and for KMM3D2. Therefore, the total mass would be .
Finally, the substructure found by the Htree test is confirmed by the analysis performed with the three dimensional adaptive-kernel method of Pisani (1993, 1996; 3D-DEDICA). The results are reported in Table 5, where the three groups DED3D1, DED3D2 and DED3D3 correspond to the groups G2, G12, and G11 detected by the Htree method.
6 Discussion and conclusions
The value of the global velocity dispersion km s(in agreement with the estimate of B14) is typical of a massive cluster and is consistent with the X-ray temperature keV measured by Ge et al. (2019) under the assumption of energy density equipartition between galaxies and ICM. In fact, we find .
A value of is not anomalous for a dynamically relaxed cluster as A1703 was thought to be until very recently. However, we find convincing evidence that this cluster is experiencing a merger of two or more subclumps. The first hint of a disturbed dynamics comes from the 1D analysis of the galaxy velocity distribution. Even if its statistical moments suggest only marginal evidence of deviation from the Gaussianity, the velocity distributions of member galaxies at various clustercentric distances (see Sect. 5.1 and Fig. 5) point out the possible existence of two galaxy populations with different mean velocities (separated by km s-1) but well mixed in the central ( Mpc) region of the cluster. However, the most compelling argument in favour of an ongoing merger in A1703 comes from the very significant peculiar velocity of the BCG (e.g. Martel et al. 2014). This is in sharp contrast with what is usually found in regular clusters, where the dominant galaxy is well placed at the peak of the global velocity distribution (as in the case, e.g., of CL1821+643; Boschin et al. 2018).
About the 2D analysis of the galaxy distribution, the 2D-DEDICA method applied on the whole set of 147 member galaxies shows that the cluster is elongated in the SSE-NNW direction (Fig. 6) with two closely spaced peaks (see Table 2), another sign that at least two subclumps are in the process of merging. Indeed, if we consider only bright members with , their spatial distribution is much more circular and exhibits only one peak close to the BCG and the peak ’S’. We remark that this luminosity segregation is confirmed also by the 2D analysis of the photometric members distribution, thus it does not seem an artifact of the incompleteness of the spectroscopic sample. Moreover, note that the peak ’N’ and the density peak observed in the distribution of faint member galaxies (Figs. 7 and 9) coincide with a secondary mass peak detected by Zitrin et al. (2010, see their Fig. 7) from their lensing analysis. Such a spatial segregation between more and less luminous galaxies was found, for instance, in the Coma cluster (Biviano et al. 1996) and, in particular, in the merging cluster Abell 209 (Mercurio et al. 2003a), where bright photometric members are located around the dominant galaxy, while fainter galaxies seem to trace the whole cluster structure in agreement with the X-ray cluster morphology. As in the case of Abell 209 (see also Mercurio et al. 2003b), the segregation observed in A1703 could be interpreted as the result of a merging process caught after the core-core passage, where luminous galaxies trace the remnants of a pre-merging clump hosting the BCG.
Finally, the combined analysis of the velocity and spatial information provides the ultimate evidence of subclustering in A1703. In particular, the classical DS-test detects very significant substructure, with high velocity galaxies mostly located south of the BCG (Fig. 10). The Htree-test makes it possible to identify two main subclusters: G1 and G2 (Fig. 12 and Table 3). G2 hosts the BCG and is populated by high velocity galaxies. G1 exhibits a lower mean velocity and is itself substructured in two subgroups: G11 and G12. G12, in particular, hosts in the bottom of its potential well the galaxy ID 120, placed very close to the ’N’ peak (Table 2). Comfortingly, the existence of G11, G12 and G2 is independently confirmed also by the 3D version of the adaptive kernel technique (see Table 5). The spatial distribution of G1 and G2 galaxies (see Fig. 12) explains the (marginal) evidence of a velocity gradient (Sect. 5.3) in the direction North-South and is in agreement with the results of the DS-test.
Using the galaxies assigned to G1 and G2 as a first guess when fitting a two groups partition, the 3D-KMM test divides the spectroscopic sample in two subclumps (Table 4). Based on their velocity dispersions we estimate a total mass which should be interpreted as a lower limit for the mass of the cluster, being the upper limit derived from the measurement of the global velocity dispersion (Sect. 4).
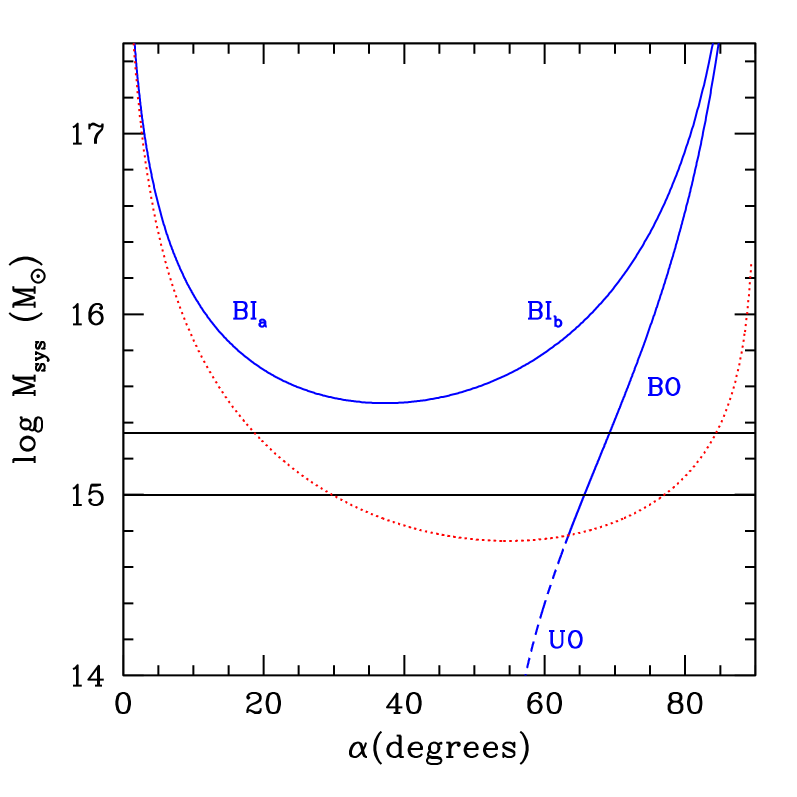
Now, we can adopt the above estimates for the mass of A1703 to study in more detail the merger of the two main subclusters G1 and G2. In particular, we use an analytical two-body model (see, e.g., Lubin et al. 1998 for the details of the method) which is based on the following parameters: , the total mass of the system, , the projected distance between G1 and G2, and , the relative LOS velocity (in the rest frame). From the biweight estimate of the centres of G1 and G2 we assume Mpc, while their relative velocity is km s-1. If we also assume that we are seeing the two subclusters at Gyr after the core crossing, which is a typical time suggested by the presence of the suspected radio halo in A1703 (e.g., Brunetti et al. 2009), we can plot a versus (the projection angle between the plane of the sky and the vector defined by the centres of G1 and G2) graph for three types of solutions: Bound outgoing (expanding) solutions (BO), bound incoming (collapsing) solutions (BI), and unbound outgoing solutions (UO). The results are reported in Fig. 13. The only acceptable solutions in the estimated range of mass of A1703 are BO solutions with degrees, i.e. we are seeing a merger quite close to the LOS. This is consistent with the hypothesis that the possible extended radio emission observed in the centre of the cluster is a radio halo. In fact, an eventual central radio relic produced by a shock wave propagating along the LOS is a rare event, being a relic preferentially observed in mergers occurring near the plane of the sky and in the outermost regions of a cluster (e.g. Vazza et al. 2012, Golovich et al. 2019).
In conclusion, the observational scenario suggests that A1703 is a massive cluster undergoing strong dynamical evolution, with two or three subclusters involved in a merging process. This evidence arises despite the cluster appears only slightly elongated in the X-rays, but this is not unusual. Indeed, a non-relaxed state is observed in 70% of clusters at even in the presence in some cases of a regular shape in the X-ray imaging data (Smith et al. 2005). Thus, our results are in agreement with the disturbed dynamics found by Ge et al. (2019) through the study of several X-ray morphological indicators.
In this merging context, the possible presence of a radio halo in the central regions of the cluster would not be surprising, thus we rule out the hypothesis that A1703 could constitute a new intriguing case of a rare relaxed cluster hosting diffuse radio emission.
Finally, our results are in marked contrast with respect to the picture of an unimodal, dynamically relaxed cluster painted by previous studies based on gravitational lensing (see Sect. 1). Since cluster mass profiles inferred from gravitational lensing suffer from complicated lens geometry (see Narayan & Bartelmann 1996 for a general review), if A1703 were a rare relaxed cluster at intermediate redshift it would be of great value to test structure formation in the CDM paradigm through the study of its regular mass distribution. On the contrary, the subclustering we find in A1703 seems to rule out this possibility.
Acknowledgements
We thank the anonymous referee for his/her stimulating comments and suggestions.
We are in debt with Federica Govoni for the VLA radio image she kindly provided us. We also thank Luigina Feretti for useful suggestions and discussions.
M.G. acknowledges financial support from the grant MIUR PRIN 2015 “Cosmology and Fundamental Physics: illuminating the Dark Universe with Euclid” and from the University of Trieste through the program “Finanziamento di Ateneo per progetti di ricerca scientifica - FRA 2018”.
This publication is based on observations made on the island of La Palma with the Italian Telescopio Nazionale Galileo, which is operated by the Fundación Galileo Galilei-INAF (Istituto Nazionale di Astrofisica) and is located in the Spanish Observatorio of the Roque de Los Muchachos of the Instituto de Astrofísica de Canarias.
This research has also benefited from the galaxy catalogue of the Sloan Digital Sky Survey (SDSS). The SDSS web site is http://www.sdss.org/, where the list of the funding organizations and collaborating institutions can be found.
This research has made use of the NASA/IPAC Extragalactic Database (NED), which is operated by the Jet Propulsion Laboratory, California Institute of Technology, under contract with the National Aeronautics and Space Administration.
This research has also made use of IRAF. This package (ASCL code record 9911.002) is distributed by the National Optical Astronomy Observatory, which is operated by the Association of Universities for Research in Astronomy (AURA) under a cooperative agreement with the National Science Foundation.
References
- Abell (1958) Abell G. O., 1958, ApJS, 3, 211
- Abell et al. (1989) Abell G. O., Corwin Jr. H. G., Olowin R. P., 1989, ApJS, 70, 1
- Adami et al. (2018) Adami C., Giles P., Koulouridis E, et al., 2018, A&A, 620, A5
- Allen et al. (1992) Allen S. W., Edge A. C., Fabian A. C., et al., 1992, MNRAS, 259, 67
- Arnoud et al. (2010) Arnoud M., Pratt G. W., Piffaretti R., et al., 2010, A&A, 517, A92
- Ashman et al. (1994) Ashman K. M., Bird C. M., Zepf S. E., 1994, AJ, 108, 2348
- Bayliss et al. (2014) Bayliss M. B., Johnson T., Gladders M. D., Sharon K., Oguri M., 2014, ApJ, 783, 41 (B14)
- Beers et al. (1982) Beers T. C., Geller M. J., Huchra J. P., 1982, ApJ, 257, 23
- Beers et al. (1990) Beers T. C., Flynn K., Gebhardt K., 1990, AJ, 100, 32
- Bird & Beers (1993) Bird C. M., Beers, T. C., 1993, AJ, 105, 1596
- Bonafede et al. (2014) Bonafede A., Intema H. T., Brüggen M., et al., 2014, MNRAS, 444, L44
- Bohringer et al. (2014) Böhringer H., Chon G., Collins C. A., 2014, A&A, 570, A31
- Biviano et al. (1996) Biviano A., Durret F.; Gerbal D., et al., 1996, A&A, 311, 95
- Biviano et al. (2013) Biviano A., Rosati P., Balestra I., et al., 2013, A&A, 558, A1
- Boschin & Girardi (2018) Boschin W., Girardi M., 2018, MNRAS, 480, 1187
- Boschin et al. (2004) Boschin W., Girardi M., Barrena R., et al., 2004, A&A, 416, 839
- Boschin et al. (2013) Boschin W., Girardi M., Barrena R., 2013, MNRAS, 434, 772
- Brunetti et al. (2009) Brunetti G., Cassano R., Dolag K., Setti, G., 2009, A&A, 507, 661
- Brunetti & Jones (2015) Brunetti G., Jones T. W., 2015, Magnetic Fields in Diffuse Media, Astrophysics and Space Science Library, Vol. 407, Springer-Verlag Berlin Heidelberg, p. 557
- Cassano et al. (2010) Cassano R., Ettori S., Giacintucci S., et al, 2010, ApJ, 721, L82
- den Hartog & Katgert (1996) den Hartog R., Katgert P., 1996, MNRAS, 279, 349
- Dressler (1980) Dressler A., 1980, ApJ, 236, 351
- Dressler & Schectman (1988) Dressler A., Shectman S. A., 1988, AJ, 95, 985
- Fadda et al. (1996) Fadda D., Girardi M., Giuricin G., at al., 1996, ApJ, 473, 670
- Feretti et al. (2012) Feretti L., Giovannini G., Govoni F., Murgia M., 2012, A&ARv, 20, 54
- Ge et al. (2019) Ge C., Sun M., Rozo E., et al., 2019, MNRAS, 484, 1946
- Gebhardt (1991) Gebhardt K., Beers T. C., 1991, ApJ, 383, 72
- Girardi et al. (2011) Girardi M., Bardelli S., Barrena R., et al., 2011, A&A, 536, A89
- Girardi et al. (2010) Girardi M., Boschin W., Barrena R., 2010, A&A, 517, A65
- Girardi et al. (2019) Girardi M., Boschin W., De Grandi S., et al., 2019, A&A, in press (eprint arXiv:1908.02277)
- Gitti et al. (2018) Gitti M., Brunetti G., Cassano R., Ettori S., 2018, A&A, 617, A11
- Golovich et al. (2019) Golovich N., Dawson W. A., Wittman D. M., et al., 2019, ApJ, 882, 69
- Hennawi et al. (2008) Hennawi J. F., Gladders M. D., Oguri M., et al., 2008, AJ, 135, 664
- Koester et al. (2007) Koester B. P., McKay T. A., Annis J., et al., 2007, ApJ, 660, 239
- Lauer et al. (2014) Lauer T. R., Postman M., Strauss M. A., Graves G. J., Chisari N. E., 2014, ApJ, 797, 82
- Limousin et al. (2008) Limousin M., Richard J., Kneib J.-P., et al., 2008, A&A, 489, 23
- Lubin et al. (1998) Lubin L. M., Postman M., Oke J. B., 1998, AJ, 116, 643
- Mantz et al. (2015) Mantz A. B., Allen S. W., Morris R. G., et al., 2015, MNRAS, 449, 199
- Martel et al. (2014) Martel H., Robichaud F., Barai P., 2014, ApJ, 786, 79
- Maurogordato et al. (2011) Maurogordato S., Sauvageot J. L., Bourdin H., et al., 2011, A&A, 525, A79
- Mercurio et al. (2003a) Mercurio A., Girardi M., Boschin W., Merluzzi P., Busarello G., 2003a, A&A, 397, 431
- Mercurio et al. (2003b) Mercurio A., Massarotti M., Merluzzi P., et al., 2003b, A&A, 408, 57
- Munari et al. (2013) Munari E., Biviano A., Borgani S., Murante G., Fabjan D., 2013, MNRAS, 430, 2638
- Narayan & Bartelmann (1996) Narayan R., Bartelmann M., 1996, arXiv:astro-ph/9606001, lecture presented at the 13th Jerusalem Winter School in Theoretical Physics: Formation of Structure in the Universe, Jerusalem, Israel, 27 Dec 1995 - 5 Jan 1996
- Navarro et al. (1997) Navarro J. F., Frenk C. S., White S. D. M., 1997, ApJ, 490, 493
- Oguri et al. (2012) Oguri M., Bayliss M. B., Dahle H., et al., 2012, MNRAS, 420, 3213
- Oguri et al. (2009) Oguri M., Hennawi J. F., Gladders M. D., et al., 2009, ApJ, 699, 1038
- Owen (1999) Owen F., Morrison G., Voges W., 1999, Diffuse Thermal and Relativistic Plasma in Galaxy Clusters, MPE Report 271, p. 9
- Piffaretti et al. (2011) Piffaretti R., Arnaud M., Pratt G. W., et al., 2011, A&A, 534, A109
- Pisani (1993) Pisani A., 1993, MNRAS, 265, 706
- Pisani (1996) Pisani A., 1996, MNRAS, 278, 697
- Planck Collaboration (2016) Planck Collaboration, 2016, A&A, 594, A27
- Press et al. (2007) Press W. H., Teukolsky S. A., Vetterling W. T., Flannery B. P., 2007, Numerical Recipes. The Art of Scientific Computing, 3rd Edition
- Richard et al. (2009) Richard J., Pei L., Limousin M., Jullo E., Kneib J.-P., 2009, A&A, 498, 37
- Rizza et al. (2003) Rizza E., Morrison G. E., Owen F. N., et al., 2003, AJ, 126, 119
- Sarazin (2002) Sarazin C. L., 2002, Merging Processes in Galaxy Clusters, Astrophysics and Space Science Library, Vol. 272, ed. L. Feretti, I. M. Gioia, & G. Giovannini, pp. 1-38
- Savini et al. (2018a) Savini F., Bonafede A., Brüggen M., et al., 2018a, MNRAS, 478, 2234
- Savini et al. (2018b) Savini F., Bonafede A., Brüggen M., et al., 2018b, MNRAS, 474, 5023
- Serna & Gerbal (1996) Serna A., Gerbal D., 1996, A&A, 309, 65
- Smith et al. (2005) Smith G. P., Kneib J.-P., Smail I., 2005, MNRAS, 359, 417
- Sommer et al. (2017) Sommer M. W., Basu K., Intema H., et al., 2017, MNRAS, 466, 966
- Tonry & Davis (1979) Tonry J., Davis M., 1979, ApJ, 84, 1511
- van Haarlem et al. (2013) van Haarlem M. P., Wise M. W., Gunst A. W., et al., 2013, A&A, 556, A2
- van Weeren et al. (2019) van Weeren R. J., de Gasperin F., Akamatsu H., et al., 2019, Space Sci. Rev., 215, 16
- Vazza et al. (2012) Vazza F., Brüggen M., van Weeren R., et al., 2012, MNRAS, 421, 1868
- Venturi et al. (2017) Venturi T., Rossetti M., Brunetti G., et al., 2017, A&A, 603, A125
- Wilber (2018) Wilber A. G., 2018, PhD Thesys, University of Hamburg, Germany
- Zitrin et al. (2010) Zitrin A., Broadhurst T., Umetsu K., et al., 2010, MNRAS, 408, 1916