Neutron imaging of liquid-liquid systems containing paramagnetic salt solutions
Abstract
The method of neutron imaging was adopted to map the concentration evolution of aqueous paramagnetic Gd(NO3)3 solutions. Magnetic manipulation of the paramagnetic liquid within a miscible nonmagnetic liquid is possible by countering density-difference driven convection. The formation of salt fingers caused by double-diffusive convection in a liquid-liquid system of Gd(NO3)3 and Y(NO3)3 solutions can be prevented by the magnetic field gradient force.
Paramagnetic liquids are created by dissolving salts containing transition-metal or rare-earth ions in a solvent Andres (1976). Magnetic levitation of objects immersed in paramagnetic liquids has been used for magnetohydrostatic separation since the 1960sAndres et al. (1966) and nowadays finds application in biotechnologyTurker and Arslan-Yildiz (2018). Exposing a paramagnetic solution to an inhomogeneous magnetic field gives rise to the magnetic field gradient forceMutschke et al. (2010); Dunne et al. (2011); Dunne and Coey (2012); rem :
| (1) |
This expression relates the force density to the magnetic susceptibility of the solution , the magnetic flux density , and the permeability of free space .
It is possible to trap aqueous paramagnetic salt solutions in the magnetic field gradient of a magnetized iron wireCoey et al. (2009). Convection from these paramagnetic liquid tubes is inhibited by the magnetic field gradient force, although mixing by diffusion still prevails on a long time scale. A magnetic field gradient can also initiate magnetothermal convection in a paramagnetic fluidBraithwaite et al. (1991); Rodrigues et al. (2019).
At present, the possibility of extracting paramagnetic ions from a homogeneous aqueous solution with an inhomogeneous magnetic field is garnering significant research interest Yang et al. (2012); Pulko et al. (2014); Rodrigues et al. (2017); Lei et al. (2017); Franczak et al. (2016); Kołczyk et al. (2016); Kolczyk-Siedlecka et al. (2019). In response to the recent rare-earth crisis, this activity has been spurred by the idea of magnetically separating rare-earth ions, which was originally explored by Noddack et al. in the 1950s Noddack and Wicht (1952, 1955); Noddack et al. (1958). Recent studies used Mach-Zehnder interferometers to relate changes in the refractive index to an enrichment of magnetic ions underneath a permanent magnetYang et al. (2012); Pulko et al. (2014); Rodrigues et al. (2017); Lei et al. (2017). The two most recent of these showed that the observed magnetic enrichment is evaporation-assistedRodrigues et al. (2017); Lei et al. (2017). According to Lei et al. Lei et al. (2017), the heightened ion concentration (% bulk concentration) in the evaporation layer is maintained by the magnetic field gradient. This results in a modest long-lived paramagnetic ion enrichment underneath the magnet. The magnetic field gradient force pales in comparison with the force governing diffusion and is unable to appreciably influence the motion of individual ions on these grounds (; : gas constant, : room temperature, and : concentration gradient)Rodrigues et al. (2019).
In this study, we use neutron imaging to track the concentration distribution of aqueous paramagnetic gadolinium(III) nitrate (Gd(NO3)3 ) solutions in a liquid-liquid system with a miscible nonmagnetic counterpart. This direct method consists of measuring the attenuation of a white neutron beam on passing through a sample and has potential for applications in a variety of fieldsKardjilov et al. (2011); Perfect et al. (2014); Burca et al. (2018). Neutrons interact with the nuclei of the sample, which makes the measurement element-specific, allowing the direct study of liquids that are both miscible and visually indistinguishable under normal conditions. Gd is the element with the highest neutron absorption cross section ( barn for thermal neutronsn_TOF Collaboration et al. (2019)). In addition, Gd3+ possesses a large magnetic moment of 7 by virtue of unpaired 4f electrons. Consequently, solutions of Gd(NO3)3 are ideal candidates for neutron imaging of paramagnetic solutions, enabling the direct observation of their response to magnetic fields. Recent advances in detector systems have provided the means for neutron imaging with both high spatial and temporal resolutions Brenizer (2013); Trtik et al. (2016); Zboray and Trtik (2019). Here, we monitor the interplay of convection, magnetic field gradient force, and diffusion by variations in the neutron transmission profile.
Neutron imaging experiments were carried out at the IMAGINE stationOtt et al. (2015) located in the neutron guide hall of the Orphée reactor at the Laboratoire Léon Brillouin just before its final shutdown. The spectrum of the white neutron beam contained cold neutrons ( = 2-20 Å), which emerged from a 10 mm pinhole and travelled 2.5 m to the detector where the neutron flux was . The detection system consisted of a 50 µm thick 6LiF/ZnS scintillator, with a resolution of 18 µm/pixel, coupled to an sCMOS camera. Recorded images of 25602160 pixels correspond to a field of view of mm2. All images shown here were obtained with an acquisition time of 60 s. The spatial resolution is on the order of 50 µm.
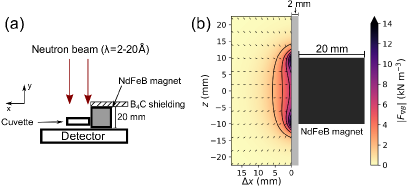
Quartz cuvettes with path lengths of 1 mm were filled with the liquid solutions and placed 5 mm in front of the detector (see sketch in Fig. 1(a)). The outside dimensions of the cuvettes were 40 mm 23.6 mm 3.5 mm (height width depth). Incoherent scattering by water molecules ( barn) was minimized by dissolving salts in D2O ( barn). For maximum contrast, the analyzed paramagnetic salt solutions were restricted to colorless and transparent Gd(NO3)3 solutions. The neutron absorption cross section of Gd dwarfs the scattering cross section of D2O ( barn). Thus, effects of parasitic scattering on the final signal are expected to be weak and it is unnecessary to employ a scattering correction algorithmKardjilov et al. (2005). For the study of magnetic effects, a cube-shaped Nd-Fe-B permanent magnet of side length 20 mm was placed adjacent to the cuvettes (2 mm from the solution within) and shielded from the neutron beam with a boron carbide sheet. The horizontal magnetic field was T at the surface of the magnet and T at a distance of 5 mm.
An empty beam was recorded during each measurement session. This was necessary for normalization to the intensity of the white beam . Furthermore, the electronic noise was subtracted from the image to obtain the transmittance:
| (2) |
The final step of the image processing was the removal of noisy pixels by using an outlier filter.
The Beer-Lambert law describes the attenuation of the neutron beam by the Gd3+ ions in D2O:
| (3) |
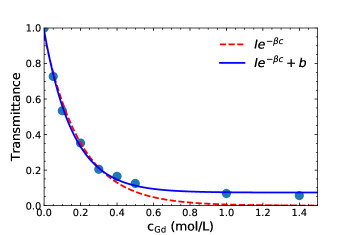
with the molar neutron absorption coefficient , the Gd3+ concentration and the sample thickness . Strictly speaking, depends on the neutron energy and the assumption of a single value for a polychromatic neutron beam is a simplification. This approximation is not a concern, considering the fact that the neutron wavelengths constituting the beam (2-20 Å) lie within one order of magnitude of each other. A calibration of the transmitted intensity to the Gd3+ concentration was performed by recording images of solutions in 1 mm path length cuvettes (see Fig. 2). The attenuation follows the Beer-Lambert law up to a concentration of about 0.4 M, when the beam is almost completely absorbed and the transmitted intensity originates predominately from incoherent scattering. An offset exponential fit with an extra variable () captures the behavior, but quantitative statements cannot be readily made at concentrations higher than 0.5 M. The latest development of black body correctionBoillat et al. (2018); Carminati et al. (2019) opens the possibility to quantify the contribution of background and sample scattering to the transmittance, but it would require a black body grid.
The magnetic susceptibility of a 1 M Gd(NO3)3 heavy water solution () is the sum of the diamagnetic D2O contribution () and the paramagnetic Curie-law contribution of the Gd3+ ionsCoey et al. (2009). This value and the magnetic field distribution of the Nd-Fe-B magnet allow the computation of the magnetic field gradient force in the vicinity of the magnet (see Fig. 1(b)). The magnetic field was calculated by approximating the magnet as two uniform sheets of magnetic charge Furlani (2001).
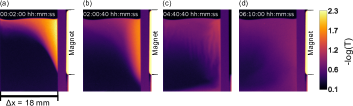
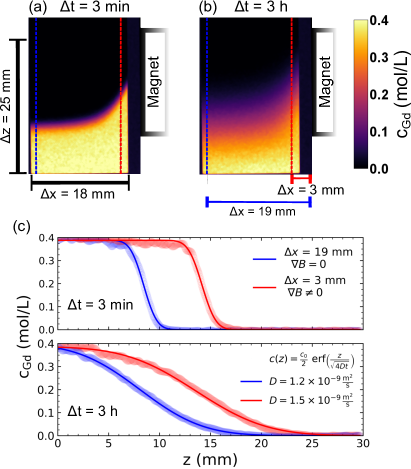
In the case of an inhomogeneous solution comprising a paramagnetic and nonmagnetic component, a magnetic field gradient orthogonal to the concentration gradient alters the equilibrium stateMutschke et al. (2010). The Gd(NO3)3 solution climbs up the side of the cuvette until the balance between buoyancy () and magnetic field gradient forces is re-established. This can be seen in Fig. 3. Here, 100 µL of 0.4 M Gd(NO3)3 solution ()at the bottom of a 1 mm path length cuvette was covered with 400 µL D2O (). A magnet was placed at the side and the diffusion of the Gd(NO3)3 was monitored for 3 h. The magnetic field gradient draws the Gd(NO3)3 solution towards the magnet, although homogenization by diffusion continues in its presence. An estimate for the diffusion coefficient of 0.4 M Gd(NO3)3 in D2O can be obtained from the vertical concentration profile by a fit with the solution of the one-dimensional diffusion equation (see Fig. 3(c)):
| (4) |
with Gd3+ starting concentration . The value of m2s-1 obtained for the nonmagnetized region after 3 h is reasonable for rare-earth ions in waterCussler (2009). However, this value should be treated with caution, as the initial interface was smeared by introducing the liquids into the cuvette before the onset of diffusion. The diffusion coefficient from the fit for the magnetized region is higher at m2s-1, but the one-dimensional expression does not account for horizontal diffusion from the warped concentration profile.
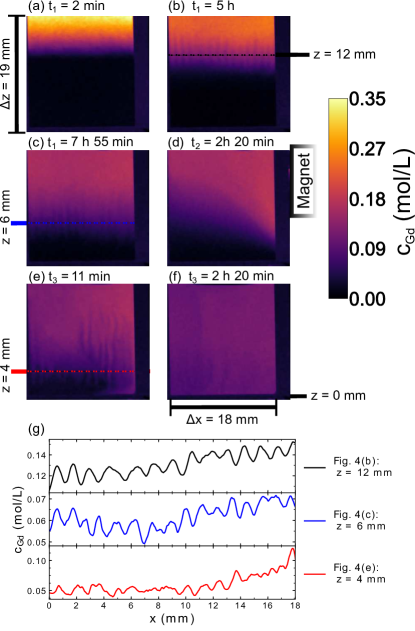
The density difference between the Gd(NO3)3 solution and the nonmagnetic liquid can be adjusted by addition of Yttrium(III) nitrate (Y(NO3)3 ), which is transparent to neutrons ( barnSears (1992)), to the D2O. Decreasing the density difference leads to more vigorous magnetically induced migration and facilitates magnetic confinement. If the density of the Gd solution is higher than that of the Y solution, the removal of the magnet before homogenization has taken place prompts a buoyancy-driven Rayleigh-Taylor instabilityHuang et al. (2007); Tsiklashvili et al. (2012) and the Gd solution plunges to the bottom of the cuvette in a matter of seconds. A different situation arises when the density difference is inverted and the Gd solution floats above the Y solution. To investigate this, 100µL 0.4 M Gd(NO3)3 solution was injected on top of 300 µL 1.3 M Y(NO3)3 solution () in a cuvette (see Fig. 4(a)). After 1 h the system was beset by a salt-fingering instability due to double diffusive convectionTurner and Stommel (1964); Stern and Turner (1969) (see Fig. 4 (b)-(c) and animations for greater visibility). This phenomenon is encountered at the interface of solutions that diffuse into each other at unequal rates. The diffusivity of Y3+ in the 1.3 M solution exceeds that of the Gd in the 0.4 M solution. It follows that Y(NO3)3 will diffuse laterally into small portions of Gd(NO3)3 solution that cross the interface. The increase in density due to the gained Y(NO3)3 makes the Gd(NO3)3 solution plummet in form of 1.2 mm wide fingers (see cross sections in Fig. 4(g)), which continue to leech Y(NO3)3 from their surroundings during their descent. These transport the Gd(NO3)3 advectively, two orders of magnitude faster than regular diffusion and trigger a stratification with neighboring fingers that rise thanks to the buoyancy acquired by the loss of Y(NO3)3 . Hence, the usually stabilizing factor of diffusion can destabilize a system in which the density decreases upwards. The stratification persists for over 8 h (see Fig. 4(c) and animations in supplementary material). Viscous friction between the liquid and the cuvette walls plays a role in the horizontal scale of the individual fingers, which is inversely proportional to the distance between the cell wallsTaylor and Veronis (1986). Thus, a horizontal expansion of the fingers beyond the gap width is achievable in thin cuvettes. A magnet next to the cuvette erases the stratification and restabilizes the system by capturing the paramagnetic solution (see Fig. 4(d)). This does not reverse the mixing that has occurred and the Gd3+ ions can be seen to continuously diffuse into the Y(NO3)3 solution. The magnetic field gradient merely prevents the collapse of the liquid-liquid interface. Nonetheless, the system undergoes an immediate change upon its withdrawal (see Fig. 4(e)). Bereft of the confining magnetic field gradient force, the boundary between the solutions is once again disrupted. The ensuing release of the paramagnetic liquid is accompanied by convective mixing of the solutions amidst which the salt fingering instability can be witnessed anew. After two hours the system equilibrates as homogenization sets in (see Fig. 4(f)).
In conclusion, neutron imaging is a viable method for capturing quasi two-dimensional convective and diffusive processes in solutions containing Gd3+ ions. A pre-existing concentration of paramagnetic fluid in some region can be redistributed within a miscible liquid by the magnetic field gradient force, which counteracts density-difference driven convection. Furthermore, double-diffusive convection in the system of magnetic Gd(NO3)3 and nonmagnetic Y(NO3)3 salt solutions is suppressed. This manifests itself in the stratification by salt fingers when the magnet is absent. The implication of this is of great importance for the development of the magnetic separation of rare-earth ions, as even minor differences in diffusivity can precipitate salt fingering instabilities. If left unchecked, these will mix the separated solutions. A prerequisite for the generation of the liquid-liquid interface is a driving force that creates and preserves the concentration gradient of the paramagnetic ions. The magnetic field gradient is then able to bestow stability upon the system. Driving forces can range from the weak factor of evaporation to the more substantial injection of electrochemical energy, which can drive convection Mutschke et al. (2010); Dunne et al. (2011); Dunne and Coey (2012). In view of improvements in both imaging instrumentation and available neutron flux, higher resolution and frame rates are expected to improve the neutron imaging of hydrodynamic processes in the futureMorgano et al. (2015); Trtik and Lehmann (2016). This may prove valuable for the analysis of ions in solutions.
See supplementary material for time sequenced images of liquid-liquid systems containing Gd(NO3)3 and Y(NO3)3 solutions: undisturbed double-diffusive convection and magnetic confinement of a Gd(NO3)3 drop.
This work forms part of the MAMI project, which is an Innovative Training Network funded by the European Union’s Horizon 2020 research and innovation program under grant agreement No. 766007.
References
- Andres (1976) U. Andres, Mater. Sci. Eng. 26, 269 (1976).
- Andres et al. (1966) U. T. Andres, G. M. Bunin, and B. B. Gil, J. Appl. Mech. Tech. Phys. 7, 109 (1966).
- Turker and Arslan-Yildiz (2018) E. Turker and A. Arslan-Yildiz, ACS Biomater. Sci. Eng. 4, 787 (2018).
- Mutschke et al. (2010) G. Mutschke, K. Tschulik, T. Weier, M. Uhlemann, A. Bund, and J. Fröhlich, Electrochim. Acta 55, 9060 (2010).
- Dunne et al. (2011) P. Dunne, L. Mazza, and J. M. D. Coey, Phys. Rev. Lett. 107, 024501 (2011).
- Dunne and Coey (2012) P. Dunne and J. M. D. Coey, Phys. Rev. B 85, 224411 (2012).
- (7) Note that this expression is only valid if .
- Coey et al. (2009) J. M. D. Coey, R. Aogaki, F. Byrne, and P. Stamenov, Proc. Natl. Acad. Sci. U.S.A. 106, 8811 (2009).
- Braithwaite et al. (1991) D. Braithwaite, E. Beaugnon, and R. Tournier, Nature 354, 134 (1991).
- Rodrigues et al. (2019) I. R. Rodrigues, L. Lukina, S. Dehaeck, P. Colinet, K. Binnemans, and J. Fransaer, J. Phys. Chem. C 123, 23131 (2019).
- Yang et al. (2012) X. Yang, K. Tschulik, M. Uhlemann, S. Odenbach, and K. Eckert, J. Phys. Chem. Lett. 3, 3559 (2012).
- Pulko et al. (2014) B. Pulko, X. Yang, Z. Lei, S. Odenbach, and K. Eckert, Appl. Phys. Lett. 105, 232407 (2014).
- Rodrigues et al. (2017) I. R. Rodrigues, L. Lukina, S. Dehaeck, P. Colinet, K. Binnemans, and J. Fransaer, J. Phys. Chem. Lett. 8, 5301 (2017).
- Lei et al. (2017) Z. Lei, B. Fritzsche, and K. Eckert, J. Phys. Chem. C 121, 24576 (2017).
- Franczak et al. (2016) A. Franczak, K. Binnemans, and J. Fransaer, Phys. Chem. Chem. Phys. 18, 27342 (2016).
- Kołczyk et al. (2016) K. Kołczyk, M. Wojnicki, D. Kutyła, R. Kowalik, P. Żabiński, and A. Cristofolini, Arch. Metall. Mater. 61, 1919 (2016).
- Kolczyk-Siedlecka et al. (2019) K. Kolczyk-Siedlecka, M. Wojnicki, X. Yang, G. Mutschke, and P. Zabinski, J. Flow Chem. 9, 175 (2019).
- Noddack and Wicht (1952) W. Noddack and E. Wicht, Ber. Bunsenges. Phys. Chem. 56, 893 (1952).
- Noddack and Wicht (1955) I. Noddack and E. Wicht, Chem. Techn. 7, 3 (1955).
- Noddack et al. (1958) W. Noddack, I. Noddack, and E. Wicht, Ber. Bunsenges. Phys. Chem. 62, 77 (1958).
- Kardjilov et al. (2011) N. Kardjilov, I. Manke, A. Hilger, M. Strobl, and J. Banhart, Mater. Today 14, 248 (2011).
- Perfect et al. (2014) E. Perfect, C.-L. Cheng, M. Kang, H. Z. Bilheux, J. M. Lamanna, M. J. Gragg, and D. M. Wright, Earth-Sci. Rev 129, 120 (2014).
- Burca et al. (2018) G. Burca, S. Nagella, T. Clark, D. Tasev, I. A. Rahman, R. J. Garwood, A. R. T. Spencer, M. J. Turner, and J. F. Kelleher, J. Microsc. 272, 242 (2018).
- n_TOF Collaboration et al. (2019) n_TOF Collaboration, M. Mastromarco, A. Manna, et al., Eur. Phys. J. A 55, 9 (2019).
- Brenizer (2013) J. Brenizer, Phys. Procedia 43, 10 (2013).
- Trtik et al. (2016) P. Trtik, M. Morgano, R. Bentz, and E. Lehmann, MethodsX 3, 535 (2016).
- Zboray and Trtik (2019) R. Zboray and P. Trtik, Flow. Meas. Instrum. 66, 182 (2019).
- Ott et al. (2015) F. Ott, C. Loupiac, S. Désert, A. Hélary, and P. Lavie, Phys. Procedia 69, 67 (2015).
- Kardjilov et al. (2005) N. Kardjilov, F. de Beer, R. Hassanein, E. Lehmann, and P. Vontobel, Nucl. Instrum. Methods Phys. Res 542, 336 (2005).
- Boillat et al. (2018) P. Boillat, C. Carminati, F. Schmid, C. Grünzweig, J. Hovind, A. Kaestner, D. Mannes, M. Morgano, M. Siegwart, P. Trtik, P. Vontobel, and E. Lehmann, Opt. Express 26, 15769 (2018).
- Carminati et al. (2019) C. Carminati, P. Boillat, F. Schmid, P. Vontobel, J. Hovind, M. Morgano, M. Raventos, M. Siegwart, D. Mannes, C. Grünzweig, P. Trtik, E. Lehmann, M. Strobl, and A. Kaestner, PLOS ONE 14, 1 (2019).
- Furlani (2001) E. P. Furlani, Permanent magnet and electromechanical devices: materials, analysis, and applications (Academic Press, San Diego, 2001) pp. 208–217.
- Cussler (2009) E. L. Cussler, Diffusion: Mass Transfer in Fluid Systems (Cambridge University Press, 2009) p. 162.
- Sears (1992) V. F. Sears, Neutron News 3, 26 (1992).
- Huang et al. (2007) Z. Huang, A. De Luca, T. J. Atherton, M. Bird, C. Rosenblatt, and P. Carlès, Phys. Rev. Lett. 99, 204502 (2007).
- Tsiklashvili et al. (2012) V. Tsiklashvili, P. E. R. Colio, O. A. Likhachev, and J. W. Jacobs, Phys. Fluids 24, 052106 (2012).
- Turner and Stommel (1964) J. S. Turner and H. Stommel, Proc. Natl. Acad. Sci. U.S.A. 52, 49 (1964).
- Stern and Turner (1969) M. E. Stern and J. S. Turner, Deep-Sea Res. Oceanogr. Abstr. 16, 497 (1969).
- Taylor and Veronis (1986) J. Taylor and G. Veronis, Science 231, 39 (1986).
- Morgano et al. (2015) M. Morgano, E. Lehmann, and M. Strobl, Phys. Procedia 69, 152 (2015).
- Trtik and Lehmann (2016) P. Trtik and E. H. Lehmann, J. Phys. Conf. Ser. 746, 012004 (2016).
Supplementary Material:
Neutron imaging of liquid-liquid systems containing paramagnetic salt solutions
T. A. Butcher,1,∗ G. J. M. Formon,2 P. Dunne2, T. M. Hermans2, F. Ott3, L. Noirez3, and J. M. D. Coey1
1School of Physics and CRANN, Trinity College, Dublin 2, Ireland
2Université de Strasbourg, CNRS, ISIS UMR 7006, 67000 Strasbourg, France
3Laboratoire Léon Brillouin (CEA-CNRS), Université Paris-Saclay, CEA-Saclay, 91191 Gif-sur-Yvette, France
∗tbutcher@tcd.ie
(Dated: December 19, 2019)
Additional Time sequenced neutron images
S1 Unhindered mixing by salt fingering
S2 Magnetic confinement of a drop of Gd(NO3)3 solution