Pulsation among TESS A and B stars and the Maia variables
Abstract
Classification of over 50000 TESS stars in sectors 1–18 has resulted in the detection of 766 pulsating main sequence B stars as well as over 5000 Scuti, 2300 Doradus and 114 roAp candidates. Whereas it has been assumed that high frequency pulsation among B-type main sequence stars are confined to the early B-type Cephei stars, the observations indicate that high frequencies are to be found over the whole B-star range, eventually merging with Scuti stars. The cool B stars pulsating in high frequencies are called Maia variables. It is shown that Maia variables are not rapidly-rotating and thus cannot be Cephei pulsators which appear to have lower temperatures due to gravity darkening. In the region where Cephei variables are found, the proportion of pulsating stars is larger and amplitudes are higher and a considerable fraction pulsate in a single mode and low rotation rate. There is no distinct region of slowly-pulsating B stars (SPB stars). Stars pulsating solely in low frequencies are found among all B stars. At most, only one-third of B stars appear to pulsate. These results, as well as the fact that a large fraction of A and B stars show rotational modulation, indicate a need for a revision of current ideas regarding stars with radiative envelopes.
keywords:
stars: early-type – stars: oscillations1 Introduction
The advent of space photometry, particularly from the Kepler and TESS missions, has radically changed perceptions on stellar pulsation in the upper main sequence. For example, from CoRoT data, Degroote et al. (2009) find evidence for a new class of low-amplitude B-type pulsators between the SPB and Scuti instability strips. Prior to Kepler, it was believed that the opacity mechanism offered a complete and satisfactory explanation for the Scuti, SPB and Cephei pulsating variables. At the cool end of the Sct instability strip, pulsations in the Doradus variables were attributed to the convective blocking mechanism (Guzik et al., 2000). Photometric time series observations from space were expected to confirm model predictions and perhaps resolve a few minor problems.
The first surprise was the discovery that low-frequency Dor pulsations are visible throughout the Sct instability strip (Grigahcène et al., 2010). We know now that the distinction between the two types of variable is merely one of mode selection and not of pulsation mechanism since they share the same instability region (Balona, 2018). This suggests a problem with assumptions regarding convection on the upper main sequence. Bowman & Kurtz (2018) and Balona (2018) find that a non-negligible fraction of main-sequence Sct stars exist outside theoretical predictions of the classical instability boundaries. Recent calculations using time-dependent perturbation theory (Antoci et al., 2014; Xiong et al., 2016) including turbulent convection do not resolve the issue.
Among the main-sequence B stars, the mechanism operating in the ionization zone of iron-group elements appears to be responsible for the high-frequency pulsations of the Cephei stars as well as the low-frequency pulsations among the cooler SPB variables. These were the only two recognized classes of pulsating variable in main-sequence stars hotter than the blue edge of the Sct instability strip. Stankov & Handler (2005) provide a list of 93 confirmed Cep variables with an additional 14 stars discovered by Pigulski (2005). Most recently, Labadie-Bartz et al. (2019) presented results of a search for Cep stars from the KELT exoplanet survey. They identify 113 Cep stars, of which 86 are new discoveries. Burssens et al. (2019) found 3 new Cep stars observed by the K2 mission. Ground-based surveys for SPB stars have been made by several groups (Aerts et al., 1999; Mathias et al., 2001; De Cat & Aerts, 2002; De Cat et al., 2007).
The CoRoT space mission (Fridlund et al., 2006) contributed considerably to our knowledge of pulsation among the B stars. For example, observations of the O9V star HD 46202 show Cep-like pulsations, but none of the observed frequencies are excited in the models (Briquet et al., 2011). A global magnetic field was found in the hybrid B-type pulsator HD 43317 (Briquet et al., 2013). Unexpected modes with short lifetimes in HD 180642 were initially interpreted as stochastic modes excited by turbulent convection (Belkacem et al., 2009), but this conclusion was subsequently disputed (Aerts et al., 2011; Degroote, 2013). At least 15 new SPB candidates were detected by CoRoT (Degroote et al., 2009).
Due to the high galactic latitude of the field observed by the Kepler space mission (Borucki et al., 2010), relatively few B stars were observed. Balona et al. (2011) found 15 pulsating stars, all of which show low frequencies characteristic of SPB stars. Seven of these stars also show a few weak, isolated high frequencies.
From time to time, ground-based observations reported the possible presence of high frequencies in a few stars too hot to be Scuti, but too cool to be Cephei (McNamara, 1985; Lehmann et al., 1995; Percy & Wilson, 2000; Kallinger et al., 2004). These were called Maia variables following a report by Struve (1955) of short-period variations in the star Maia, a member of the Pleiades cluster. Struve (1955) later disclaimed the variability. It is now known from the K2 space mission that Maia itself is a rotational variable with a 10-d period (White et al., 2017) and no sign of high frequencies.
One of the most interesting results from the CoRoT mission is evidence for a new class of low-amplitude B-type pulsator between the SPB and Sct instability strips, with a very broad range of frequencies extending well into the Cep range (Degroote et al., 2009). These are probably the same as the Maia variables described above. B stars with high frequencies too cool to be Cep variables have also been detected in the Kepler field (Balona et al., 2015; Balona et al., 2016).
From ground-based photometry, Mowlavi et al. (2013); Lata et al. (2014); Mowlavi et al. (2016) discovered anomalous high frequencies in rapidly-rotating late to mid-B stars. At this time, it is not clear if these stars can be considered as Maia variables. From pulsating models of rotating B stars, Salmon et al. (2014) found that frequencies as high as 10 d-1 may be visible in mid- to late B stars. They therefore suggest that these could be fast-rotating SPB stars in which the apparent effective temperature is lowered by gravity darkening at the equator. More recently, Szewczuk & Daszyńska-Daszkiewicz (2017) have computed the instability domains for B stars including the effects of slow-to-moderate rotation. They find that unstable prograde high radial order g modes may have quite high frequencies which could account for these anomalous variables and the Maia stars.
The advent of TESS (Ricker et al., 2015) has opened a new opportunity to study pulsation among the B stars. A sample of over 50000 stars hotter than 6000 K from sectors 1–18 were examined and classified according to variability type. The classification is based on a visual inspection of the periodogram and light curve for each star. According to current knowledge, apart from the chemically peculiar roAp stars, the only A and B main sequence stars with frequencies higher than about 5 d-1 are the Sct (DSCT) and Cep (BCEP) variables, the distinction being made according to the effective temperature. It is, however, necessary to introduce the Maia class to account for the anomalous high-frequency B-type variables just described. This does not imply that the Maia variables are necessarily a separate group of pulsating stars. If Maia variables are simply rapidly-rotating Cep or SPB stars, then they must have higher than normal projected rotational velocities, allowing a test of this idea to be made.
The effective temperatures, , in the TESS Input Catalogue (TIC) (Stassun et al., 2018) are unreliable for B stars because most are derived from multicolour photometry lacking the U band. Without photometric measurements in the U band, the Balmer jump cannot be measured and it is not possible to distinguish stars with K from the A stars. Spectral classification shows that there are nearly 2900 B stars in the sample of about 50000 TESS stars. Many stars that we originally classified as DSCT or Doradus (GDOR) on the basis of temperatures listed in the TIC, were re-classified as BCEP, MAIA or SPB variables because they have B-type spectra.
In this paper, we use the best available estimates of and luminosities using Gaia DR2 parallaxes to locate the stars in the H–R diagram and the pulsation period vs (P–T) diagram. The locations of stars classified as SPB or BCEP in the P–T diagram are compared to the predicted locations derived from pulsation models. In this way, current ideas regarding pulsation instability among the B stars can be tested. In particular, we investigate the status of the Maia variables and the connection between pulsation in A and B stars.
2 Data and classification
TESS light curves for thousands of stars with two-minute cadence are available according to sector number. There are 26 partially overlapping sectors covering the whole sky and each sector is observed for approximately one month. The wide-band photometry has been corrected for long-term drifts using pre-search data conditioning (PDC, Jenkins et al. 2010). Each TESS pixel is 21 arcsec in size which is similar to the typical aperture size used in ground-based photoelectric photometry. Working groups 4 and 5 of the TESS asteroseismic consortium were involved in target selection (Pedersen et al., 2019; Handler et al., 2019).
Effective temperatures are listed for most TESS stars in the TIC, but for reasons already mentioned, they cannot be used for B stars. To resolve this problem, a catalog of over 600000 stars brighter than 12-th magnitude with known spectroscopic classifications was created and matched with the TIC. This allows the proper assignment to be made regarding the type of variability.
As far as possible, it is necessary to assign the variability class in accordance with the well-established types used in the General Catalogue of Variable Stars (GCVS, Samus et al. 2017). One major consideration is that variation due to rotational modulation seems to be present in all types of star, including the B stars (Balona, 2019). This may be due to chemical peculiarities (the SX Ari class), but most often there is no indication of spectral peculiarity, in which case the new ROT class is assigned. Rotation always needs to be considered when examining the periodograms at low frequencies.
Variability classification for stars with K is made as each sector becomes available. Aided by suitable software, classification of over 100 stars an hour is possible, so that the full sector, which normally contains 1000–2000 previously unclassified stars, can be classified in a few days. In this way, variability types of over 50000 stars in sectors 1–18 were obtained. Of these, 2868 are O and B stars. An important advantage of visual classification is that after a while it is easy to recognize early-type supergiants, Be stars, and many other classes purely from the light curve and periodogram. Of course, many interesting stars can be noted for further study.
As already mentioned, pulsation models of non-rotating Cep and SPB stars show a clear separation between the two kinds of variable in a plot of pulsation period as a function of (see Fig. 4 of Miglio et al. 2007a). SPB stars mostly have frequencies less than 2.5 d-1, whereas Cep stars all have higher frequencies. Most Cep stars are confined to K. We therefore classified a star as BCEP only if it is earlier than B5 or B6 and if most of the observed frequencies of highest amplitude exceed 2.5 d-1. For SPB stars it was decided that for K a boundary of 2.5 d-1 separates BCEP from SPB, but for cooler stars the boundary between low and high frequencies was moved to 5 d-1 to allow more flexibility for rotational effects. A star is classified as MAIA if K and most peaks of high amplitude exceed 5 d-1.
In many cases the amplitudes in the low-frequency range are comparable to those in the high frequencies in which case we use BCEP+SPB or SPB+BCEP, depending on which range seems to dominate. These would be the Cep/SPB hybrids. The hybrid classes MAIA+SPB and SPB+MAIA are also assigned.
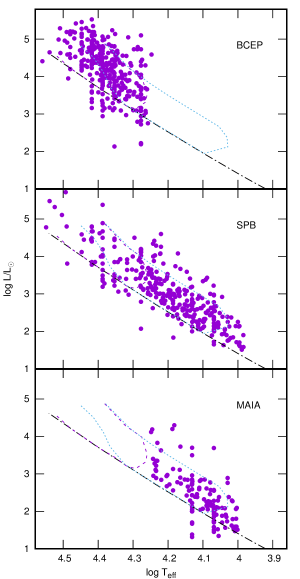
In Table 1, 327 Cep variables (the majority of which are previously unknown), 308 pure SPB stars (i.e. non-hybrids) and 131 Maia stars are listed. In Fig. 1, the Cep, SPB and Maia stars are shown in the theoretical H-R diagram. Also shown are the theoretical instability strips for metal abundance , using OP opacities and the AGS05 mixture as calculated by Miglio et al. (2007a). A more recent calculation of the instability region by Walczak et al. (2015) using updated opacities gives much the same result. A few stars lie below the zero-age main sequence and may be previously unrecognized pulsating subdwarfs.
It should be noted that the calculated instability strips shrink quite rapidly with decreasing metallicity. The figure shows the instability strips for solar abundance and OP opacities from Miglio et al. (2007a). These define approximately the maximum extent of instability in non-rotating models. Rotation will tend to reduce the apparent effective temperature of a star if it is rapidly rotating and with high inclination due to gravity darkening at the equator (von Zeipel, 1924). This means that some stars may appear outside the cool edge of the instability strip. Szewczuk & Daszyńska-Daszkiewicz (2017) computed the instability domains for gravity and mixed gravity-Rossby modes, including the effects of slow-to-moderate rotation. The main result is that g-mode instability domains are much more extended towards higher masses and higher effective temperatures, mainly as a result of using OPAL rather than OP opacities.
| TIC | Var Type | Pr | Sp. Type | |||
|---|---|---|---|---|---|---|
| 99010 | SPB | 9931 | 1 | 2.13 | 164 | B9.5III |
| 3300381 | BCEP+ROT | 20400 | 3 | 4.09 | B2IIIn | |
| 4207261 | SPB+BCEP | 24012 | 1 | 4.03 | 10 | B1.5V |
| 6110321 | MAIA+SPB | 14200 | 4 | 2.85 | B8e: | |
| 7429754 | SPB | 15546 | 2 | 2.96 | B6V | |
| 9887122 | SPB+MAIA | 11324 | 1 | 2.38 | 150 | B6(V) |
| 10510382 | SPB | 22570 | 5 | 3.85 | 37 | B3Vp shell |
| 10891640 | BCEP+EB | 28000 | 5 | 4.29 | B0.5III: | |
| 11400562 | SPB+BCEP | 23940 | 1 | 4.13 | 75 | B2IV-V |
| 11411724 | BCEP+SPB | 24068 | 2 | 3.15 | 200 | B1.5V |
| 11696250 | BCEP | 26169 | 1 | 5.07 | 116 | B0.5III |
| 11698190 | BCEP | 20200 | 3 | 4.29 | B0.5V |
3 Effective temperatures and luminosities
The effective temperature is a crucial component in establishing the type of variability. The most reliable estimates of are those which use spectroscopic observations combined with model atmospheres. The PASTEL compilation of spectroscopic parameters (Soubiran et al., 2016) are particularly useful in this regard. The literature was searched for more recent measurements, and a catalogue of over 101500 stars comprising nearly 170000 individual measurements of various kinds was compiled.
Each method of deriving was assigned a priority class. First priority is given to spectroscopic modelling. Values of from Strömgren or Geneva photometry were assigned second priority. Values using Johnson UBV photometry and the Q method of de-reddening were applied to many stars, but assigned third priority. Fourth priority was given when only BV photometry is available. In this case the reddening can be estimated using a 3D reddening map by Gontcharov (2016). The Torres (2010) calibration giving as a function of was used for the latter two methods. Finally, when no other way of obtaining was possible, the spectral type and luminosity class and the Pecaut & Mamajek (2013) calibration were used and assigned fifth priority. The adopted value of is the average of measurements of highest priority only, even if many more measurements of lower priority are available. For most stars, only one measurement method (i.e. one priority) is available.
Stellar luminosities were derived from Gaia DR2 parallaxes (Gaia Collaboration et al., 2016, 2018). The bolometric correction was obtained from using the Pecaut & Mamajek (2013) calibration. The reddening correction was derived from a three-dimensional reddening map by Gontcharov (2017). From the error in the Gaia DR2 parallax, the typical standard deviation in is estimated to be about 0.05 dex, allowing for standard deviations of 0.01 mag in the apparent magnitude, 0.10 mag in visual extinction and 0.02 mag in the bolometric correction in addition to the parallax error.
A catalogue of projected rotational velocities, consisting of over 58000 individual measurements of 35200 stars was compiled. The bulk of these measurements are from Glebocki & Gnacinski (2005). The catalogue was brought up to date by a literature search.
4 The Period-Temperature diagram
Miglio et al. (2007b) studied the effect of different opacity tables and metallicities on the pulsational stability of non-rotating B stars. A useful visual representation of these results is a plot of the periods of unstable modes as a function of (the P-T diagram). This leads to two non-overlapping regions, as shown in Fig. 2, which define the instability regions of Cep and SPB stars in the models. One may expect a larger spread of pulsation periods and a displacement in the observed to lower values in the more rapidly-rotating stars.
Also shown in Fig. 2 are the pulsating stars observed by TESS where the symbol size is related to the maximum amplitude. To obtain the period in the P-T diagram, the peak of highest amplitude with frequency d-1 was used for a star classified as BCEP. For BCEP+SPB or SPB+BCEP, two periods are extracted, one above 2.5 d-1 and the other below this frequency. For SPB, only one period with d-1 is extracted. For stars with K, the cool edge of the Cep instability strip, one period with d-1 was extracted. For SPB+MAIA or MAIA+SPB, two periods are extracted and for MAIA stars, the peak of highest amplitude with d-1 is used. For comparison, Fig. 2 also shows the DSCT, GDOR and ROAP stars. The dashed lines in the figure represent the regions for the different variability classes as defined above.
In Fig. 2 there is a concentration of stars with relatively high amplitudes in the predicted Cep region (though somewhat displaced to higher ), mostly with frequencies in the range 5–10 d-1. There is no obvious concentration of SPB stars, but there are quite a number of stars cooler than the Cep stars with high frequencies. These are the Maia variables.
5 Cep stars
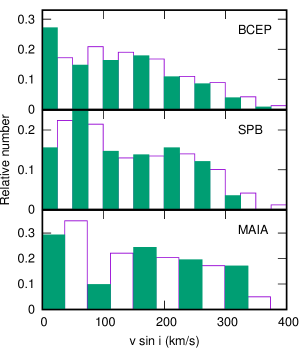
The frequency distribution of Cep stars, as revealed by the periodograms, is much sparser than that of Sct stars. Very few Cep stars have more than a dozen significant peaks and about 20-30 percent pulsate in just one dominant frequency. Very often harmonics are present in these single-mode stars. The median amplitude of the maximum-amplitude peak for all Cep stars is 3.9 ppt, while for the Cep stars with one dominant mode it is 13.3 ppt. The average projected rotational velocity for all Cep stars is km s-1 (129 stars). For stars with a single pulsation mode km s-1 (23 stars). Thus single-mode Cep stars have significantly higher amplitudes and significantly lower rotation rates than other Cep stars. The implication of this result is not clear at present.
For all B stars in the same temperature range km s-1 (2730 stars). The rotational frequency distribution for Cep stars is therefore the same as for all main sequence stars in the same temperature range, as shown in Fig. 3.
It is reasonable to presume that the dominant high-amplitude mode could have the same spherical harmonic degree, , in these stars. The dimensionless frequency, where is the angular pulsation frequency, the stellar radius, the stellar mass and the gravitational constant, is a useful indicator of the pulsation mode. Given and the stellar luminosity, can be estimated from interpolation of evolutionary tracks which enables to be found. From 71 Cep stars having a single dominant frequency, it is found that . The main source of error is the effective temperature. An uncertainty of 1000 K in leads to an uncertainty of 0.7 in . Comparison with theoretical models calculated using the code by Dziembowski (1977) suggests that a radial mode or , where is the radial order, as the most probable identification.
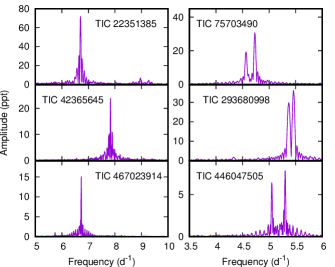
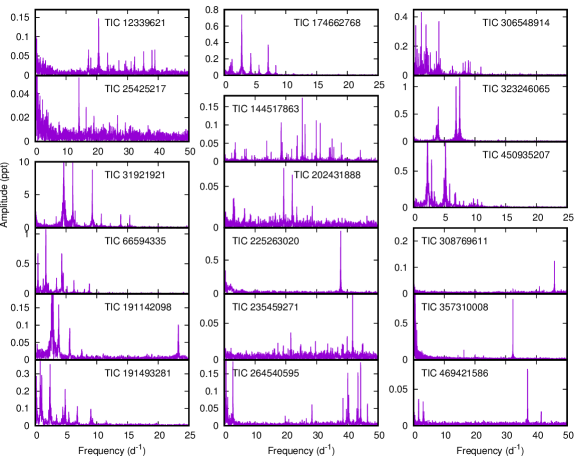
About 8 percent of Cep stars have a curious feature. This is the presence of just two peaks of similar amplitude, perhaps a result of rotational splitting or tidal interaction. These stars are quite noticeable in visual inspection of the periodograms and deserve careful study. Examples are shown in Fig. 4. About half the Cep stars contain low frequencies typical of SPB stars, i.e. they are Cep/SPB hybrids.
6 SPB stars
As can be seen in Fig. 1, stars with only low frequencies (i.e. the SPB stars with peaks below 2.5 d-1 or 5 d-1) are prevalent right across the B star region, including a substantial number within the Cep instability region. Although hybrid stars are expected in this region, models do not predict stars where only low frequencies are unstable. There are 90 pure SPB stars (i.e. no frequencies exceeding 2.5 d-1) with K in the TESS field.
The median amplitude for all 308 SPB stars is 1.3 ppt, which is considerably smaller than for Cep stars.
From ground-based observations, the SPB stars have been found to be slow rotators ( km s-1, Balona 2009). The mean projected rotational velocity for 121 TESS SPB stars with K is km s-1, while for all main sequence stars in the same temperature range km s-1 (1672 stars). For hotter SPB stars km s-1 (61 stars), while for main-sequence stars in the same range km s-1 (2545 stars). Clearly, the rotation rate of SPB stars is the same as for main sequence stars in the same range as shown in Fig. 3.
| TIC | Pr | Sp. Type | |||
|---|---|---|---|---|---|
| 9887122 | 11324 | 1 | 2.38 | 150.0 | B6(V) |
| 12339621 | 10363 | 1 | 2.27 | 52.5 | B9.5III+ |
| 25425217 | 10404 | 2 | 2.29 | 230.0 | B9III |
| 31921921 | 16575 | 2 | 2.84 | 75.0 | B1I/IIIk |
| 36557487 | 13922 | 2 | 2.84 | 255.7 | B8IIIn |
| 52684359 | 14624 | 2 | 2.90 | 52.8 | B8IV (shell) |
| 66594335 | 16008 | 1 | 2.94 | 300.0 | B2IV-V |
| 71580820 | 17024 | 1 | 3.35 | 55.0 | B5III |
| 116273716 | 12910 | 1 | 2.59 | 156.7 | B5/7III |
| 129533458 | 12742 | 1 | 2.84 | 69.5 | B7III |
| 144028101 | 13520 | 5 | 2.74 | 266.7 | B8Ve |
| 144517863 | 12151 | 1 | 2.27 | 290.0 | B9V |
| 160704414 | 13183 | 1 | 2.40 | 367.3 | B7:V:nn |
| 169551936 | 12439 | 1 | 2.85 | 123.0 | B8III |
| 174662768 | 13918 | 2 | 2.66 | 42.0 | B5Vn |
| 191142098 | 10864 | 1 | 1.56 | 212.0 | B8.5Vn |
| 191493281 | 15915 | 1 | 2.97 | 167.2 | B3III/V: |
| 202431888 | 12024 | 1 | 2.46 | 44.3 | B9IVSi: |
| 225263020 | 10028 | 2 | 1.51 | 214.0 | A0/1V |
| 234887704 | 13520 | 5 | 2.12 | 286.0 | B8Ve |
| 235459271 | 11967 | 1 | 2.57 | 170.8 | B8Vn |
| 239219717 | 11776 | 1 | 2.17 | 333.8 | B6III |
| 241660076 | 11508 | 1 | 2.11 | 249.5 | B9.5V |
| 250137613 | 14670 | 1 | 3.11 | 22.8 | B5IV |
| 264540595 | 11583 | 2 | 2.06 | 270.0 | B9.5V |
| 270219259 | 13520 | 5 | 2.96 | 301.2 | B8III shell |
| 271971626 | 11412 | 1 | 2.29 | 17.0 | B9IV |
| 277674241 | 10789 | 1 | 1.85 | 308.0 | B9Vn: |
| 301100741 | 12000 | 2 | 2.25 | 84.2 | B9Si |
| 306548914 | 17466 | 2 | 2.95 | 155.7 | B5V |
| 308769611 | 10116 | 1 | 1.80 | 172.0 | A0V |
| 323246065 | 12214 | 1 | 2.12 | 343.0 | B9IV |
| 331268750 | 13552 | 1 | 2.71 | 88.2 | B6/7 + B7/8 |
| 341040976 | 12900 | 2 | 2.63 | 25.0 | B9Si |
| 354793407 | 14900 | 2 | 2.78 | 51.4 | B8Hewk.Si |
| 357310008 | 13100 | 2 | 2.46 | 30.0 | B9Si |
| 400445441 | 14562 | 2 | 2.74 | 65.0 | B5/6IV |
| 408382023 | 17140 | 5 | 3.08 | 272.6 | B6V(e) |
| 450935207 | 15975 | 1 | 2.67 | 320.0 | B6Vn |
| 469421586 | 13520 | 5 | 2.85 | 205.0 | B8IV/V |
| 469906369 | 10069 | 1 | 2.09 | 220.5 | B9.5IVn |
7 Maia stars
Perhaps the most interesting result is the presence of a significant number of stars with high frequencies cooler than the red edge of the Cep region. This confirms the detection of such stars by CoRoT (Degroote et al., 2009). If these are rapidly-rotating Cep or SPB stars, then all of these Maia variables should have considerably larger than main sequence stars in the same range. Projected rotational velocities are available for 41 of the 131 Maia stars (Table 2). The mean projected rotational velocity is km s-1, while the for main sequence stars in the same temperature range km s-1 from 1672 stars. There is a difference of two standard deviations between the two values, which is not considered statistically significant. The frequency distribution is shown in Fig. 3.
Clearly, Maia stars are not rapidly rotating Cep or SPB stars. They could possibly be composite objects consisting of a non-pulsating B star and a Sct star. Another possible explanation is that the effective temperatures are in error and that Maia stars are actually Sct variables. The most reliable measure of has been used. As can be seen from Table 2, a large proportion of stars have measured by modelling the spectrum, so this explanation is unlikely.
The median amplitude for all 131 Maia stars is only 0.36 ppt, which perhaps explains why these stars were never confirmed to exist from ground-based observations.
The distribution of high frequencies in Maia variables resembles that in Sct stars rather than in Cep variables. Whereas, dominant frequencies as high as 20 d-1 or more are common among the Maia variables, the frequency of highest amplitude in BCEP variables rarely exceeds 10 d-1. Of the Maia stars with dominant frequencies higher than 20 d-1, 10 percent have values of estimated from spectroscopy and 20 percent from spectroscopy and narrow-band photometry. All have spectral classifications of A0 and earlier.
8 Fraction of B stars that pulsate
| Type | range | Percent | ||
|---|---|---|---|---|
| BCEP | 18000–35000 | 284 | 1242 | 22.9 |
| SPB | 18000–35000 | 162 | 1242 | 13.0 |
| SPB | 10000–35000 | 289 | 2605 | 11.1 |
| SPB | 10000–18000 | 127 | 1363 | 9.3 |
| MAIA | 10000–18000 | 91 | 1363 | 6.7 |
Table 3 shows the number of Cep, SPB and Maia stars in different ranges of effective temperature as well as the total number of main sequence stars in the same range observed by TESS. It is clear that pulsation among B stars is not very common. While it is possible that pulsations below the detection level may be present in all B stars, it is likely that pulsational instability is confined to only certain stars for reasons unknown. The same result applies for Sct stars (Balona & Dziembowski, 2011; Balona, 2018; Murphy et al., 2019). This poses a challenge for current models which do not consider possibly small differences in the composition, structure, magnetism, rotation etc in the outer layers. Even if two stars have the same effective temperature, luminosity, global abundance and projected rotational velocity, these differences may affect pulsational stability and mode selection.
9 Relationship with Scuti and Doradus stars
The Sct and Dor variables (Antoci et al., 2019) seem to be driven by the same mechanism and distinguished only by different mode selection (Balona, 2018). However, they clearly occupy well-defined regions in the H–R diagram as shown in Fig. 6, even though the classification is based on the presence or absence of peaks with frequencies in excess of 5 d-1, which is independent of its effective temperature or luminosity. From this point of view, it is still useful to distinguish between Dor and Sct stars, even though low frequencies are present in both types of variable.
The same is not true for Cep and Maia stars. Both are characterised by the presence of high frequencies and, if considered as a single group, would occupy the whole B star range. The imposed boundary of 18000 K between the two groups is purely arbitrary, guided by the fact that some correspondence between the models and observations needs to be made. In other words, unlike the Sct and Dor stars, there is no information in the light curve or periodogram which relates to the location of the star in the H-R diagram.
In Fig. 2 it can be seen that stars that correspond to models of Cep variables can be distinguished not only by the presence of high frequencies, but also by higher pulsation amplitudes. However, classification using amplitudes also requires an arbitrary choice of amplitude. Moreover, a low amplitude does not distinguish Maia from Cep because there are many Cep stars with low amplitudes similar to Maia variables. In other words, there is no observational criterion that offers a clean distinction between Cep and Maia variables and which is independent of spectral type.
Likewise, there is no distinct instability strip for SPB stars. Stars with low frequencies occur right across the whole B-star main sequence as well as in blue supergiants (Bowman et al., 2019). Clearly, there is a problem with current pulsation models which need to be refined.
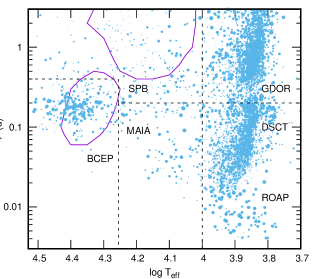
This study is about pulsation among the B stars and, as a consequence, it was initially restricted to stars with K. However, in Fig. 1 the numbers of SPB and Maia variables do not decrease with decreasing which suggests that both these variables should be present among the early A stars. This is indeed the case, as can be seen in Fig. 6. In this figure we show the locations of over 5000 Sct and over 2300 Dor variables in the H-R diagram from TESS sectors 1–18. Also included are 113 roAp stars (Cunha et al., 2019), of which 68 are new candidates. These are included for completeness.
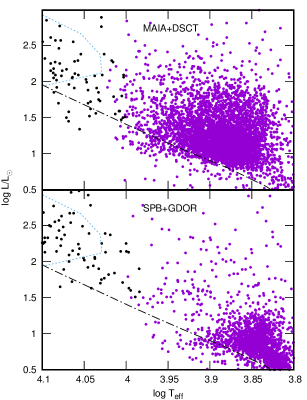
It should be noted that there are a considerable number of stars classified as DSCT, even though they are hotter than the observed Sct blue edge at about . It is not possible to distinguish between these hot Sct stars and the Maia variables. An artificial boundary of 10000 K was chosen to separate MAIA and DSCT variables.
Similarly, stars classified as GDOR (i.e. frequency mostly less than 5 d-1) seem to be present which are much hotter than the observed blue edge of the Dor stars at about 7500 K (Balona et al., 2016). These hot Dor stars cannot be distinguished from the SPB stars. Once again, a purely arbitrary boundary of 10000 K was chosen between SPB and GDOR stars. The Maia stars seem to be a continuation of the Sct variables which then merge into the Cep stars. The Dor stars, which cannot really be considered as separate from the Sct variables, seem to merge into the SPB stars. Of course, this may be a result of incorrect effective temperatures, and further research is required.
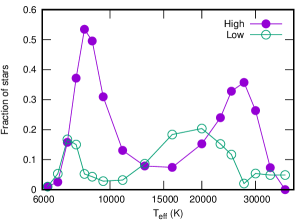
In Fig. 7 the fraction of high-frequency pulsating stars ( Sct, Maia and Cep variables) and of low-frequency pulsating stars ( Dor and SPB variables) is shown as a function of . Even at a minimum of K, stars pulsating at high frequencies still comprise about 8 percent of the total number of main sequence stars in the same temperature range. The distinct separation in effective temperature between DSCT and BCEP stars that non-rotating models predict is not seen; instead there are main-sequence stars with similar frequencies between the two groups. The same is true of the GDOR and SPB stars, though the situation is less clear in this case.
10 Conclusions
Light curves and periodograms of over 50000 stars in TESS sectors 1–18 were visually examined. Where appropriate, each star was assigned a variability type. Using the TIC effective temperatures, many stars classified as DSCT ( Scuti) or GDOR ( Doradus) were later re-classified as BCEP ( Cephei), MAIA or SPB based on more reliable estimates of and/or their spectral types. The Maia class is necessary because many B stars with high frequencies are too cool to be classified as Cep variables.
With the period–effective temperature diagram as a guideline, it became clear that a stricter definition of the different types of B-type variables is required. For stars hotter than about 18000 K, a frequency of 2.5 d-1 was chosen to distinguish between BCEP and SPB stars. For cooler stars a frequency of 5 d-1 was chosen as the boundary between Maia and SPB stars. Using this classification, 327 Cep, 131 Maia and 308 SPB stars were detected. These results confirm the CoRoT detections of Maia variables and SPB stars extending well into the Cep region (Degroote et al., 2009).
In estimating we used a system of priorities where the most reliable estimates (priority 1) are those where is derived by modelling the stellar spectrum. The least precise estimate (priority 5) uses the spectral type and luminosity class. The effective temperature for B stars is still poorly known and badly neglected because modern CCDs are not very sensitive in the UV range.
It seems that all three groups of pulsating variables have projected rotational velocities similar to non-pulsating stars in the same temperature range. In particular, the Maia stars rotate no faster than other main sequence stars in the same range. Therefore this anomalous group cannot be explained as rapidly-rotating Cep or SPB stars. Because many Maia stars have values of derived from spectrum modelling, it is also unlikely that they are a result of erroneous temperature estimates.
If the pulsating A stars are considered, there appears to be no distinct grouping of high-frequency pulsators. The Sct, Maia and Cep stars seem to merge smoothly with each other. The Sct and Cep groups form two distinct maxima in the relative population and also have amplitudes significantly larger than other pulsating stars, but they are not isolated groups. The relatively large number of stars of high frequencies outside the traditional instability strips of Sct and Cep stars remains unexplained.
The Cep stars observed by TESS have frequencies which span a relatively narrow range, mostly between 3–10 d-1. Their amplitudes are relatively large compared to the SPB and Maia stars. A significant fraction of the Cep stars pulsate in only a single dominant frequency which, by matching the dimensionless frequency with models, may be the second radial () or quadrupole () overtone. These stars have high amplitudes and low rotation rates. Why a particular mode with these properties should be selected is not clear.
Low-frequency pulsations seem to be present across the whole main sequence from the Dor stars to the domain of the Cep variables. In fact, a substantial number of SPB stars with no high frequencies and K have been found, even though these are not predicted. These were first detected by CoRoT (Degroote et al., 2009). Their rotation rates are, however, quite normal. Although there are relatively few of the anomalous “hot Dor” stars, they merit further study.
The Be stars are not considered here. There is a widespread opinion that the mass-loss mechanism is a result of nonradial pulsation coupled with near-critical rotation (Rivinius, 2013). Recent results from TESS do not support this conclusion (Balona & Ozuyar, 2019) since the variations are incoherent, though quasi-periodic. Recent analyses of the projected rotational velocities also indicate that they do not rotate at near-critical velocity (Cranmer, 2005; Zorec et al., 2016).
These results, though different from what may have been expected based on current knowledge, are not entirely surprising. For some time it has been clear that the simple picture of static radiative envelopes in A and B stars is in need of revision (Balona, 2012, 2013, 2016, 2017). The detection of rotational modulation among a large fraction of B stars (Balona, 2019) shows that current concepts of B star atmospheres are not compatible with observations. It seems that the multitude of questions relating to pulsation among the A and B stars needs to await a better understanding of the physics of the upper envelopes of these stars.
Acknowledgments
LAB wishes to thank the National Research Foundation of South Africa for financial support. Discussions with Dr Peter De Cat, Dr Gerald Handler and Dr Keivan Stassun are also gratefully acknowledged.
Funding for the TESS mission is provided by the NASA Explorer Program. Funding for the TESS Asteroseismic Science Operations Centre is provided by the Danish National Research Foundation (Grant agreement no.: DNRF106), ESA PRODEX (PEA 4000119301) and Stellar Astrophysics Centre (SAC) at Aarhus University.
This work has made use of data from the European Space Agency (ESA) mission Gaia, processed by the Gaia Data Processing and Analysis Consortium (DPAC). Funding for the DPAC has been provided by national institutions, in particular the institutions participating in the Gaia Multilateral Agreement.
This research has made use of the SIMBAD database, operated at CDS, Strasbourg, France. Data were obtained from the Mikulski Archive for Space Telescopes (MAST). STScI is operated by the Association of Universities for Research in Astronomy, Inc., under NASA contract NAS5-2655.
References
- Aerts et al. (1999) Aerts C., et al., 1999, A&A, 343, 872
- Aerts et al. (2011) Aerts C., Briquet M., Degroote P., Thoul A., van Hoolst T., 2011, A&A, 534, A98
- Antoci et al. (2014) Antoci V., et al., 2014, ApJ, 796, 118
- Antoci et al. (2019) Antoci V., et al., 2019, MNRAS, 490, 4040
- Balona (2009) Balona L. A., 2009, in J. A. Guzik & P. A. Bradley ed., American Institute of Physics Conference Series Vol. 1170, American Institute of Physics Conference Series. pp 339–350, doi:10.1063/1.3246509, http://adsabs.harvard.edu/abs/2009AIPC.1170..339B
- Balona (2012) Balona L. A., 2012, MNRAS, 423, 3420
- Balona (2013) Balona L. A., 2013, MNRAS, 431, 2240
- Balona (2016) Balona L. A., 2016, MNRAS, 457, 3724
- Balona (2017) Balona L. A., 2017, MNRAS, 467, 1830
- Balona (2018) Balona L. A., 2018, MNRAS, 479, 183
- Balona (2019) Balona L. A., 2019, MNRAS, 490, 2112
- Balona & Dziembowski (2011) Balona L. A., Dziembowski W. A., 2011, MNRAS, 417, 591
- Balona & Ozuyar (2019) Balona L. A., Ozuyar D., 2019, arXiv e-prints, p. arXiv:1911.03068
- Balona et al. (2011) Balona L. A., et al., 2011, MNRAS, 413, 2403
- Balona et al. (2015) Balona L. A., Baran A. S., Daszyńska-Daszkiewicz J., De Cat P., 2015, MNRAS, 451, 1445
- Balona et al. (2016) Balona L. A., et al., 2016, MNRAS, 460, 1318
- Belkacem et al. (2009) Belkacem K., et al., 2009, Science, 324, 1540
- Borucki et al. (2010) Borucki W. J., et al., 2010, Science, 327, 977
- Bowman & Kurtz (2018) Bowman D. M., Kurtz D. W., 2018, MNRAS, 476, 3169
- Bowman et al. (2019) Bowman D. M., et al., 2019, Nature Astronomy, 3, 760
- Briquet et al. (2011) Briquet M., et al., 2011, A&A, 527, A112
- Briquet et al. (2013) Briquet M., Neiner C., Leroy B., Pápics P. I., 2013, A&A, 557, L16
- Burssens et al. (2019) Burssens S., Bowman D. M., Aerts C., Pedersen M. G., Moravveji E., Buysschaert B., 2019, MNRAS, 489, 1304
- Cranmer (2005) Cranmer S. R., 2005, ApJ, 634, 585
- Cunha et al. (2019) Cunha M. S., et al., 2019, MNRAS, 487, 3523
- De Cat & Aerts (2002) De Cat P., Aerts C., 2002, A&A, 393, 965
- De Cat et al. (2007) De Cat P., et al., 2007, A&A, 463, 243
- Degroote (2013) Degroote P., 2013, MNRAS, 431, 2554
- Degroote et al. (2009) Degroote P., et al., 2009, A&A, 506, 471
- Dziembowski (1977) Dziembowski W., 1977, Acta Astron., 27, 95
- Fridlund et al. (2006) Fridlund M., Roxburgh I., Favata F., Volonté S., 2006, in Fridlund M., Baglin A., Lochard J., Conroy L., eds, ESA Special Publication Vol. 1306, The CoRoT Mission Pre-Launch Status - Stellar Seismology and Planet Finding. p. 135
- Gaia Collaboration et al. (2016) Gaia Collaboration et al., 2016, A&A, 595, A1
- Gaia Collaboration et al. (2018) Gaia Collaboration et al., 2018, A&A, 616, A1
- Glebocki & Gnacinski (2005) Glebocki R., Gnacinski P., 2005, VizieR Online Data Catalog, 3244
- Gontcharov (2016) Gontcharov G. A., 2016, Astrophysics, 59, 548
- Gontcharov (2017) Gontcharov G. A., 2017, Astronomy Letters, 43, 472
- Grigahcène et al. (2010) Grigahcène A., et al., 2010, ApJ, 713, L192
- Guzik et al. (2000) Guzik J. A., Kaye A. B., Bradley P. A., Cox A. N., Neuforge C., 2000, ApJ, 542, L57
- Handler et al. (2019) Handler G., et al., 2019, ApJ, 873, L4
- Jenkins et al. (2010) Jenkins J. M., et al., 2010, ApJ, 713, L87
- Kallinger et al. (2004) Kallinger T., Iliev I., Lehmann H., Weiss W. W., 2004, in J. Zverko, J. Ziznovsky, S. J. Adelman, & W. W. Weiss ed., IAU Symposium Vol. 224, The A-Star Puzzle. pp 848–852, doi:10.1017/S1743921305009865, http://adsabs.harvard.edu/abs/2004IAUS..224..848K
- Labadie-Bartz et al. (2019) Labadie-Bartz J., et al., 2019, arXiv e-prints, p. arXiv:1907.11666
- Lata et al. (2014) Lata S., Yadav R. K., Pandey A. K., Richichi A., Eswaraiah C., Kumar B., Kappelmann N., Sharma S., 2014, MNRAS, 442, 273
- Lehmann et al. (1995) Lehmann H., Scholz G., Hildebrandt G., Klose S., Panov K. P., Reimann H.-G., Woche M., Ziener R., 1995, A&A, 300, 783
- Mathias et al. (2001) Mathias P., Aerts C., Briquet M., De Cat P., Cuypers J., Van Winckel H., Le Contel J. M., 2001, A&A, 379, 905
- McNamara (1985) McNamara B. J., 1985, ApJ, 289, 213
- Miglio et al. (2007a) Miglio A., Montalbán J., Dupret M., 2007a, Communications in Asteroseismology, 151, 48
- Miglio et al. (2007b) Miglio A., Montalbán J., Dupret M.-A., 2007b, MNRAS, 375, L21
- Mowlavi et al. (2013) Mowlavi N., Barblan F., Saesen S., Eyer L., 2013, A&A, 554, A108
- Mowlavi et al. (2016) Mowlavi N., Saesen S., Semaan T., Eggenberger P., Barblan F., Eyer L., Ekström S., Georgy C., 2016, A&A, 595, L1
- Murphy et al. (2019) Murphy S. J., Hey D., Van Reeth T., Bedding T. R., 2019, MNRAS, 485, 2380
- Pecaut & Mamajek (2013) Pecaut M. J., Mamajek E. E., 2013, ApJS, 208, 9
- Pedersen et al. (2019) Pedersen M. G., et al., 2019, ApJ, 872, L9
- Percy & Wilson (2000) Percy J. R., Wilson J. B., 2000, PASP, 112, 846
- Pigulski (2005) Pigulski A., 2005, Acta Astron., 55, 219
- Ricker et al. (2015) Ricker G. R., et al., 2015, Journal of Astronomical Telescopes, Instruments, and Systems, 1, 014003
- Rivinius (2013) Rivinius T., 2013, in Suárez J. C., Garrido R., Balona L. A., Christensen-Dalsgaard J., eds, Astronomical Society of the Pacific Conference Series Vol. 31, Stellar Pulsations: Impact of New Instrumentation and New Insights. p. 253 (arXiv:1210.0784), doi:10.1007/978-3-642-29630-7_46
- Salmon et al. (2014) Salmon S. J. A. J., Montalbán J., Reese D. R., Dupret M.-A., Eggenberger P., 2014, A&A, 569, A18
- Samus et al. (2017) Samus N. N., Kazarovets E. V., Durlevich O. V., Kireeva N. N., Pastukhova E. N., 2017, Astronomy Reports, 61, 80
- Soubiran et al. (2016) Soubiran C., Le Campion J.-F., Brouillet N., Chemin L., 2016, A&A, 591, A118
- Stankov & Handler (2005) Stankov A., Handler G., 2005, ApJS, 158, 193
- Stassun et al. (2018) Stassun K. G., et al., 2018, AJ, 156, 102
- Struve (1955) Struve O., 1955, Sky & Telesc., 14, 461
- Szewczuk & Daszyńska-Daszkiewicz (2017) Szewczuk W., Daszyńska-Daszkiewicz J., 2017, MNRAS, 469, 13
- Torres (2010) Torres G., 2010, AJ, 140, 1158
- Walczak et al. (2015) Walczak P., Fontes C. J., Colgan J., Kilcrease D. P., Guzik J. A., 2015, A&A, 580, L9
- White et al. (2017) White T. R., et al., 2017, MNRAS, 471, 2882
- Xiong et al. (2016) Xiong D. R., Deng L., Zhang C., Wang K., 2016, MNRAS, 457, 3163
- Zorec et al. (2016) Zorec J., et al., 2016, A&A, 595, A132
- von Zeipel (1924) von Zeipel H., 1924, MNRAS, 84, 665