LoCuSS: exploring the connection between local environment, star formation and dust mass in Abell 1758
Abstract
We explore the connection between dust and star formation, in the context of environmental effects on galaxy evolution. In particular, we exploit the susceptibility of dust to external processes to assess the influence of dense environment on star-forming galaxies. We have selected cluster Abell 1758 from the Local Cluster Substructure Survey (LoCuSS). Its complex dynamical state is an ideal test-bench to track dust removal and destruction in galaxies due to merger and accretion shocks. We present a systematic panchromatic study (from m with GALEX to m with Herschel) of spectroscopically confirmed star-forming cluster galaxies at intermediate redshift. We observe that the main subclusters (A1758N and A1758S) belong to two separate large-scale structures, with no overlapping galaxy members. Star-forming cluster members are found preferentially outside cluster central regions, and are not isotropically distributed. Rather, these galaxies appear being funneled towards the main subclusters along separate accretion paths. Additionally, we present the first study of dust-to-stellar (DTS) mass ratio used as indicator for local environmental influence on galaxy evolution. Star-forming cluster members show lower mean values (32 at ) of DTS mass ratio and lower levels of infrared emission from birth clouds with respect to coeval star-forming field galaxies. This picture is consistent with the majority of star-forming cluster members infalling in isolation. Upon accretion, star-formation is observed to decrease and warm dust is destroyed due to heating from the intracluster medium radiation, ram-pressure stripping and merger shocks.
keywords:
galaxies: clusters: individual: Abell 1758 – galaxies: evolution – galaxies: star formation1 Introduction
Dust plays an important role in shaping the evolution of galaxies. It acts as a catalyst for the formation of molecular gas, which accumulates in the dense and cold clouds that become the birthplace of stars (Galliano et al. 2018, for a review). Dust is also responsible for reprocessing UV radiation from newly-born stars, resulting in an extinction of light from galaxies at short wavelengths, and a re-emitting of that energy at infrared wavelengths. It is thought that dust formation occurs predominantly via the growth of grains in external layers of AGB star atmospheres and supernovae ejecta, which are later distributed into the interstellar medium by stellar winds.
| Name | Centre (RA, Dec) | N | Redshift | Mass | Radius | Velocity dispersion | |
|---|---|---|---|---|---|---|---|
| (RA, Dec) | [Mpc] | [] | |||||
| A1758N | 203.18848, 50.54294 | 176 | 0.27879 0.0064 | 18.21 3.59c | 2.77 0.18 | 1440 104 | |
| A1758S | 203.13729, 50.41702 | 74 | 0.27386 0.00426 | 7.72 1.50 d | 1.74 0.11 | 1020 78 | |
| A1758-g8 | 203.04446, 50.50874 | 17 | 0.27891 0.00097 | 0.41 0.07 d | 0.65 0.04 | 300 81 |
As it traces the creation of galaxy’s stellar content, and is mixed through the interstellar medium, measurements of the dust content are crucial for understanding why the star formation rate density of universe has declined since and what drives the quenching of star formation. Observations have shown that while star-forming galaxies have high dust content (particularly as a fraction of their stellar mass), passive galaxies do not (Smith et al., 2012). This has been extended by showing that the dust mass of a galaxy directly correlates with the star formation rate (SFR), at least for galaxies in the field (da Cunha et al., 2010). It is not clear what happens to the dust created during star formation, such that it is no longer detected in massive and passive galaxies. It has been proposed that it is destroyed via mechanisms internal to the galaxy, such as supernovae shocks (Jones 2004, for a review), or is driven out of the galaxy by an outflow or consumed less efficiently due to heating from active galactic nuclei (Gobat et al., 2018).
Even more uncertain is what role dust plays in the environmentally driven suppression, or quenching, of star formation. Environmental processes have been shown to affect atomic gas content, resulting in truncated density profiles in the outskirts of galaxies (Davis et al., 2013). Environmental effects on molecular gas, and consequently on dust, are still a subject of debate (Cortese et al. 2012; Koyama et al. 2017), but there are measurements of the spatial distribution of dust in cluster galaxies that are consistent with it having been stripped from the galaxy (Gomez et al. 2010; Walter et al. 2011). Further evidence for differential dust content in clusters and the field were found in the first systematic dust surveys of the Local Universe (Cortese et al., 2012). While this has shown that the dust content of galaxies in clusters is different from that of galaxies in the field, the physical mechanism causing this could be any of: ram pressure stripping (Gunn & Gott 1972; Jablonka et al. 2013), galaxy harassment (Moore et al., 1996), strangulation (Larson et al., 1980) or heating from the intracluster medium (ICM) (Mok et al., 2016).
Clearly, a powerful method to test models of dust formation and destruction, and their relation to star formation, is to examine how key scaling relations, such as between dust and stellar mass and dust mass and star-formation rate, vary in different environments. Furthermore, the cluster’s dynamical state has to be taken into account. Merger events are accompanied by shock fronts, expanding through the ICM, which in turn can affect the gas and dust content in cluster galaxies.
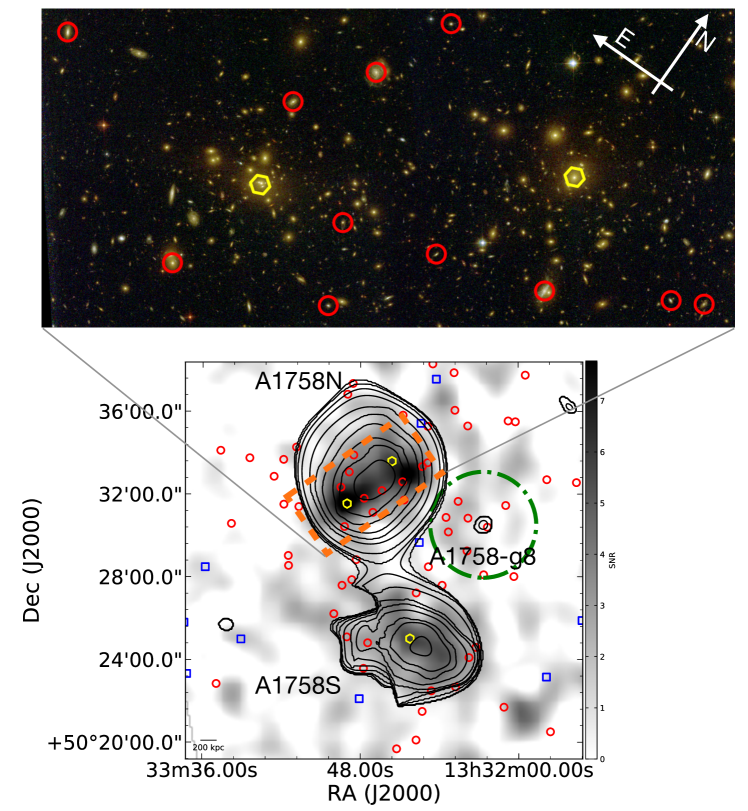
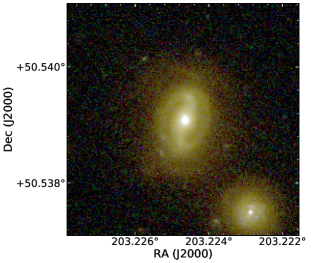
In this paper, we concentrate on a single cluster Abell 1758 (A1758) at , which is known for its complex formation history forged by recent and ongoing mergers of separate clusters (Table 1 and Figure 1). A1758 is therefore an ideal laboratory in which to study the impact of local environment within clusters and cluster dynamics on dust content in member galaxies.
X-ray analysis by David & Kempner (2004) first evidenced the absence of excess X-ray emission between A1758N and S, which originates from merger shocks compressing the ICM. This suggested that A1758N and S have yet to interact with each other. Further analysis of Chandra images revealed that the broadly-peaked X-ray emission to the North is associated with two prominent subclumps A1758NW and A1758NE separated by 800 kpc, and currently receding from each other, being observed some 300 Myr after the first core-passage (David & Kempner, 2004). Recently, Schellenberger et al. (2019) has confirmed this scenario, and additionally identified a shock front on the North side of the sub-cluster A1758NW, best-fit by a supersonic collision with Mach number 1.6, indicating a relative velocity of 2100 . David & Kempner (2004) hypothesized that the South subcluster is further divided into two substructures, that will merge perpendicularly to the plane of the sky (Monteiro-Oliveira et al., 2017; Schellenberger et al., 2019). The scenario of multiple clumps at different stages of merging is also corroborated by numerical simulations by Durret et al. (2011) and Machado et al. (2015). The zoomed-in image on A1758N with Hubble-ACS (Coe et al., 2019) confirms that the majority of cluster members present spheroidal/elliptical morphology. Nevertheless, disc galaxies emerge at increasing distance from the cluster cores. Distinct spiral arms, together with signatures of ram-pressure stripping (Ebeling & Kalita, 2019), indicate that these galaxies are undergoing first encounter with the cluster environment.
This paper is structured in the following manner. In Section 2, we present the datasets used. In Section 3, we present the methods and main results of the data analysis. In Section 4, we discuss the results and future prospects of the project. Throughout this work, we assume , and , and will not explicitly write the base (always 10) of logarithms.
2 Observational Data
A1758 is among the clusters selected for the LoCuSS survey (Smith et al., 2010). As a result, it benefits from the extensive coverage in both wavelength and area with GALEX (FUV and NUV), Subaru/Suprime-Cam ( and bands), UKIRT/WFCAM( and band), mid-infrared 24 with Spitzer/MIPS (reaching 90% completeness at Jy) and far-infrared with Herschel (Haines et al. 2010; Smith et al. 2010; Pereira et al. 2010), both covering fields. In particular, as part of the LoCuSS Open Time Key Program on Herschel A1758 was observed at 100 and 160m with PACS and at , , and with SPIRE (Smith et al., 2010). Herschel flux limits are 13.0, 17.0, 14.0, 18.9, 20.4 mJy from 100 to 500 m at 3 (Rawle et al., 2012a). Additionally, A1758 is part of the the volume-limited high- LoCuSS sub-sample of 50 clusters and has XMM-Newton imaging (see Martino et al. 2014 for further observational details). These observations were utilised to detect 39 new infalling galaxy groups surrounding 23 LoCuSS clusters, captured at their first encounter with the cluster environment (Haines et al., 2018). Furthermore, wide-field (1 degree diameter) optical spectroscopy with MMT/Hectospec was performed, as part of the Arizona Cluster Redshift Survey (ACReS, Haines et al. 2013). ACReS observations provide spectroscopic redshifts for 96% of the sources detected at with Spitzer down to . Archival SDSS and WISE photometry was added to the data pool. In particular, we used the AllWISE Source Catalog, reaching flux limits (at SNR 5) of 54, 71, 730 Jy for 3.4, 4.6 and 12 respectively 111http://.
In this work, we focus on star-forming galaxies, both as cluster members and field galaxies. The sample of coeval field galaxies is included as a benchmark to allow the study of environmental effects on star formation. In particular, we consider those spectroscopically-confirmed cluster member galaxies that are detected at 24m and also lie within the Herschel-PACS footprint. Field galaxies are selected from observations of 5 additional clusters from the LoCuSS survey at , that were observed with Herschel PACS and SPIRE instruments in the exact same way as A1758, that is covering the same sized fields () to the same depths in all five far-IR bands. From these data we select field star-forming galaxies within the redshift range 0.23<z<0.30 after excluding those galaxies within of the mean redshift of cluster members (Haines et al., 2013).
3 Analysis and results
3.1 Number counts
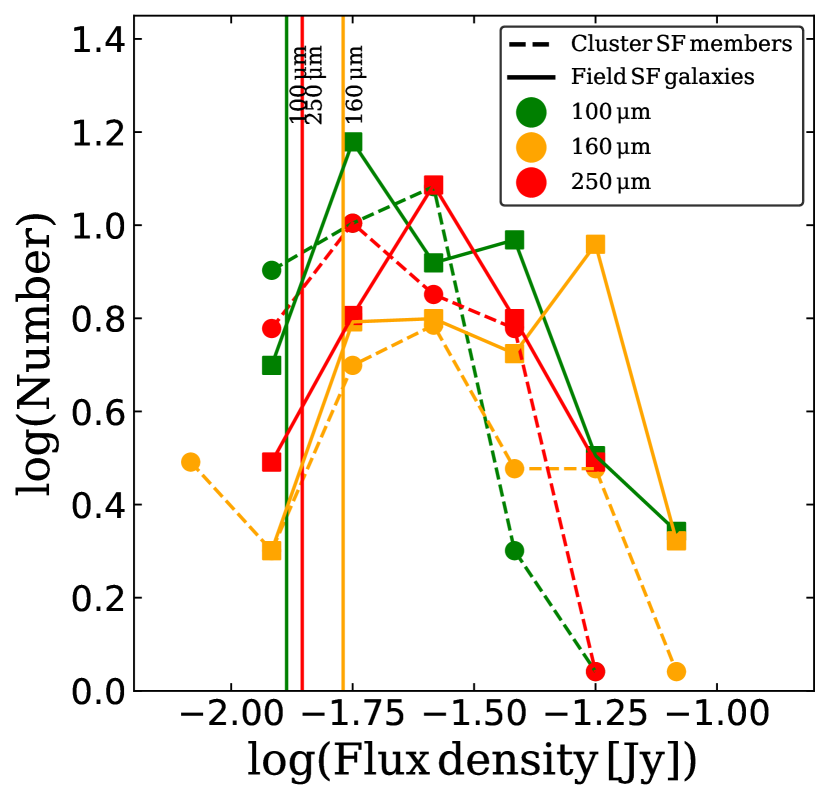
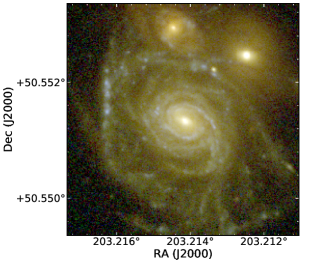
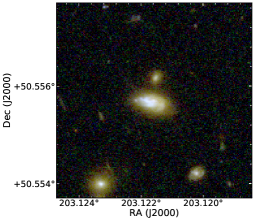
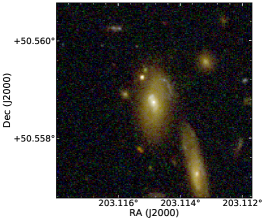
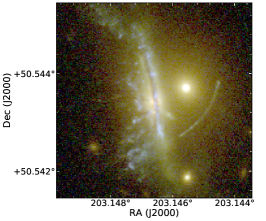
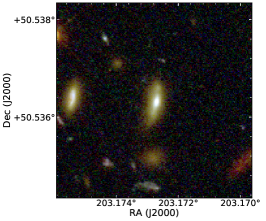
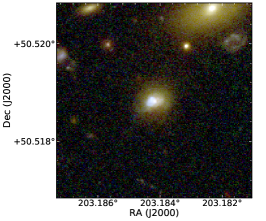
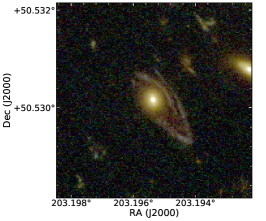
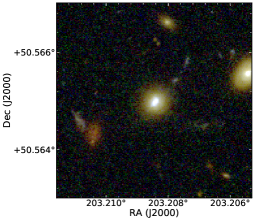
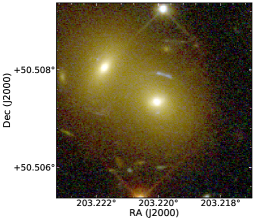
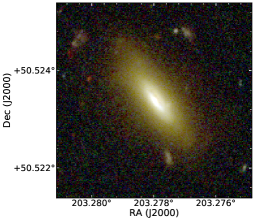
In Figure 2 we plot the number of spectroscopically confirmed star-forming galaxies in the cluster and field samples as a function of flux density in the , , and bands, without any attempt to normalize the counts to the volume surveyed. The number counts of star-forming field galaxies are flatter than the number counts of star-forming clusters galaxies, especially at and , suggesting a dearth of IR-bright galaxies in clusters relative to the field and/or differences in typical spectral shape at these wavelengths between the two samples. Radiation at these wavelengths is characteristic of warm dust surrounding regions of star formation: spiral galaxies discs and arms are the locus of new episodes of star formation, resulting in UV emission from newly born stars which is reprocessed by surrounding dust in the IR, both of which are lacking in typical elliptical galaxies. Typical morphologies of star-forming galaxies can be seen in the left panels of Figure 3 and in the Appendix (Figure 11) confirming the expected spiral morphology.
3.2 Spectral energy distribution modelling
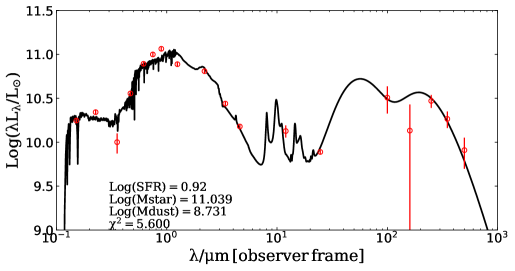
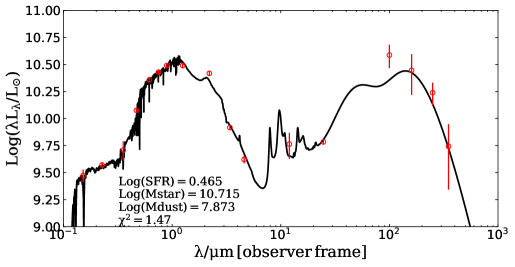
In order to search further discrepancies between cluster and field object, we combined the entire photometric coverage to obtain the spectral energy distribution (SED) of each galaxy. The public code MAGPHYS (Multi-wavelength Analysis of Galaxy Physical Properties) by da Cunha et al. (2008) allows us to derive salient physical parameters of galaxies by fitting mock SED templates to the observed multi-wavelength photometric data.
For each mock template, the radiation of stars, assumed to be the only heating source, is reprocessed by dust through a two-phase grey body model. Stellar emission is computed using the population synthesis model of Bruzual & Charlot (2003) and by assuming a Chabrier (2003) initial mass function, which is restricted to . The dust model includes both dense molecular clouds and a diffuse interstellar medium, following Charlot & Fall (2000), re-emitting the stellar radiation through four separate components at different temperatures. In particular, these models comprise cold (15-25 K) and warm (30-60 K) dust, a hot continuum (130-250 K) from interstellar grains and polycyclic aromatic hydrocarbon emission, the total radiation of which spans between 3 and 1000 m (da Cunha et al. 2008, Clemens et al. 2013). Stellar population and dust models are joined to produce mock SED if they yield similar ISM luminosities, with respect to the total dust emission. The mock SED are fit to the observational data and the fit is evaluated using . The best-fit physical parameters are selected as the median of the probability density of the parameter values weighted by the probability of each fitted mock SED (da Cunha et al. 2008, Clemens et al. 2013).
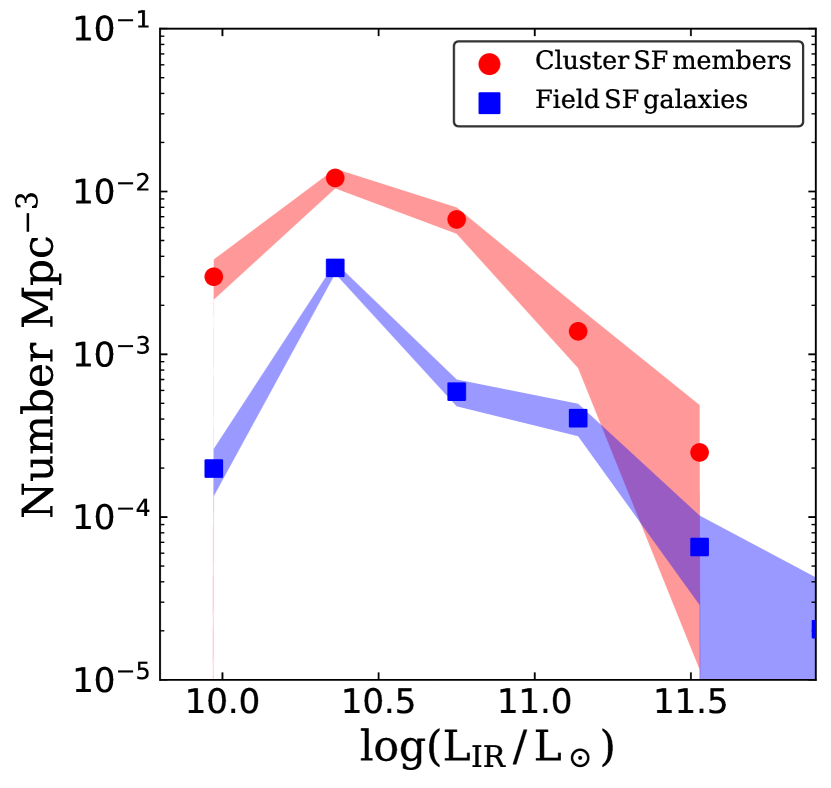
In this work, we utilise estimates of stellar mass , dust mass , total 3-1000 m IR luminosity , the relative contributions to from birth clouds , and star formation rate (see Table LABEL:sed_prop_c and LABEL:sed_prop_f for a list of properties of star-forming cluster and field galaxies, respectively). The flux limits quoted in Section 2 (up to 160 , which encloses the dust emission bump at the redshift considered here) are used as upper limits for the fluxes of the sources with no detection. This helps in constraining the models, in particular at longer wavelength, and avoiding non-physical dust masses. Figure 4 shows that the comoving number density of star-forming cluster galaxies is a factor higher than the comoving number density of star-forming field members. This is not surprising given that galaxy clusters such as A1758 are overdense regions, resulting in high number counts of galaxies per unit volume, compared to the field sample. This holds true also when considering star-forming galaxies, given that the volume studied here includes the wider overdense infall region (see also Haines et al. 2015). In literature, luminous and ultra luminous infrared galaxies (LIRG and ULIRG) are classified for having and , respectively. It is interesting to notice the flatter trend of field star-forming galaxies above , suggesting a higher fraction of luminous infrared galaxies in the field than in the cluster.
We select a final sample of cluster and field star-forming galaxies that satisfy , and . The two samples comprise 90 and 68 cluster and field star-forming galaxies, respectively. This selection extends beyond the level at which the samples can be considered complete; see for example the lowest luminosity bin in Figure 4. The results described in the following sections are insensitive to whether we restrict our samples to be more complete. We interpret this as indicating that any effects of incompleteness at the faint limit of our samples affect both samples in the same manner.
3.3 Dust mass, stellar mass, and SFR distributions
Dissecting stellar and dust masses, and SFR aims at measuring the impact of infall onto cluster on the star formation cycle and how it echoes among these properties. This, when compared to the coeval reference field sample, helps in constraining quenching since dust and stars production/destruction cycle is susceptible to processes acting in different environments.
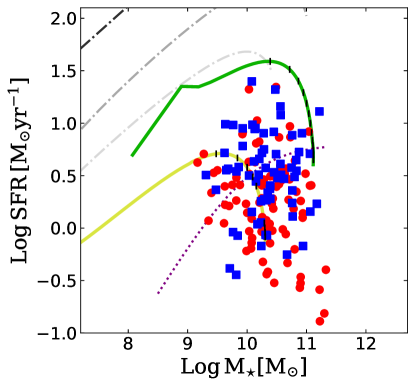
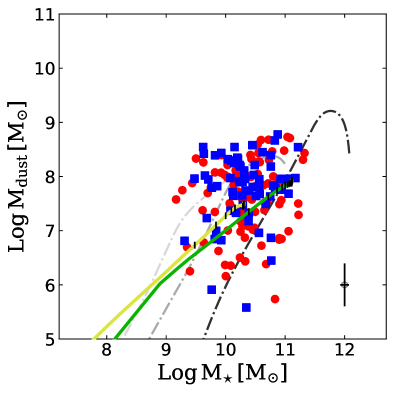
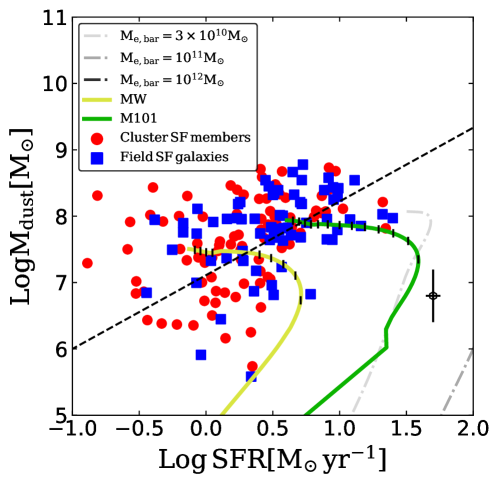
Overall, both cluster and field star-forming galaxies span similar values of stellar and dust mass and SFR, as it can be seen in the different panels of Figure 5. As highlighted by the average errors distributions in each panel of Figure 5, dust masses have higher fractional errors () with respect to stellar masses and SFR (). Despite the high values, such uncertainties are typical for dust mass estimation. In the top-left panel of Figure 5, we can see that our sample presents overall comparable values of stellar mass and star formation rates to the COSMOS low redshift sample (, Lee et al. 2015). A clear correlation can be seen in the bottom panel of Figure 5 between SFR and for cluster and field galaxies. This is not surprising given that dust emission consists of re-processed light from newly formed stars. Our sample shows consistent values of star-formation rate and dust masses with respect to the star-forming galaxies with z < 0.22 from (da Cunha et al., 2010). Interestingly, despite the scatter, field star-forming galaxies show on average higher values of SFR compared to cluster members across the probed stellar mass range, and in particular towards the high mass end. In particular, galaxies with stellar masses of , the mean SFR per unit stellar mass of field and cluster star-forming galaxies is and respectively, at . This is consistent with the discrepancy in specific SFR between cluster and field star-forming galaxies found in Haines et al. (2013), suggesting slow quenching (occurring on timescales between 0.7-2.0 Gyr) of star formation in galaxies upon accretion on clusters.
Despite the difference between the typical SFR of field and cluster star forming galaxies, both populations are more closely described by evolutionary models of spiral galaxies than by proto-spheroidal starburst galaxies. This can be seen in the better agreement of the Milky Way- and M101-like models with our data in Figure 5 than the starburst galaxy models from Calura et al. (2017). These models describe galaxies spanning increasing range of masses. In particular, spheroidal galaxy models assume total baryonic masses of , and . Spiral-like models span approximately 13 Gyr of evolution, while spheroidals are limited to approximately 1 Gyr. For this reason, we display time-steps of 1 Gyr only for spiral-like models. Each model evolution starts at low values of stellar mass and SFR in the top and bottom panels, respectively. This comparison helps highlighting the different evolutionary path between star-forming field galaxies and cluster members. In particular, we can notice the absence of recent starbursting galaxies in our sample, which are much better described by long-lasting star formation history of typical spiral galaxies. In addition, we confirm that dust and stellar masses scale almost indistinguishably, even for vastly different object, and that SFR is a key parameter to better constrain the evolution of these galaxies.
3.4 Spatial and phase space distribution of star-forming cluster galaxies
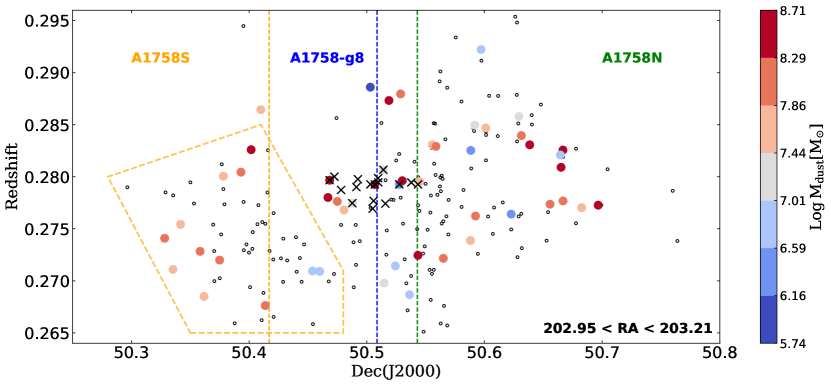
We have already seen in the skymaps shown Figure 1 that star-forming cluster galaxies appear to reside preferentially in the cluster outskirts. We now investigate this further using the redshifts from ACReS to disentangle the memberships of A1758N, A1758S, and A1758-g8. Figure 6 shows the distribution of cluster members in declination versus redshift plane. This display helps to highlight the different components of A1758. To facilitate identification, the declination of the main cluster components, A1758N and S together with A1758-g8, are marked by vertical dashed lines. We can clearly notice a gap in the galaxy distributions belonging to the two clusters A1758N and A1758S, confirming that the two systems have yet to encounter each other and mix their galaxy populations. Furthermore, star forming galaxies are funneled towards A1758N and S not isotropically, but rather along separate accretion paths. Overall, this suggests that A1758N and S belong to two separate virialized dark matter halos, which are not yet connected.
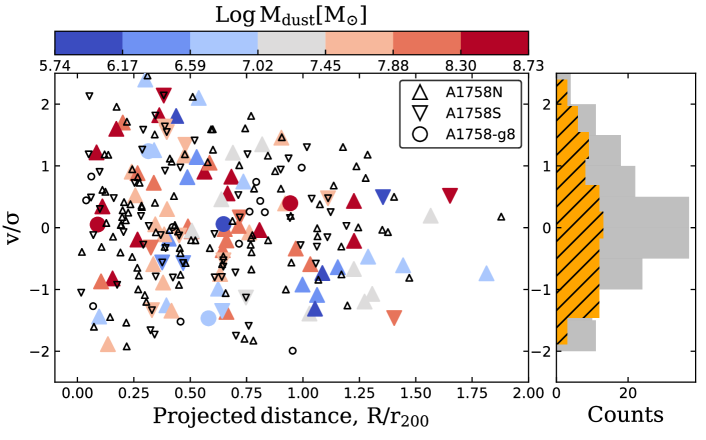
Colour map codes the dust mass of star-forming cluster members. The dearth of star-forming galaxies is evident in the core of both subclusters, together with the increase of dusty galaxies towards the cluster outskirts, which correspond to the outer edge of merger shocks presented in Schellenberger et al. (2019) (see also X-ray countour edge in Figure 1). North of A1758, an elongation in galaxy distribution suggests channels of accretion, potentially filamentary structures, which are not traced by the X-ray emission. Similarly, group members are located perpendicular to the axis connecting A1758N and S, and might suggest a further infall channel toward the northern clump. Star-forming cluster members do not follow the distribution of virialized passive cluster members, as confirmed in Figure 7. In this plot, both clusters A1758N and A1758S, and group members are stacked according to their projected distances from their respective cluster/group centre and velocities with respect to their average halo redshift. In the case of A1758N, the centre is fixed to be half-way between the two northern BCGs, and for A1758S and A1758-g8 the centre corresponds to the coordinates of the southern BCG and X-ray emission peak, respectively. Projected distances and velocities are further scaled by their halo and velocity dispersion , respectively. When compared to the rest of cluster members, star-forming galaxies present a flat distribution of velocities. Velocities displaying a Gaussian distribution peaked around low values are typical of the old virialized population of cluster members. On the other hand, a flatter distribution of velocities is characteristic of infalling objects. The kurtosis of the velocity distribution of star-forming galaxies, which include both clusters and group members, is . which is inconsistent at with the of a Gaussian distribution. Jointly, this shows that star-forming galaxies have been recently accreted onto the cluster potential (Haines et al., 2015).
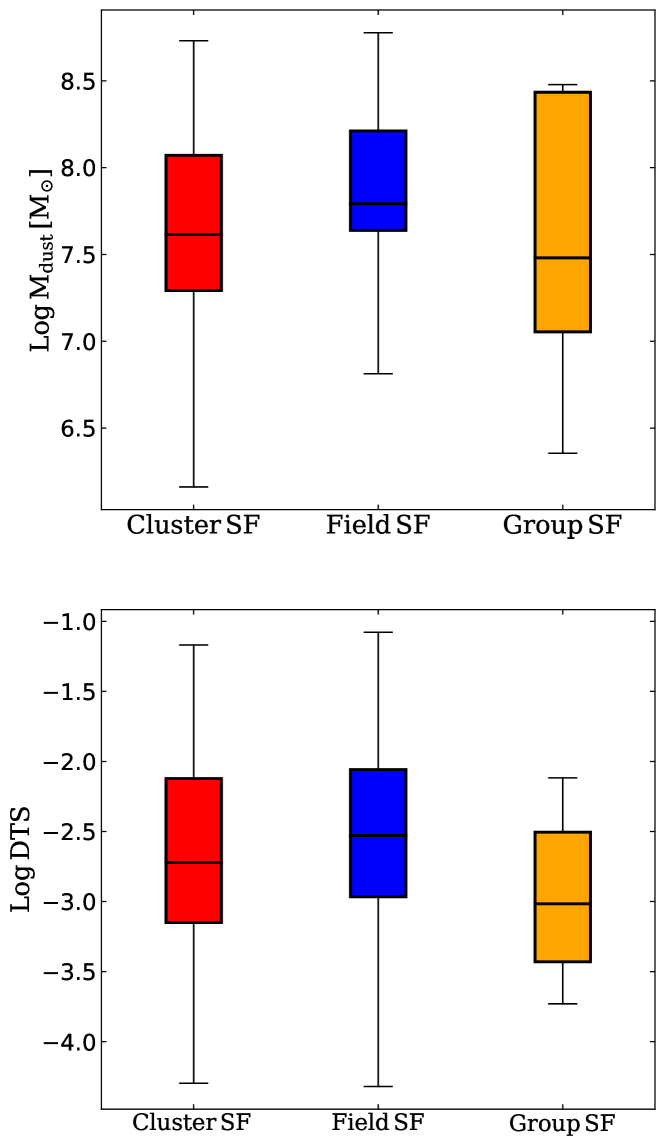
3.5 Dust-to-stellar mass ratio
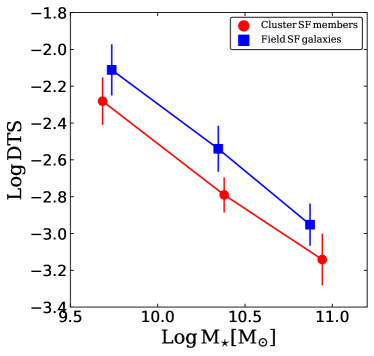
A useful quantity to assess the efficiency of the dust duty-cycle in galaxies is the dust-to-stellar (DTS) mass ratio. This quantity accounts for the amount of dust per unit stellar mass contained in each galaxy. We present here the first study of the DTS ratio for a sample of cluster and field star-forming galaxies at intermediate redshift. We can see the global values of and for cluster, field and group star-forming galaxies in Figure 8. As previously mentioned, star-forming galaxies in both cluster and field present comparable properties, within . More interestingly, subdividing further both samples in bins of stellar mass helps in highlighting a discrepancy between them. Left panel of Figure 9 shows the DTS ratio as a function of . We see a linear trend of the DTS with respect to stellar mass, for both cluster and field galaxies. More massive galaxies have less fierce star formation with respect to smaller ones, per unit stellar mass. In addition, cluster galaxies present lower values of dust per unit stellar mass, suggesting further consumption/destruction due to environment, with respect to field galaxies. Overall, we measure a shift towards lower values of the DTS in cluster galaxies, with respect to field objects, at , when adding together the significance in each bin. Interestingly, the displacement between DTS in field and cluster galaxies parallels that seen in Haines et al. (2013) when comparing specific-SFR of cluster and field star-forming galaxies.
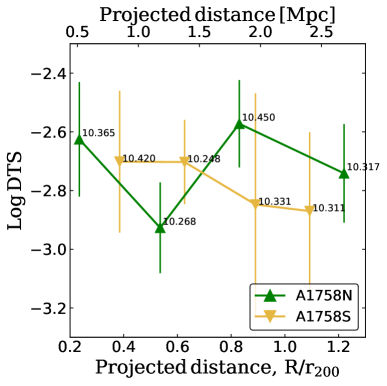
Right panel of Figure 9 shows the DTS of the the stacked population of cluster star-forming members according to their projected distance from both A1758N and A1758S centres, as computed for Figure 7. This plot shows that among star-forming cluster members there is no strong radial trend of the DTS ratio. A dip in the DTS profile can be seen around with respect to the northern centre. This distance corresponds to the location of A1758-g8 (see Figure 6), in the case of A1758N. We notice that the DTS value for star-forming cluster members in this bin would be further decreased with the inclusion of group star-forming members, suggesting that group galaxies have lower values of DTS, compared to the average population of star-forming cluster members at that clustercentric distance. We also report that no significant mass segregation is evident among star-forming cluster members, as shown by the average stellar masses in each bin in the right panel of Figure 9.
3.6 Spectral shape: cluster versus field
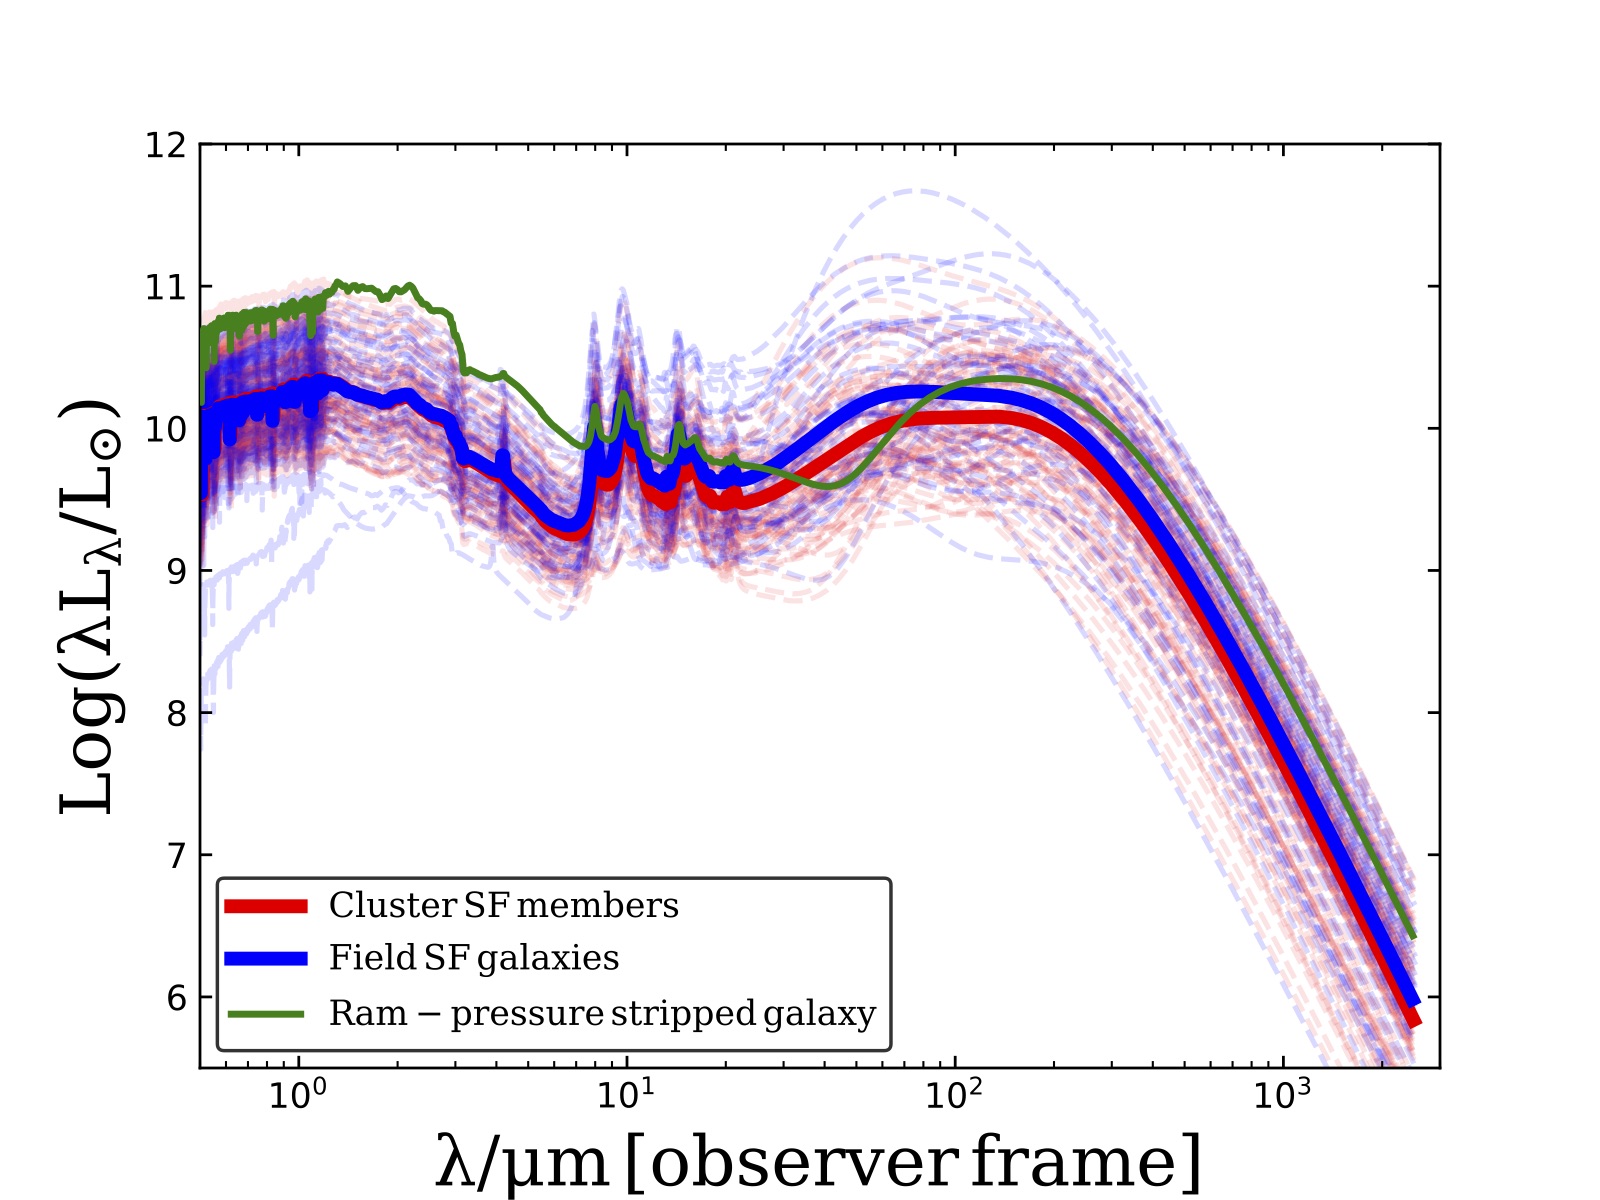
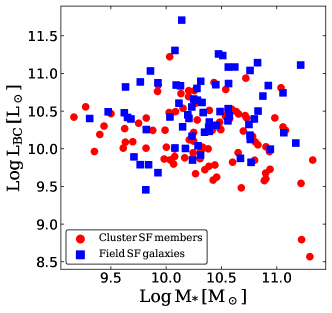
Notwithstanding the large scatter among the cluster and field star-forming galaxies, the mean SED of each galaxy sample shows a clear difference at , with cluster galaxies being fainter than field galaxies (left panel of Figure 10). Emission at these wavelengths is dominated by warm dust, polycyclic aromatic hydrocarbides and mid-infrared continuum, which are preferentially located in the surroundings of birth clouds (da Cunha et al., 2008). Therefore emission from these components appears reduced in cluster star-forming galaxies with respect to coeval field objects. Furthermore, we overplot our SED of the ram-pressure stripped galaxy from Ebeling & Kalita (2019). The dip in the SED of this galaxy at shows that the emission from birth clouds is reduced in this galaxy, suggesting ram-pressure stripping as a channel for dust removal/destruction. This is further supported by the comparison of IR luminosity from stellar birth clouds (dominated by the diffuse warm dust component) with stellar mass for cluster and field galaxies in Figure 10. At a fixed stellar mass, field star-forming galaxies have higher than cluster star-forming galaxies.
4 Summary and discussion
We aim to progress the current knowledge on star-formation quenching by studying how dust in star-forming galaxies is affected by the local environment within clusters. In particular, this work is the first to explore dust evolution in a sample of star-forming galaxies in the dynamically complex cluster A1758 and across its main substructures. A1758 allows us to assess the effect of merger-induced shocks on star-formation and dust properties of clusters members. Uniquely, the LoCuSS dataset used here allows for a direct comparison between star-forming cluster members with a coeval sample of mass-matched star-forming field galaxies. Specifically for A1758, our data span far-UV to far-IR wavelengths and include imaging with GALEX, Subaru, SDSS, UKIRT, WISE, Spitzer, and Herschel, plus 96% complete spectroscopic follow-up of candidate star-forming galaxies from ACReS observations with Hectospec on MMT. Galaxies considered here have been selected for having , .
We find that star-forming galaxies, whether located in clusters or in field, span a similar range of stellar and dust masses, whilst the IR luminosity and SFR of star-forming cluster galaxies are lower than star-forming field galaxies. The dust-to-stellar mass ratio (DTS) of cluster star-forming galaxies is a factor lower than that of field star-forming galaxies at significance. This result implies an effect of the cluster environment on both the dust content, and the SFR of star-forming galaxies. Among cluster members, DTS appears to vary little with respect to clustercentric distance in both the north and south part of the cluster, with the exception of galaxies within an infalling X-ray group which overall have lower values of dust per unit stellar mass.
Galaxy members of A1758N and S are distributed separately in position and redshift space, suggesting that the two subclusters belong to separate virialized dark matter halos. This is further confirmed by analysing the distribution of star-forming galaxies. Star-forming members are distributed towards the cluster outskirts, distant from the actively merging cores of A1758N, A1758S and the merger shocks. These galaxies are being accreted along separate accretion paths, rather than isotropically. We verified the absence of additional virialized substructures associated to star-forming cluster member, via a comparison with diffuse X-ray emission and weak lensing mass maps from Haines et al. (2018) and Okabe & Smith (2016), respectively. This suggests that these galaxies are infalling in isolation. Isolated galaxies do not suffer from pre-processing in groups prior to their infall, thus preserving field-like properties. The combination of position and velocity classifies the majority of cluster star-forming members as recent or back-splash infallers, i.e. approaching or receding from their first encounter with the cluster core (Haines et al., 2015). These galaxies have spent limited time in the harsh ICM, whereas galaxies infalling within the group have already being processed by the hot intragroup medium. This has been proven effective in reducing the SFR (Bianconi et al., 2018), and appears to similarly influence the dust content of galaxies.
Our study extends to higher redshift recent findings on dust consumption and destruction from observational campaigns on local clusters (Cortese et al., 2010), which showed evidences of truncation in the radial distribution of multi-phase gas and dust harboured in discs of star-forming galaxies. This suggests outside-in removal processes due to the cluster environment (Rawle et al. 2012b; Finn et al. 2018). Overall, the bulk of dust mass, which is locked in cold clumps preferentially within the plane of galaxies, appears unaffected by the cluster environment on the timescales considered here. We observe primarily the decrease emission from warm dust grains in cluster galaxies with respect to field objects. This reflects the reduction of ionizing radiation from newly born stars, following the decrease of SFR, but also has been associated to the destruction of small, not shielded, dust grains due to ICM emission (Bocchio 2014; Gjergo et al. 2018). Sputtering is proposed to destroy dust grains on very short () timescales. For sputtering to be effective, dust has to be removed from the galactic plane where it is shielded from the surrounding ICM radiation. Dust in cluster galaxies is prone to being removed or destroyed by ram-pressure or shocks passing through the galaxy, resulting in the dearth of infrared luminous galaxies in the cluster cores. Hence, the timescale of ram-pressure stripping () is dominating sputtering of dust particles. Interestingly, detailed thermal conduction formalism has been recently included in the framework of cosmological simulations, showing its efficiency in distributing the energy from the hot ICM into galaxies and reducing their star formation (Kannan et al., 2017).
We present here a systematic panchromatic study of spectroscopically confirmed star-forming cluster galaxies at intermediate redshift, which allows us to explore in detail the connection between local environment, star formation and dust. In this work, we conclude that A1758 is confirmed to be an actively evolving cluster, composed of two main subsystems North and South which belong to dynamically separated large-scale structures, and are accreting galaxies along separate paths, rather than isotropically. We observe the effect of the local cluster environment echoing among the properties of star-forming members, which include morphology, star formation rate, dust emission and masses. In particular, star-forming cluster members present diminished values of star formation and dust masses with respect to a coeval sample of star-forming field galaxies. We measure directly a decrease in the emission of birth clouds in star-forming cluster members, with respect to field galaxies. This suggests that the timescale for transformation upon accretion to the cluster is slow. Among the proposed mechanisms responsible for the transformation, we include ram-pressure stripping, harassment, strangulation, heat conduction from the ICM and ICM shocks removing/destroying dust in recently accreted galaxies.
Acknowledgements
MB, GPS, and SLM acknowledge support from the Science and Technology Facilities Council through grant number ST/N021702/1. CPH acknowledges the hospitality of the University of Birmingham while part of this work was completed. MB acknowledges Francesco Calura for the helpful discussions and for providing the theoretical evolutionary tracks from Calura et al. (2017).
Appendix A Physical properties of star-forming galaxies
In this section, we include additional postage stamps of star-forming cluster members covered by HST-ACS imaging from the RELICS survey (Coe et al., 2019) and tables with RA, Dec, redshift, , , , , of both cluster and field star-forming galaxies.
| RA(J2000) | Dec(J2000) | Redshift | ||||
| 203.12963 | 50.33531 | 0.27110 | 10.391 | 10.908 | 7.666 | 0.494 |
| 203.12941 | 50.45387 | 0.27095 | 10.940 | 10.199 | 6.848 | 0.141 |
| 203.12189 | 50.35836 | 0.27283 | 10.027 | 10.563 | 7.979 | 0.631 |
| 203.11398 | 50.47497 | 0.27763 | 10.539 | 11.157 | 8.047 | 0.865 |
| 203.11030 | 50.37495 | 0.27199 | 10.800 | 10.271 | 8.002 | -0.202 |
| 203.09656 | 50.46001 | 0.27091 | 10.323 | 10.151 | 6.871 | 0.075 |
| 203.08867 | 50.50301 | 0.28861 | 10.830 | 10.061 | 5.738 | 0.347 |
| 203.07966 | 50.37811 | 0.28005 | 9.698 | 10.305 | 7.695 | 0.211 |
| 203.06505 | 50.48767 | 0.27746 | 10.484 | 10.598 | 7.054 | 0.481 |
| 203.06269 | 50.40175 | 0.28260 | 11.080 | 10.777 | 8.710 | 0.408 |
| 203.05391 | 50.40992 | 0.28645 | 9.272 | 10.730 | 7.747 | 0.707 |
| 203.04403 | 50.46844 | 0.27967 | 10.983 | 10.740 | 8.478 | 0.519 |
| 203.03925 | 50.50684 | 0.27926 | 10.551 | 10.762 | 8.434 | 0.534 |
| 203.01853 | 50.36170 | 0.26850 | 9.166 | 10.516 | 7.577 | 0.625 |
| 203.00579 | 50.46699 | 0.27801 | 11.300 | 10.422 | 8.310 | -0.813 |
| 202.87102 | 50.45685 | 0.27339 | 10.307 | 10.155 | 7.589 | -0.065 |
| 202.95994 | 50.34179 | 0.27543 | 10.806 | 10.478 | 7.842 | 0.643 |
| 203.49093 | 50.58055 | 0.27081 | 10.601 | 10.180 | 6.724 | -0.012 |
| 203.53539 | 50.62541 | 0.27015 | 10.244 | 10.268 | 7.386 | -0.034 |
| 203.55738 | 50.59745 | 0.27091 | 9.612 | 10.355 | 7.376 | 0.046 |
| 203.09154 | 50.51471 | 0.26978 | 10.457 | 10.283 | 7.018 | -0.522 |
| 203.06382 | 50.51408 | 0.28067 | 10.380 | 10.361 | 7.081 | 0.041 |
| 203.01598 | 50.52427 | 0.27143 | 10.900 | 10.269 | 6.835 | -0.525 |
| 203.07623 | 50.52762 | 0.27927 | 10.085 | 10.512 | 6.355 | -0.094 |
| 202.92631 | 50.54256 | 0.27991 | 10.698 | 10.541 | 7.548 | 0.270 |
| 202.96385 | 50.54498 | 0.27954 | 10.255 | 10.795 | 7.619 | 0.104 |
| 203.12158 | 50.55571 | 0.28307 | 9.751 | 10.536 | 7.796 | 0.412 |
| 203.11484 | 50.55878 | 0.28292 | 10.425 | 10.238 | 7.992 | -0.024 |
| 203.11450 | 50.58810 | 0.27387 | 10.203 | 10.785 | 7.669 | 0.436 |
| 203.06396 | 50.58839 | 0.28253 | 9.990 | 10.261 | 6.368 | -0.218 |
| 203.00356 | 50.59170 | 0.28496 | 10.495 | 10.652 | 7.349 | 0.395 |
| 203.01275 | 50.59240 | 0.27623 | 10.204 | 10.984 | 8.082 | 0.824 |
| 202.90261 | 50.59530 | 0.27387 | 10.574 | 10.855 | 8.265 | 0.453 |
| 202.93216 | 50.70218 | 0.27619 | 10.537 | 10.753 | 8.590 | 0.419 |
| 202.92527 | 50.69716 | 0.28016 | 10.594 | 10.860 | 8.674 | 0.569 |
| 203.08024 | 50.60107 | 0.28469 | 10.441 | 10.542 | 7.575 | 0.186 |
| 203.12514 | 50.68257 | 0.27703 | 10.487 | 10.793 | 7.817 | 1.345 |
| 203.12229 | 50.66669 | 0.28257 | 10.433 | 10.973 | 8.323 | 0.282 |
| 203.09918 | 50.66675 | 0.27768 | 10.266 | 10.103 | 7.920 | -0.322 |
| 203.13003 | 50.66507 | 0.28091 | 10.721 | 11.202 | 8.679 | 0.970 |
| 203.08016 | 50.66446 | 0.28209 | 10.036 | 10.081 | 7.003 | -0.030 |
| 202.86317 | 50.65987 | 0.27462 | 9.818 | 10.415 | 7.346 | 0.263 |
| 203.10397 | 50.65570 | 0.27736 | 9.820 | 10.605 | 8.076 | 0.481 |
| 203.10819 | 50.63843 | 0.28307 | 10.077 | 10.389 | 8.304 | -0.140 |
| 202.99090 | 50.62927 | 0.28579 | 11.225 | 10.347 | 7.292 | -0.888 |
| 203.08126 | 50.63134 | 0.28396 | 9.982 | 10.241 | 8.031 | 0.231 |
| 202.87612 | 50.61704 | 0.27357 | 9.631 | 10.214 | 6.782 | 0.222 |
| 203.25648 | 50.27521 | 0.27551 | 10.002 | 10.040 | 6.161 | 0.146 |
| 203.29989 | 50.25200 | 0.27560 | 10.782 | 10.533 | 8.463 | 0.185 |
| 203.14659 | 50.54345 | 0.27245 | 10.728 | 10.643 | 8.307 | 0.867 |
| 203.14596 | 50.59712 | 0.29223 | 10.249 | 10.339 | 6.983 | 0.284 |
| 203.14467 | 50.52873 | 0.28796 | 10.041 | 10.728 | 7.994 | 0.514 |
| 203.17298 | 50.69662 | 0.27727 | 9.928 | 11.029 | 8.396 | 0.916 |
| 203.17278 | 50.53634 | 0.26867 | 9.351 | 10.058 | 6.695 | 0.071 |
| 203.18419 | 50.51884 | 0.28733 | 9.501 | 10.646 | 8.332 | 0.551 |
| 203.19533 | 50.53015 | 0.27962 | 10.416 | 10.667 | 8.398 | 0.233 |
| 203.21420 | 50.55136 | 0.28499 | 11.039 | 11.031 | 8.731 | 0.920 |
| 203.20845 | 50.56501 | 0.27216 | 9.438 | 10.467 | 7.880 | 0.527 |
| 203.20933 | 50.62268 | 0.27641 | 9.400 | 10.227 | 6.251 | 0.336 |
| 203.21614 | 50.61397 | 0.28869 | 11.326 | 10.576 | 8.433 | -0.397 |
| 203.22014 | 50.50737 | 0.28072 | 11.220 | 10.238 | 7.501 | -0.587 |
| 203.22470 | 50.53909 | 0.26592 | 10.715 | 10.750 | 7.873 | 0.465 |
| 203.24412 | 50.65999 | 0.27289 | 10.935 | 10.174 | 7.563 | 0.099 |
| 203.27799 | 50.52339 | 0.28521 | 10.902 | 10.219 | 6.862 | -0.466 |
| 203.47682 | 50.59392 | 0.26896 | 10.655 | 10.679 | 7.522 | 0.567 |
| 203.47320 | 50.57590 | 0.27184 | 11.057 | 10.344 | 6.991 | 0.405 |
| 203.47313 | 50.61701 | 0.26945 | 10.329 | 10.070 | 6.434 | -0.439 |
| 203.37712 | 50.56861 | 0.26912 | 10.153 | 10.676 | 7.989 | 0.808 |
| 203.44903 | 50.65999 | 0.27299 | 10.680 | 9.840 | 6.383 | -0.332 |
| 203.36335 | 50.50971 | 0.27526 | 10.168 | 10.474 | 8.112 | 1.025 |
| 203.28109 | 50.57133 | 0.28197 | 9.625 | 10.524 | 8.261 | 0.398 |
| 203.34024 | 50.56264 | 0.28453 | 10.240 | 10.165 | 6.504 | 0.046 |
| 203.29700 | 50.52530 | 0.27935 | 10.209 | 10.331 | 7.720 | 0.244 |
| 203.29734 | 50.56141 | 0.27204 | 10.134 | 10.891 | 7.844 | 0.629 |
| 203.30944 | 50.54776 | 0.26924 | 10.067 | 10.160 | 7.505 | -0.194 |
| 202.74531 | 50.51142 | 0.27869 | 10.903 | 10.659 | 7.490 | 0.259 |
| 202.77619 | 50.54283 | 0.27376 | 10.387 | 10.013 | 7.336 | -0.144 |
| 202.72388 | 50.40450 | 0.27296 | 10.249 | 10.482 | 7.171 | 0.407 |
| 203.29128 | 50.48398 | 0.27714 | 10.350 | 10.297 | 8.018 | -0.417 |
| 203.20539 | 50.48067 | 0.27680 | 10.077 | 10.274 | 7.478 | 0.090 |
| 203.44439 | 50.47987 | 0.27542 | 9.922 | 10.929 | 8.071 | 0.896 |
| 203.29094 | 50.47598 | 0.29022 | 9.879 | 10.353 | 6.626 | 0.411 |
| 203.21088 | 50.46454 | 0.26757 | 10.281 | 10.437 | 7.084 | 0.463 |
| 203.22324 | 50.46001 | 0.27721 | 10.310 | 10.537 | 7.300 | -0.009 |
| 203.23358 | 50.43712 | 0.28032 | 10.651 | 10.301 | 7.379 | -0.057 |
| 203.21713 | 50.41843 | 0.27916 | 10.635 | 10.806 | 7.839 | 0.515 |
| 203.19079 | 50.41370 | 0.26762 | 10.265 | 10.715 | 7.960 | 0.414 |
| 203.15416 | 50.32823 | 0.27409 | 10.559 | 10.735 | 8.279 | 0.595 |
| 203.38212 | 50.38065 | 0.26707 | 10.032 | 11.429 | 8.213 | 1.323 |
| 203.19602 | 50.39308 | 0.28044 | 10.888 | 10.201 | 7.914 | -0.568 |
| RA(J2000) | Dec(J2000) | Redshift | ||||
| 203.12549 | 50.49451 | 0.23277 | 9.841 | 10.021 | 6.997 | -0.072 |
| 202.91964 | 50.43139 | 0.24818 | 10.672 | 10.453 | 7.494 | -0.253 |
| 202.96486 | 50.38590 | 0.23292 | 11.064 | 10.661 | 7.959 | 0.157 |
| 203.12311 | 50.59055 | 0.24985 | 10.234 | 10.553 | 8.213 | 0.256 |
| 203.08076 | 50.71770 | 0.24995 | 10.571 | 10.774 | 7.678 | 0.508 |
| 203.01838 | 50.70767 | 0.24926 | 9.682 | 10.485 | 7.234 | 0.566 |
| 203.10381 | 50.62614 | 0.29538 | 9.816 | 9.881 | 6.846 | -0.445 |
| 203.14128 | 50.71727 | 0.24950 | 11.217 | 11.474 | 8.542 | 1.112 |
| 203.44016 | 50.61321 | 0.26022 | 10.311 | 10.293 | 8.111 | -0.064 |
| 203.39635 | 50.47473 | 0.24962 | 10.249 | 10.918 | 8.184 | 0.717 |
| 203.42308 | 50.42994 | 0.24905 | 10.454 | 10.750 | 7.808 | 0.532 |
| 203.35097 | 50.41664 | 0.24969 | 10.091 | 11.015 | 8.294 | 0.985 |
| 203.20135 | 50.36860 | 0.25973 | 10.335 | 10.545 | 7.737 | -0.070 |
| 203.41938 | 50.38865 | 0.23322 | 10.449 | 11.118 | 8.579 | 0.917 |
| 250.05125 | 46.77683 | 0.27764 | 10.325 | 10.718 | 7.955 | 0.266 |
| 250.07478 | 46.88606 | 0.27239 | 10.174 | 10.362 | 7.329 | 0.037 |
| 249.97753 | 46.88248 | 0.26509 | 10.116 | 10.871 | 7.714 | 0.636 |
| 249.93895 | 46.85836 | 0.25392 | 10.034 | 10.656 | 8.320 | 0.501 |
| 249.85594 | 46.83027 | 0.28305 | 10.129 | 11.019 | 7.645 | 0.945 |
| 250.43362 | 46.79677 | 0.27245 | 9.858 | 11.078 | 7.821 | 0.582 |
| 250.44185 | 46.76573 | 0.25299 | 10.565 | 11.162 | 7.950 | 1.078 |
| 250.06733 | 46.58628 | 0.24598 | 10.488 | 10.742 | 8.211 | 0.705 |
| 250.01354 | 46.59893 | 0.26302 | 10.831 | 10.809 | 7.788 | 0.547 |
| 250.29164 | 46.65747 | 0.26260 | 10.759 | 11.213 | 8.393 | 0.885 |
| 250.15680 | 46.64951 | 0.26406 | 10.313 | 11.061 | 8.007 | 0.574 |
| 250.38557 | 46.63302 | 0.26051 | 9.765 | 9.803 | 5.910 | -0.038 |
| 250.22619 | 46.63078 | 0.26244 | 10.149 | 10.702 | 8.543 | 0.445 |
| 250.12356 | 46.49810 | 0.26205 | 10.474 | 11.497 | 8.029 | 1.321 |
| 250.15085 | 46.52782 | 0.25423 | 10.561 | 10.833 | 7.826 | 0.612 |
| 250.04227 | 46.48227 | 0.26596 | 11.173 | 10.485 | 7.971 | 0.231 |
| 250.17092 | 46.45124 | 0.28477 | 9.633 | 11.004 | 8.421 | 0.990 |
| 250.17490 | 46.42400 | 0.26076 | 10.289 | 10.223 | 7.476 | 0.274 |
| 322.45662 | 0.09840 | 0.28836 | 10.279 | 11.016 | 7.651 | 0.904 |
| 322.22652 | -0.01701 | 0.29040 | 10.621 | 11.161 | 8.450 | 0.470 |
| 322.23550 | 0.00328 | 0.28951 | 10.749 | 10.490 | 7.632 | 0.576 |
| 322.26192 | -0.07151 | 0.28237 | 9.476 | 10.604 | 7.961 | 0.365 |
| 322.31268 | -0.07008 | 0.28984 | 10.385 | 10.400 | 7.178 | 0.375 |
| 322.55007 | 0.05568 | 0.27415 | 9.651 | 10.628 | 8.017 | 0.553 |
| 322.45448 | -0.00827 | 0.28122 | 10.512 | 11.333 | 7.641 | 0.477 |
| 126.70602 | 4.25056 | 0.28282 | 10.798 | 10.579 | 7.833 | 0.488 |
| 126.68767 | 4.26693 | 0.27627 | 10.080 | 11.476 | 7.971 | 1.398 |
| 126.58493 | 4.44359 | 0.28403 | 10.559 | 10.530 | 6.961 | 0.492 |
| 126.68624 | 4.15960 | 0.27666 | 10.761 | 10.148 | 6.869 | 0.359 |
| 126.68559 | 4.11816 | 0.26170 | 11.057 | 11.160 | 7.682 | 0.709 |
| 135.14587 | 21.10720 | 0.28624 | 10.347 | 10.227 | 5.582 | 0.338 |
| 135.04694 | 21.02492 | 0.27581 | 10.924 | 11.098 | 7.957 | 0.905 |
| 135.37527 | 20.93561 | 0.27862 | 9.308 | 10.450 | 6.813 | 0.506 |
| 203.95883 | 41.22924 | 0.26982 | 10.875 | 10.989 | 8.777 | 0.725 |
| 203.53119 | 41.15471 | 0.29399 | 10.239 | 10.249 | 7.895 | -0.171 |
| 203.77227 | 41.04787 | 0.25878 | 10.390 | 10.630 | 7.326 | 0.279 |
| 203.55147 | 41.08073 | 0.25945 | 9.709 | 10.616 | 7.946 | -0.384 |
| 203.65717 | 41.17331 | 0.29746 | 10.562 | 11.307 | 7.853 | 1.160 |
| 203.66612 | 41.16584 | 0.29690 | 10.942 | 10.566 | 7.756 | -0.171 |
| 203.79205 | 41.14138 | 0.29659 | 10.390 | 10.581 | 7.740 | 0.406 |
| 203.86673 | 41.00258 | 0.29197 | 10.768 | 10.109 | 6.448 | 0.111 |
| 203.93678 | 41.16624 | 0.26600 | 9.926 | 11.084 | 8.435 | 0.951 |
| 204.07297 | 41.08957 | 0.29784 | 10.758 | 10.563 | 8.183 | 0.240 |
| 204.05708 | 41.04166 | 0.29757 | 10.232 | 10.660 | 7.913 | 0.054 |
| 203.82568 | 40.84622 | 0.27306 | 9.926 | 10.232 | 6.825 | 0.783 |
| 203.58752 | 40.95970 | 0.27346 | 10.196 | 10.684 | 8.348 | 0.510 |
| 204.02733 | 40.97041 | 0.29209 | 10.141 | 11.756 | 8.250 | 0.955 |
| 204.03830 | 40.94977 | 0.29686 | 9.821 | 10.528 | 8.392 | 0.540 |
| 203.96866 | 40.95030 | 0.29159 | 10.080 | 10.115 | 7.368 | 0.154 |
| 204.01956 | 40.93465 | 0.29769 | 9.766 | 11.048 | 7.793 | 0.983 |
| 203.97250 | 40.91645 | 0.28238 | 10.827 | 11.255 | 8.665 | 0.649 |
| 204.11808 | 40.84244 | 0.29926 | 10.206 | 10.611 | 8.324 | 0.660 |
| 204.10542 | 40.85266 | 0.29958 | 10.283 | 10.737 | 7.900 | 0.751 |
| 204.04023 | 40.86997 | 0.27133 | 9.622 | 10.757 | 8.544 | 0.717 |
References
- Bianconi et al. (2018) Bianconi M., Smith G. P., Haines C. P., McGee S. L., Finoguenov A., Egami E., 2018, MNRAS, 473, L79
- Bocchio (2014) Bocchio M., 2014, PhD thesis, Institut d’Astrophysique Spatiale (IAS), UMR 8617, CNRS/Université Paris-Sud, 91405 Orsay, France
- Bruzual & Charlot (2003) Bruzual G., Charlot S., 2003, MNRAS, 344, 1000
- Calura et al. (2017) Calura F., et al., 2017, MNRAS, 465, 54
- Chabrier (2003) Chabrier G., 2003, PASP, 115, 763
- Charlot & Fall (2000) Charlot S., Fall S. M., 2000, ApJ, 539, 718
- Clemens et al. (2013) Clemens M. S., et al., 2013, MNRAS, 433, 695
- Coe et al. (2019) Coe D., et al., 2019, arXiv e-prints, p. arXiv:1903.02002
- Cortese et al. (2010) Cortese L., et al., 2010, A&A, 518, L49
- Cortese et al. (2012) Cortese L., et al., 2012, A&A, 540, A52
- David & Kempner (2004) David L. P., Kempner J., 2004, ApJ, 613, 831
- Davis et al. (2013) Davis T. A., et al., 2013, MNRAS, 429, 534
- Durret et al. (2011) Durret F., Laganá T. F., Haider M., 2011, A&A, 529, A38
- Ebeling & Kalita (2019) Ebeling H., Kalita B. S., 2019, arXiv e-prints, p. arXiv:1907.12781
- Finn et al. (2018) Finn R. A., et al., 2018, ApJ, 862, 149
- Galliano et al. (2018) Galliano F., Galametz M., Jones A. P., 2018, ARA&A, 56, 673
- Gjergo et al. (2018) Gjergo E., Granato G. L., Murante G., Ragone-Figueroa C., Tornatore L., Borgani S., 2018, MNRAS, 479, 2588
- Gobat et al. (2018) Gobat R., et al., 2018, Nature Astronomy, 2, 239
- Gomez et al. (2010) Gomez H. L., et al., 2010, A&A, 518, L45
- Gunn & Gott (1972) Gunn J. E., Gott III J. R., 1972, ApJ, 176, 1
- Haines et al. (2010) Haines C. P., Smith G. P., Pereira M. J., Egami E., Moran S. M., Hardegree-Ullman E., Rawle T. D., Rex M., 2010, A&A, 518, L19
- Haines et al. (2013) Haines C. P., Pereira M. J., et al. S., 2013, ApJ, 775, 126
- Haines et al. (2015) Haines C. P., Pereira M. J., et al. S., 2015, ApJ, 806, 101
- Haines et al. (2018) Haines C. P., et al., 2018, MNRAS, 477, 4931
- Jablonka et al. (2013) Jablonka P., Combes F., Rines K., Finn R., Welch T., 2013, A&A, 557, A103
- Jones (2004) Jones A. P., 2004, in Witt A. N., Clayton G. C., Draine B. T., eds, Astronomical Society of the Pacific Conference Series Vol. 309, Astrophysics of Dust. p. 347
- Kannan et al. (2017) Kannan R., Vogelsberger M., Pfrommer C., Weinberger R., Springel V., Hernquist L., Puchwein E., Pakmor R., 2017, ApJ, 837, L18
- Koyama et al. (2017) Koyama S., et al., 2017, ApJ, 847, 137
- Larson et al. (1980) Larson R. B., Tinsley B. M., Caldwell C. N., 1980, ApJ, 237, 692
- Leauthaud et al. (2010) Leauthaud A., et al., 2010, ApJ, 709, 97
- Lee et al. (2015) Lee N., et al., 2015, ApJ, 801, 80
- Machado et al. (2015) Machado R. E. G., Monteiro-Oliveira R., Lima Neto G. B., Cypriano E. S., 2015, MNRAS, 451, 3309
- Martino et al. (2014) Martino R., Mazzotta P., Bourdin H., Smith G. P., Bartalucci I., Marrone D. P., Finoguenov A., Okabe N., 2014, MNRAS, 443, 2342
- Mok et al. (2016) Mok A., et al., 2016, MNRAS, 456, 4384
- Monteiro-Oliveira et al. (2017) Monteiro-Oliveira R., Lima Neto G. B., Cypriano E. S., Machado R. E. G., Capelato H. V., Laganá T. F., Durret F., Bagchi J., 2017, MNRAS, 468, 4566
- Moore et al. (1996) Moore B., Katz N., Lake G., 1996, ApJ, 457, 455
- Okabe & Smith (2016) Okabe N., Smith G. P., 2016, MNRAS, 461, 3794
- Pereira et al. (2010) Pereira M. J., et al., 2010, A&A, 518, L40
- Rawle et al. (2012a) Rawle T. D., et al., 2012a, ApJ, 747, 29
- Rawle et al. (2012b) Rawle T. D., et al., 2012b, ApJ, 756, 106
- Schellenberger et al. (2019) Schellenberger G., David L. P., O’Sullivan E., Vrtilek J. M., Haines C. P., 2019, arXiv e-prints, p. arXiv:1907.10581
- Smith et al. (2010) Smith G. P., et al., 2010, A&A, 518, L18
- Smith et al. (2012) Smith D. J. B., et al., 2012, MNRAS, 427, 703
- Voit (2005) Voit G. M., 2005, Reviews of Modern Physics, 77, 207
- Walter et al. (2011) Walter F., et al., 2011, ApJ, 726, L11
- da Cunha et al. (2008) da Cunha E., Charlot S., Elbaz D., 2008, MNRAS, 388, 1595
- da Cunha et al. (2010) da Cunha E., Eminian C., Charlot S., Blaizot J., 2010, MNRAS, 403, 1894