Vortex stream generation and enhanced propagation in a polariton superfluid
Abstract
In this work, we implement a new experimental configuration which exploits the specific properties of the optical bistability exhibited by the polariton system and we demonstrate the generation of a superfluid turbulent flow in the wake of a potential barrier. The propagation and direction of the turbulent flow are sustained by a support beam on distances an order of magnitude longer than previously reported. This novel technique is a powerful tool for the controlled generation and propagation of quantum turbulences and paves the way to the study of the hydrodynamic of quantum turbulence in driven-dissipative 2D polariton systems.
I Introduction
Exciton-polaritons are bosonic quasi-particles arising from the strong coupling between excitons and photons. They have hybrid properties carried by their bare components, and exhibit highly non-linear behavior due to their excitonic content Vladimirova et al. (2010). Since the first demonstration of Bose Einstein condensation in exciton-polariton microcavities Kasprzak et al. (2006), these systems became an attractive platform to study the hydrodynamics of quantum fluids. Thanks to the ability to prepare a polariton superfluid steady flow, the hydrodynamic nucleation of quantum turbulences was reported Amo et al. (2009); Roumpos et al. (2011); Nardin et al. (2011); Amo et al. (2011).
In the last decade, many efforts have been made to control and manipulate the generation and propagation of vortices in polariton systems Sanvitto et al. (2011); Dall et al. (2014); Boulier et al. (2016); Hivet et al. (2014). The vortices in a superfluid are collective excitations formed by a low density core with quantized circulation around it, which makes them resilient to spontaneous decay (i.e. they are topologically protected). Since they are the fundamental block of the turbulence in superfluids, the study of their dynamics raises a great interest.
Moreover, optical vortices are extremely promising for their application in quantum optical information science. In optics, modes carrying orbital angular momentum are used to encode and transport information Willner et al. (2015). Quantum vortices in planar microcavities are ideal candidates for binary encoding (thanks to their robustness to the perturbations and their clockwise/counter-clockwise phase winding) towards on-chip technology. Furthermore, orbital angular momentum entanglement is at the forefront of quantum information science Mair et al. (2001); Hiesmayr et al. (2016); Fickler et al. (2016); Nagali et al. (2009); Giovannini et al. (2011); Marrucci et al. (2011).
Different experimental configurations have been used to generate polariton vortices. In early experiments, quantized vortices have been observed in a condensate pumped with a continuous-wave (cw) non-resonant excitation Lagoudakis et al. (2008), spontaneously emerging from the overlap between the condensate and a disordered potential landscape. Quantized vortices pairs have been also obtained using pulsed resonant pumping Nardin et al. (2011); Lerario et al. (2017). In this case, because of the dissipative nature of exciton-polaritons, the vortices lifetime is limited by the polariton lifetime, thus limiting the study of their dynamics. With a cw resonant pumping, in order to ensure the absence of phase fixing and to allow the appearance of topological excitations, many experiments were performed in the free propagation regime, outside of the excitation area by the laser. However, also in this configuration, the polariton density and the propagation distance of the quantum fluid are limited by the polariton lifetime Amo et al. (2011). Thereafter, cw resonant and non-resonant pumping have been used to generate stationary vortices with in-plane engineering of the potential landscapes or even in Optical Parametric Oscillation configuration Sanvitto et al. (2011); Dall et al. (2014); Boulier et al. (2016); Hivet et al. (2014). However, all these cw configurations inhibit vortices free propagation–the vortices core is spatially pinned by the excitation intensity shape–and impose strong constraints on their free interaction.
A quasi-resonantly driven semiconductor microcavity exhibits a bistable behavior when the pump laser is slightly blue detuned with respect to the polariton resonance Baas et al. (2004). The optical bistability, theoretically illustrated in figure 1a, has been used in polariton systems for switching on and off the polariton population by triggering it with a weak control beam, allowing the achievement of polariton switches and logic gates De Giorgi et al. (2012); Ballarini et al. (2013). Moreover, the upper branch of the bistability loop, where the polariton density and the nonlinear interactions are very strong, is closely linked to striking phenomena such as superfluidity and supersonic Cherenkov propagation Amo et al. (2009).
In this work, we consider the bistable hysteresis loop, highlighted in blue in Fig 1a, comprised between the lower and upper turning points of the bistability curve, where the system can be either in a linear or nonlinear regime. Remarkably, as shown in a recent theoretical proposal Pigeon and Bramati (2017), in this region the phase of the fluid is not fixed by the resonant driving field but is instead free to evolve and at the same time, the polariton density can be high enough to observe spontaneous collective superfluid behaviour mediated by the nonlinearity of the system.
We demonstrate for the first time that in the bistable regime, vortex-antivortex pairs can be generated and controlled while their propagation is strongly enhanced far beyond the polariton free propagation length. To experimentally implement this configuration, we make use of a set-up with two beams: a support beam on a large area with an intensity inside the bistability cycle and a localized seed beam with an intensity above the bistability regime that creates a superfluid
flow and triggers the support into the upper branch of the bistability cycle (see Fig.1a and 1b). The support beam then sustains the superfluid propagation along the microcavity plane (see figure 1b). Placing an obstacle in the supported region, we show that topological excitations can be hydrodynamically generated in the wake of the obstacle and propagate as long as the polariton superfluid remains in the bistable regime Pigeon and Bramati (2017).
Furthermore, we show that the vortex propagation direction can be controlled by changing the in-plane wavevector of the support beam. Finally, modifying the support intensity, we can also control the density of vortices in the turbulent stream. The propagation distance appears to be only limited by the experimental need of a large homogeneous support beam, offering in principle limitless propagation of a quantum turbulent flow.
II Results and Discussion
The polariton microcavity under investigation is made of three As/GaAs quantum wells embedded between two GaAs/AlAs-based DBRs, 21 pairs for the front DBR and 24 pairs for the back one. The measurements are performed at cryogenic temperature and in transmission configuration.
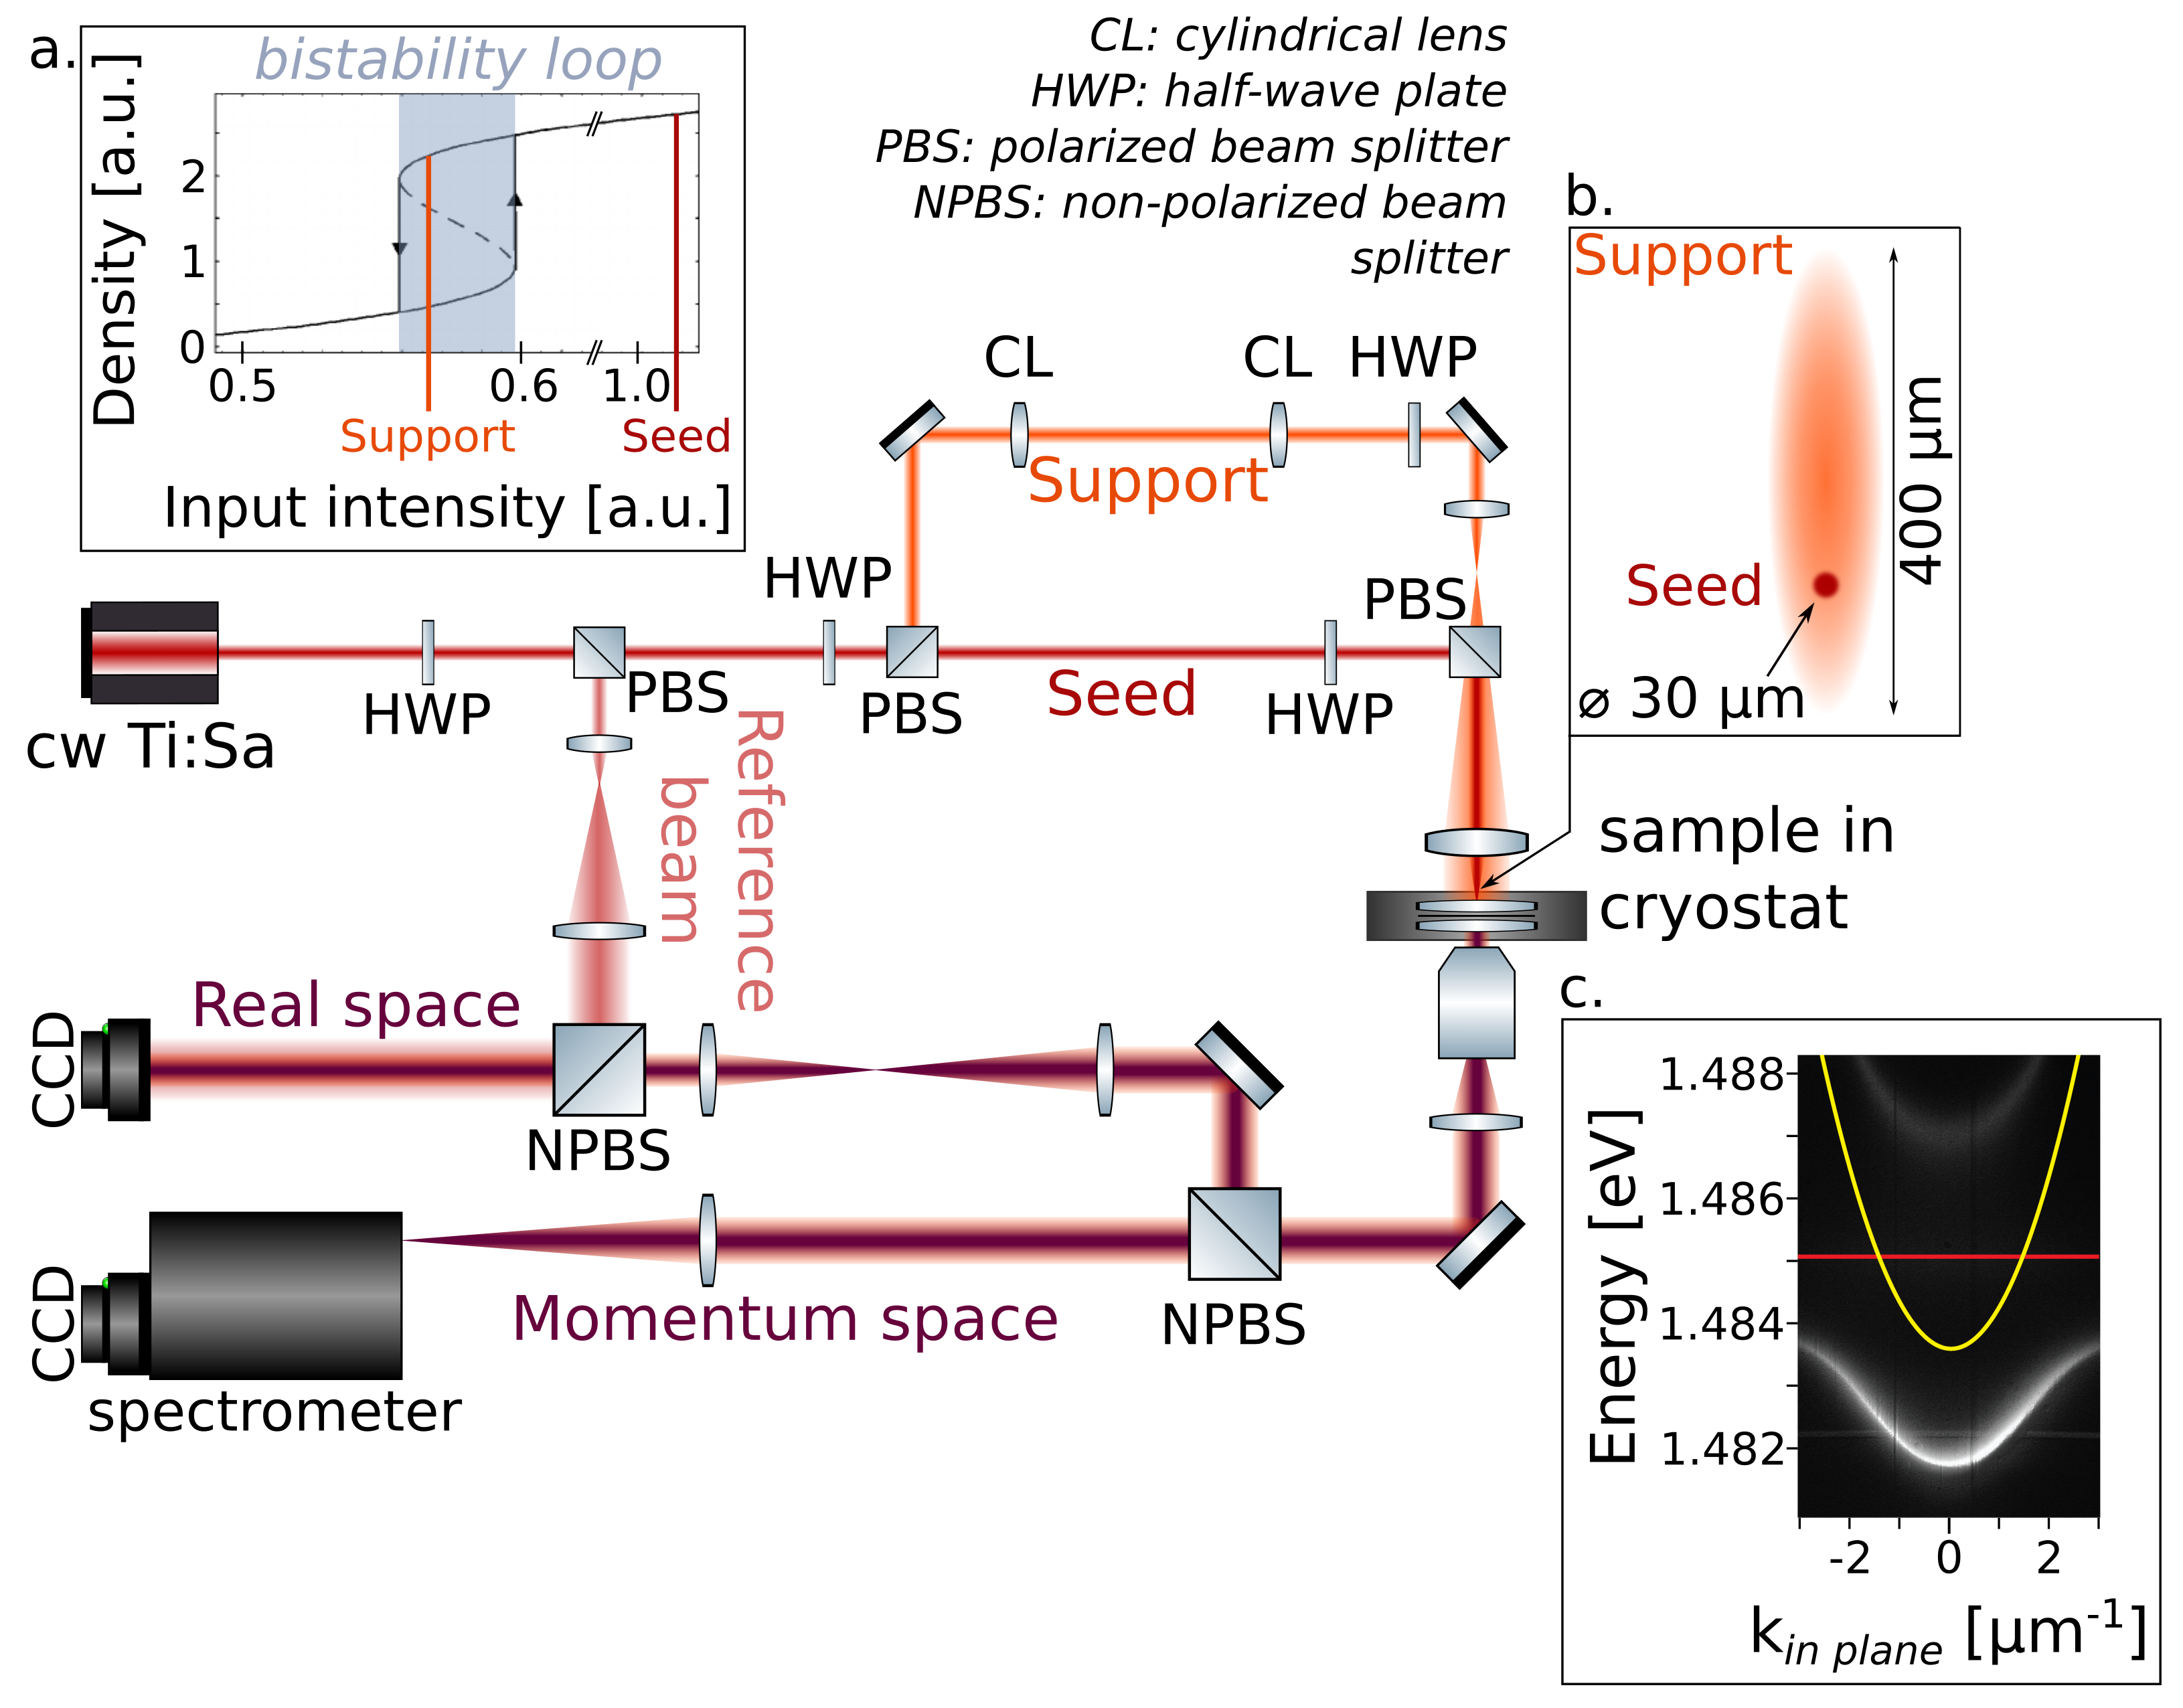
Sketch of the optical setup. The excitation line consists of a support beam path (collimated on the sample surface) and a seed beam path (focused on the sample surface). The two beams are superposed at the sample surface. Using two cylindrical lenses in the excitation path, the support beam has an elliptic shape. Inset (b) shows the configuration of the seed and support on the sample surface. The detection line consists of two different paths projecting the real space and momentum space maps on two CCD cameras (see main text for further details). c) Polariton dispersion under non-resonant excitation (2.54 eV CW laser). The strong coupling between the exciton transition (red line) and the photon mode (yellow line) gives rise to the upper and lower polariton branches.
The optical setup is sketched in Figure 1. A cw single mode Titane-Sapphire laser at 831nm pumps the polaritons in the quasi-resonant excitation configuration. A first half wave plate (HWP) and polarizing beam splitter (PBS) extract a reference beam for the homodyne interferometric detection. The main beam is split in two different channels using a second HPW and PBS, one channel for the support beam and the other one for the seed beam. The seed beam is focused on the sample surface in an area with FWHM = 30 m and intensity = 10.6 W/mm2. Making use of two cylindrical lenses (CL) along the support excitation line, the support beam intensity has an elliptical shape and it is collimated (100x400 m FWHM) at the sample surface in order to cover a large area of the sample. The support input intensity is 5.8 W/mm2. The two beams merge in the same excitation channel through a PBS, generating a seed spot focused near the edge of the large area illuminated by the support beam (Figure 1b).
We can control the polariton group velocity, or flow velocity, by varying the angle of incidence of the pump with respect to the device plane ( , with the wavevector of the pumping laser). The detection channel is divided into two different paths by a beam splitter. The real space image of the sample surface is detected with a CCD camera in one arm, giving the map of the the polariton fluid density, while a CCD camera placed in the second detection arm images the momentum space map. By using a spectrometer before the CCD camera in this second arm, the full dispersion curves can be measured by pumping the system with a non-resonant excitation (2.54 eV cw laser). Fig 1c shows the dispersion curves corresponding to the upper and lower polaritons arising from the strong coupling between the exciton level (red line) and the planar microcavity photon mode (yellow line). The cavity has a negative exciton-photon detuning (-1.4 meV), the Rabi splitting is 5.2 meV and the polariton lifetime is 14 ps. The experiments are operated close to resonance with the lower polariton mode.
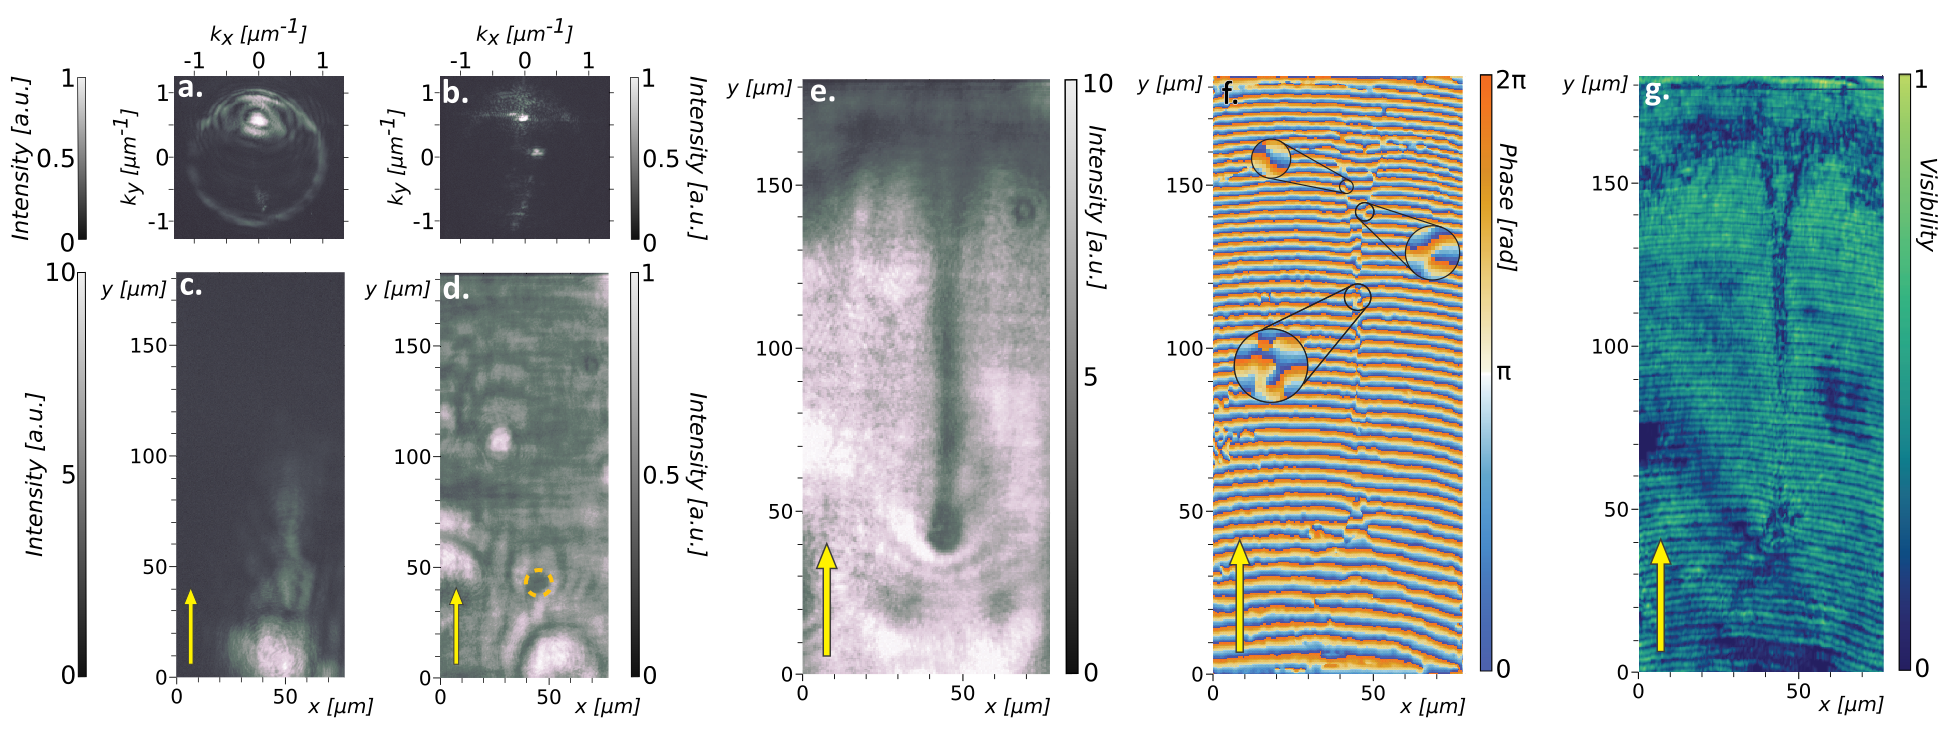
Figures 2a and 2b show the momentum space maps in the quasi-resonant excitation configuration for seed-only and support-only, respectively. Both excitation beams have the same wavevector ( and ). The flow speed depends on the polariton dispersion according to the formula . In our case, the flow speed is 0.9 m/ps with the flow direction along the support beam major axis.
The excitation energy is close to resonance with the lower polariton branch at low excitation power. The scattering ring in Figure 2a ( radius) highlights the detuning of the excitation with respect to the lower polariton resonance, which is of 0.26 meV at the excitation in-plane wavevector. Unsing a small the excitation spot in the momentum space and increasing the excitation power, the blueshift of the polariton dispersion induced by to the polariton-polariton repulsive interactions allows for the abrupt increase of the polariton density when the system locks to the excitation laser energy. With a blue detuned driving field, one can then observe a bistability cycle Baas et al. (2004); Pigeon and Bramati (2017) as for any Kerr medium in a microresonator.
In the case of support-only (Fig 2d), the system lies in the lower part of the bistability loop (note that in Fig 2d the support-only intensity map, the scale is divided by a factor of ten with respect to the other intensity maps) and few photons enter into the microcavity. The polariton flow propagation in the disordered random potential of the microcavity leads to interference effects offering bright and dark spots. One dark spot, indicated by the orange dashed circle in Fig 2d, is noticeable by its size, 8 m diameter, and corresponds to a high potential barrier, which will create vortices downstream.
When the seed beam is superposed with the support beam (Figure 2e), the local increase of the polariton-polariton interactions blue shifts the mode resonance, allowing the jump of the system to the upper part of the bistability loop, together with a drastic increase of the polariton density. The high polariton density region extends over a much wider area than where the seed beam is located, and it is only limited by the support size. This is possible because the intensity of the support beam is carefully adjusted to stay within the hysteresis loop of the bistability curve.
The sound velocity depends on the polariton density, , with the polariton-polariton interaction constant, the polariton mass and the polariton wave-function. is 0.78 m/ps in the area where the support beams locks to the upper part of the bistability cycle. The flow velocity (0.9 m/ps, as mentioned above) is then larger than the speed of sound and the propagation is supersonic, allowing for the generation of Cherenkov wavefronts upstream the obstacle and for the propagation of perturbations downstream. Here, a long dark shadow appears in the wake of the defect along the support propagation direction. The presence of a potential barrier on the polariton flow leads to the generation of vortex-antivortex pairs. The time integration over a flowing stream of vortex pairs continuously generated at the defect position leads to a shadow in the wake of the defect, as predicted in Ref. Pigeon and Bramati (2017) and reported here. Because of the time integration, the intensity of the shadow in the wake of the defect depends on the vortex generation rate: higher is the generation rate, darker is the shadow. According to the theoretical predictions, the vortex generation rate is maximal close to the lower limit of the bistability loop, which allows us to maximize the contrast and to clearly observe the turbulence stream. The vortices propagate for more than 120 m, an order of magnitude longer than the distance supported by the polariton lifetime, that is 12 m. This propagation distance is only limited by the support field profile which needs to be as flat as possible.
To further justify that the observed shadow indeed results from the time averaging of a quantum turbulent flow, the phase pattern of the fluid is analyzed. A homodyne interferometer is used to probe the phase pattern associated to Fig 2e. A portion of the support beam is extracted along the excitation line and used as a reference beam with a homogeneous phase, making it interfere on the CCD camera with the signal coming from the microcavity. The time integration over a continuous flow of the vortex stream results in the blurring of the phase in the wake of the defect. Indeed, the lower inset of the interferogram (Fig 2f) presents such a blurred phase at a position coinciding with the shadow stream. To enlighten this phenomenon we report in Figure 2g the corresponding visibility which decreases along the turbulent stream line. Fork-shaped patterns associated to localized vortices along the flow are also visible in the central zoom in Fig 2f. At the border of the locked area the polariton density is decreasing because of the Gaussian shape of the support beam. Therefore in this region the vortex core radius increases due to the increase of the healing length. This effect induces the merging of the ejected vortices and the formation of unstable grey solitons (upper zoom in Fig 2f), which repel each other and generate the Y-shape observed in the experiment. This Y shape has also been observed for solitons in previous experiments Amo et al. (2011).
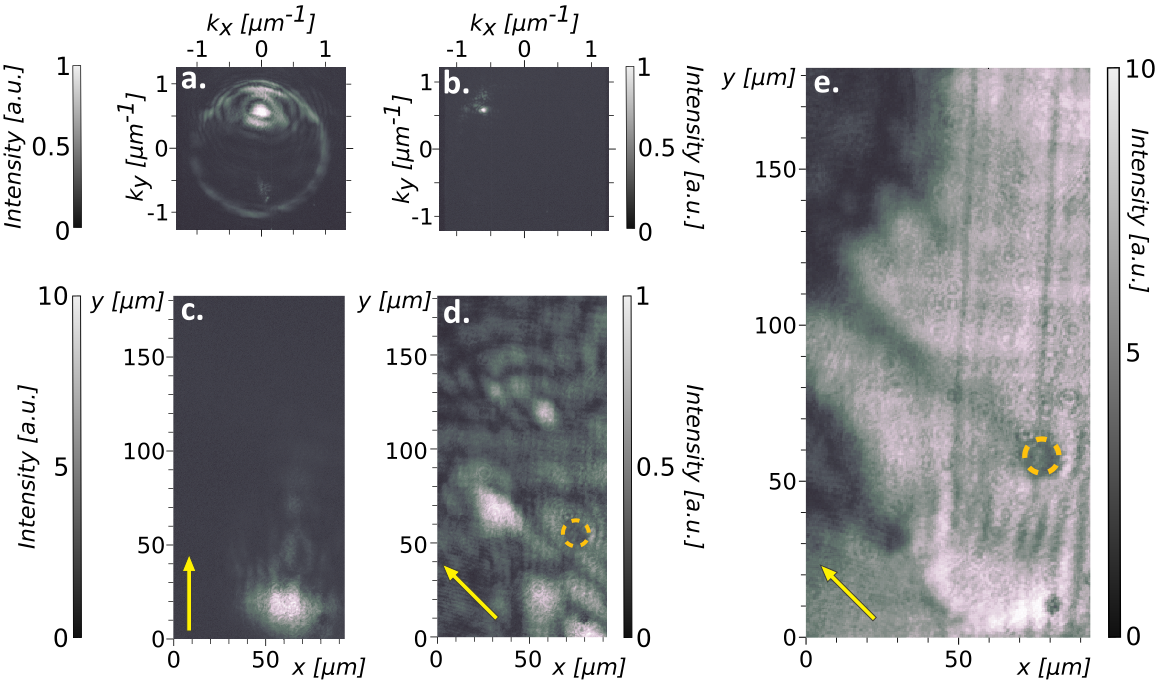
Moreover, the seed-support configuration allows to control the vortex propagation direction via the support wavevector orientation. Figure 3e shows the stream of vortices flowing with a non-zero component in . Here, the seed momentum is (and , Figure 3a), while the support momentum orientation, with the same module, is displaced at about 40∘ with respect to the seed one (Figure 3b). Panels 3c and 3d show the seed-only and support-only space maps, respectively. As evident from Figure 2 and 3, the vortices stream flows with a propagation direction defined by the support beam direction.
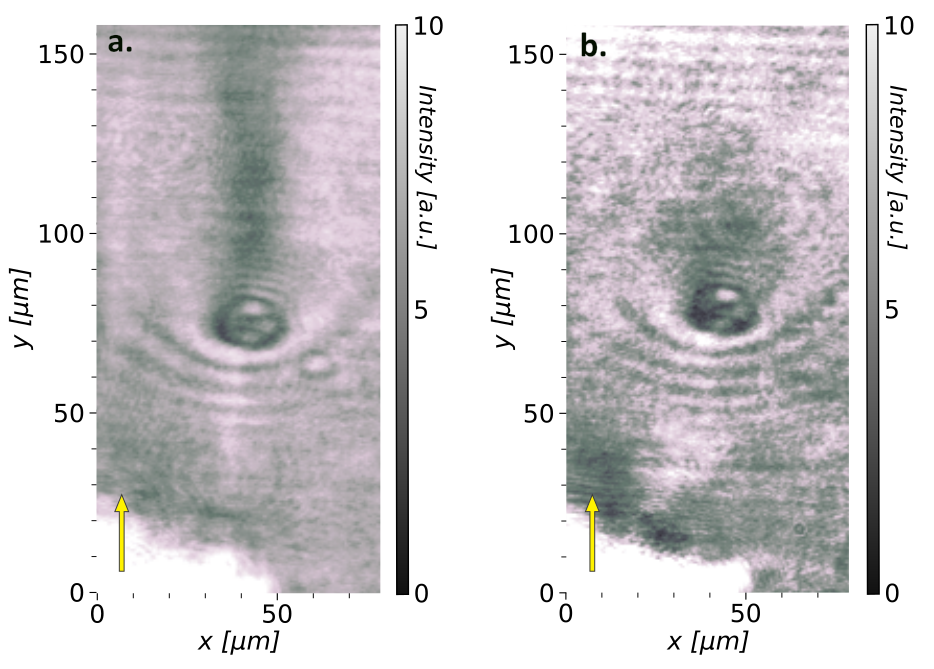
As specified above, the intensity of the shadow depends on the vortex generation rate in time-integrated measurements. By increasing the support density above the bistable regime the vortex generation is strongly inhibited because the fluid phase is fixed to the support beam phase. Experimentally, this translates into the suppression of the shadow in the wake of the defect when increasing the support power as predicted in Ref. Pigeon and Bramati (2017). In Figure 4a we can observe the vortex stream propagating in the wake of the defect; here, the experimental configuration and parameters are identical to the ones previously described. When the excitation density is increased to 6 W/mm2 (Figure 4b), which is just above the limit of the bistable regime, the vortex stream is completely suppressed by the phase constraint imposed by the support beam, with almost no change in the fluid properties (speed and density).
III Conclusions
In conclusion, we demonstrated the generation of a vortex stream flowing over more than 120 m in the plane of a polariton microcavity, implementing an original method proposed by Pigeon et al. Pigeon and Bramati (2017). In this approach we used the bistability to release the phase fixing of the polariton fluid to the resonant support beam, while maintaining the particle density sufficiently high to observe topological excitations. Vortices can then be sustained without being limited by the polariton lifetime and can flow over macroscopic distances. Additionally, we demonstrated that the vortex stream direction can be controlled by the orientation of the support beam wavevector and the vortex density can be tuned varying the support intensity within the bistability cycle. This is the first implementation of an experimental configuration that allows for the controlled propagation and interaction of polariton vortices, paving the way for the on-chip macroscopic propagation and efficient manipulation of topological excitations.
IV Acknowledgments
This work has received funding from the French ANR grants (C-FLigHT 138678 and QFL) and from the European Union Horizon 2020 research and innovation programme under grant agreement No 820392 (PhoQuS). QG and AB thank the Institut Universitaire de France (IUF) for support.
References
- Vladimirova et al. (2010) M. Vladimirova, S. Cronenberger, D. Scalbert, K. V. Kavokin, A. Miard, A. Lemaître, J. Bloch, D. Solnyshkov, G. Malpuech, and A. V. Kavokin, Physical Review B 82, 075301 (2010).
- Kasprzak et al. (2006) J. Kasprzak, M. Richard, S. Kundermann, A. Baas, P. Jeambrun, J. M. J. Keeling, F. M. Marchetti, M. H. Szymańska, R. André, J. L. Staehli, V. Savona, P. B. Littlewood, B. Deveaud, and L. S. Dang, Nature 443, 409 (2006).
- Amo et al. (2009) A. Amo, J. Lefrère, S. Pigeon, C. Adrados, C. Ciuti, I. Carusotto, R. Houdré, E. Giacobino, and A. Bramati, Nature Physics 5, 805 (2009).
- Roumpos et al. (2011) G. Roumpos, M. D. Fraser, A. Löffler, S. Höfling, A. Forchel, and Y. Yamamoto, Nature Physics 7, 129 (2011).
- Nardin et al. (2011) G. Nardin, G. Grosso, Y. Léger, B. Pietka, F. Morier-Genoud, and B. Deveaud-Plédran, Nature Physics 7, 635 (2011).
- Amo et al. (2011) A. Amo, S. Pigeon, D. Sanvitto, V. G. Sala, R. Hivet, I. Carusotto, F. Pisanello, G. Lemenager, R. Houdre, E. Giacobino, C. Ciuti, and A. Bramati, Science 332, 1167 (2011).
- Sanvitto et al. (2011) D. Sanvitto, S. Pigeon, A. Amo, D. Ballarini, M. De Giorgi, I. Carusotto, R. Hivet, F. Pisanello, V. G. Sala, P. S. S. Guimaraes, R. Houdré, E. Giacobino, C. Ciuti, A. Bramati, and G. Gigli, Nature Photonics 5, 610 (2011).
- Dall et al. (2014) R. Dall, M. D. Fraser, A. S. Desyatnikov, G. Li, S. Brodbeck, M. Kamp, C. Schneider, S. Höfling, and E. A. Ostrovskaya, Physical Review Letters 113, 1 (2014).
- Boulier et al. (2016) T. Boulier, E. Cancellieri, N. D. Sangouard, Q. Glorieux, A. V. Kavokin, D. M. Whittaker, E. Giacobino, and A. Bramati, Physical Review Letters 116, 1 (2016).
- Hivet et al. (2014) R. Hivet, E. Cancellieri, T. Boulier, D. Ballarini, D. Sanvitto, F. M. Marchetti, M. H. Szymanska, C. Ciuti, E. Giacobino, and A. Bramati, Physical Review B - Condensed Matter and Materials Physics 89, 1 (2014).
- Willner et al. (2015) A. E. Willner, H. Huang, Y. Yan, Y. Ren, N. Ahmed, G. Xie, C. Bao, L. Li, Y. Cao, Z. Zhao, J. Wang, M. P. J. Lavery, M. Tur, S. Ramachandran, A. F. Molisch, N. Ashrafi, and S. Ashrafi, Advances in Optics and Photonics 7, 66 (2015).
- Mair et al. (2001) A. Mair, A. Vaziri, G. Weihs, and A. Zeilinger, Nature 412, 313 (2001).
- Hiesmayr et al. (2016) B. C. Hiesmayr, M. J. De Dood, and W. Löffler, Physical Review Letters 116, 1 (2016), arXiv:1508.01480 .
- Fickler et al. (2016) R. Fickler, G. Campbell, B. Buchler, P. K. Lam, and A. Zeilinger, Proceedings of the National Academy of Sciences 113, 13642 (2016).
- Nagali et al. (2009) E. Nagali, L. Sansoni, F. Sciarrino, F. De Martini, L. Marrucci, B. Piccirillo, E. Karimi, and E. Santamato, Nature Photonics 3, 720 (2009).
- Giovannini et al. (2011) D. Giovannini, E. Nagali, L. Marrucci, and F. Sciarrino, Physical Review A - Atomic, Molecular, and Optical Physics 83, 4 (2011).
- Marrucci et al. (2011) L. Marrucci, E. Karimi, S. Slussarenko, B. Piccirillo, E. Santamato, E. Nagali, and F. Sciarrino, Journal of Optics 13, 064001 (2011).
- Lagoudakis et al. (2008) K. G. Lagoudakis, M. Wouters, M. Richard, A. Baas, I. Carusotto, R. André, L. S. Dang, and B. Deveaud-Plédran, Nature Physics 4, 706 (2008).
- Lerario et al. (2017) G. Lerario, A. Fieramosca, F. Barachati, D. Ballarini, K. S. Daskalakis, L. Dominici, M. De Giorgi, S. A. Maier, G. Gigli, S. Kéna-Cohen, and D. Sanvitto, Nature Physics 13, 837 (2017), arXiv:1609.03153 .
- Baas et al. (2004) A. Baas, J. P. Karr, H. Eleuch, and E. Giacobino, Physical Review A 69, 023809 (2004).
- De Giorgi et al. (2012) M. De Giorgi, D. Ballarini, E. Cancellieri, F. M. Marchetti, M. H. Szymanska, C. Tejedor, R. Cingolani, E. Giacobino, A. Bramati, G. Gigli, and D. Sanvitto, Physical Review Letters 109, 1 (2012).
- Ballarini et al. (2013) D. Ballarini, M. De Giorgi, E. Cancellieri, R. Houdré, E. Giacobino, R. Cingolani, A. Bramati, G. Gigli, and D. Sanvitto, Nature Communications 4, 1778 (2013).
- Pigeon and Bramati (2017) S. Pigeon and A. Bramati, New Journal of Physics 19, 095004 (2017).
- Pigeon et al. (2011) S. Pigeon, I. Carusotto, and C. Ciuti, Physical Review B 83, 144513 (2011).