Permission to make digital or hard copies of all or part of this work for personal or classroom use is granted without fee provided that copies are not made or distributed for profit or commercial advantage and that copies bear this notice and the full citation on the first page. Copyrights for components of this work owned by others than ACM must be honored. Abstracting with credit is permitted. To copy otherwise, or republish, to post on servers or to redistribute to lists, requires prior specific permission and/or a fee. Request permissions from permissions@acm.org.
CHI ’20, April 25–30, 2020, Honolulu, HI, USA.
Copyright is held by the owner/author(s). Publication rights licensed to ACM.
ACM ISBN 978-1-4503-6708-0/20/04 …$15.00.
http://dx.doi.org/10.1145/3313831.3376262
Button Simulation and Design via FDVV Models
Abstract
Designing a push-button with desired sensation and performance is challenging because the mechanical construction must have the right response characteristics. Physical simulation of a button’s force–displacement (FD) response has been studied to facilitate prototyping; however, the simulations’ scope and realism have been limited. In this paper, we extend FD modeling to include vibration (V) and velocity-dependence characteristics (V). The resulting FDVV models better capture tactility characteristics of buttons, including snap. They increase the range of simulated buttons and the perceived realism relative to FD models. The paper also demonstrates methods for obtaining these models, editing them, and simulating accordingly. This end-to-end approach enables the analysis, prototyping, and optimization of buttons, and supports exploring designs that would be hard to implement mechanically.
keywords:
Button; haptic; modeling; simulation; tactility; force feedback; vibration; input device; haptic rendering; FD model; FDVV model.<ccs2012> <concept> <concept_id>10003120.10003121.10003125.10011752</concept_id> <concept_desc>Human-centered computing Haptic devices</concept_desc> <concept_significance>500</concept_significance> </concept> <concept> <concept_id>10003120.10003121.10003125</concept_id> <concept_desc>Human-centered computing Interaction devices</concept_desc> <concept_significance>500</concept_significance> </concept> <concept> <concept_id>10003120.10003121.10003125.10010872</concept_id> <concept_desc>Human-centered computing Keyboards</concept_desc> <concept_significance>500</concept_significance> </concept> <concept> <concept_id>10003120.10003123.10010860.10011694</concept_id> <concept_desc>Human-centered computing Interface design prototyping</concept_desc> <concept_significance>500</concept_significance> </concept> </ccs2012>
[500]Human-centered computing Haptic devices \ccsdesc[500]Human-centered computing Interaction devices \ccsdesc[500]Human-centered computing Keyboards \ccsdesc[500]Human-centered computing Interface design prototyping
1 Introduction
This paper investigates the simulation and interactive design of push-buttons. Many push-button designs use a spring-loaded slider: when the slider is pushed to the activation point, a binary input is registered. Upon release, it returns to the initial state. More generally, buttons are transducers that register a discrete event from physical motion [29, 34, 50]. Numerous types exist, using spring-loading but also other mechanisms, such as rubber and metal domes. Interestingly, each button is unique in its tactility or tactile response characteristics [27, 41]. Gamers, programmers, typists, and hobbyist groups alike have a keen interest in tactility, which is associated with sensory experience and performance [3, 13, 50]. However, despite the popularity and importance of buttons, researchers have paid relatively little attention to their design.
Simulators have taken on a major role in most branches of engineering and design, where they are used to study reality, predict consequences of design decisions, and derive and optimize solutions. Dedicated simulators can do the same for button design. We believe that one obstacle has been the lack of an accurate yet practical simulation device. It should be able to realistically reproduce different tactilities so that designers and researchers could explore and test them at little cost.
Accurate simulation of button-pressing is challenging, though. Although a press and release occurs in about 100 ms [31], a wealth of sensory feedback is generated [10, 50]. Slow and fast mechanoreceptors [66, 8, 58] deliver information on spatial patterns, change in the contact area at the fingertip, the roughness of the contact support, stretching of the skin, subtle and rapid changes in force, and vibrations during a press. Meanwhile, proprioception provides feedback on displacement, as detected via the joints and muscles of the finger [60]. This information is transmitted through the spine at high rates, up to 1 kHz [21, 14], and contributes to constructing the felt sensation of a press [2, 50]. Hence, to reproduce a realistic button sensation, the simulator needs to capture those physical characteristics of a press that dominate that sensation.
While pre-existing simulators can render tactile and linear buttons [15, 38], we found that force–displacement (FD) approaches cannot accurately render other than a simple linear button. In addition, the perceived realism of the rendered buttons has not been properly evaluated, and no methods have been offered to help designers and engineers exploit such simulation. We believe this to be due to three engineering challenges: (1) modeling, (2) simulator construction, and (3) model–simulator separation. Firstly, prior work has modeled buttons’ response as the displacement-dependent change in force [15, 38, 47]. However, as we show in this paper, an FD model is adequate only for linear buttons pressed at extremely low speed. It is known that the physical response of a button depends also on velocity and acceleration [6, 7, 41], and that buttons elicit a vibration response. Vibration affects the perception of button-pressing [48], and it can be so prominent that it produces an illusion of force change [18, 26, 64]. Secondly, the simulators created thus far have fallen short of the operation rate needed for a button press. General haptic devices such as Phantom [42, 59, 17] and inForce [47] operate at 60 Hz, while the skin’s mechanoreceptors fire at about 1,000 Hz and respond to tiny changes in force [21, 14]. Simplistic controller approaches may have further curbed attempts to render anything other than a linear button. To our knowledge, previous work has, at best, applied a linear PID controller to render the response at the force actuator of a simulator, although this is generally recognized as insufficient for nonlinear plants [70, 9]. We should emphasize, thirdly and finally, that the button models must be editable if they are to be of practical use. This calls for model–simulator separation. By avoiding the device-dependency of models, we can support the meaningful editing of buttons – by designers and by software.
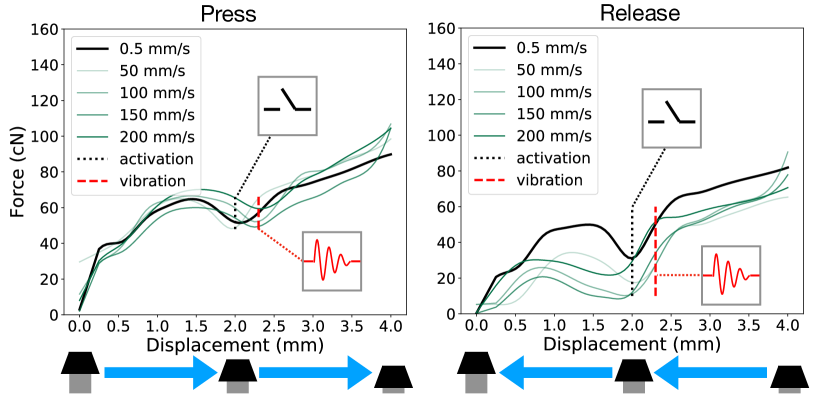
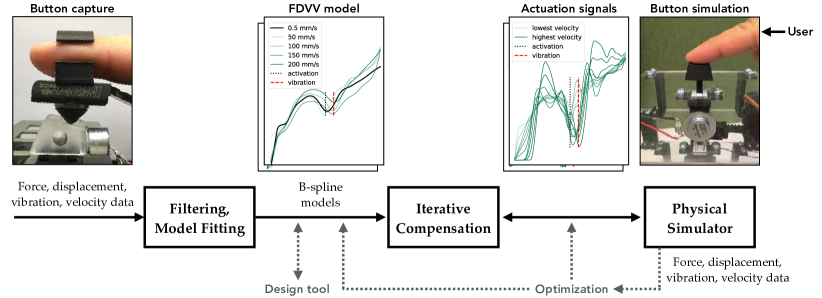
To address these challenges, we propose an extended model and an end-to-end simulation pipeline around it. Our approach allows simulating more button types than previously, among them tactile-type buttons and buttons with different click reactions and travel ranges. Furthermore, it permits the analysis and editing of buttons. Our work centers on the Force–Displacement–Vibration–Velocity (FDVV) model, illustrated in Figure 1. It adds vibration response and velocity-dependence on top of the FD model. In our implementation, vibration is sampled thorough a microphone during a switch press, and multiple FD curves are sampled, at several speeds. We solve several engineering challenges connected with ambitions to capture and simulate buttons via FDVV models.
In particular, we present methods developed for (1) capturing the FDVV response of a button, (2) computing a lower-parametric FDVV model from the measurement data obtained, and (3) actuating an FDVV model for a given physical plant. Figure 2 gives an overview of the end-to-end approach. The data (force, displacement, vibration, and velocities) obtained during capture are filtered and modeled via B-splines [67], collapsing the data into a lower-dimensional and more manipulable model. For rendering it, we present a novel simulator construction for FDVV models. This is capable of detecting displacement to m precision at a high sampling rate (1 kHz) and can produce a wide range of force (up to 4.4 N) and vibration (50 Hz – 20 kHz) feedback. In contrast to previous, 60 Hz simulators, our simulator can render high-fidelity vibration arising from the rapid force change near the snap and bottom-out points during the press [30]. It also has a mechanical limiter for rendering a button with various travel distances (0–6.2 mm). Thanks to the iterative compensation method, which translates an FDVV model into actuation signals that cancel out the simulator plant’s own transfer function, one can assign button designs from software without hardware tweaks.
In summary, this paper makes three contributions. We present advances in modeling and simulator design that extend the range of supported button types. Secondly, we report the results of a controlled study showing that the FDVV model yields higher perceived realism than FD modeling. Finally, the approach opens new possibilities in design and prototyping; especially, by reducing the effort of exploring designs. We demonstrate applications in interactive button-editing, software-side optimization, and prototyping of innovative button designs the mechanical structure of which would be hard to fabricate. The general principles we applied in the simulation pipeline can also benefit future research toward accurate haptic rendering. For example, simulating elastic materials.
2 Background
Physical buttons are electromechanical devices that make or break a signal upon pressing, then return to the initial (re-pushable) state upon release. There is incredible variety in the constructions that fit this definition. Our discussion here focuses on commonplace push-buttons of keyboards and button panels. Mechanical keyswitches, rubber domes, and metal domes are the most typical structures. Numerous other design parameters exist, such as physical properties of the keycap (width, slant, and key depth), the materials used (e.g., plastics), and system-level feedback (modalities and latencies) [36]. The response upon pressing can be characterized via the the force–displacement function or force curve [55, 36]. Actuation (press-down) and release curves often differ. The FD curve is known to affect not only sensation but also joint kinematics [23], muscle activity [28, 55, 56], and the user’s aiming performance [50]. Linear buttons have the feel of pressing a spring; there is no tactile landmark or “bump” during press-down. A tactile-type button has a so-called snap ratio, which determines the strength of its tactile bump. Rubber-dome buttons utilize a snap ratio greater than 40%. Some tactile buttons emit an audible “click” sound near the snap point. Travel distance is the total distance before the keycap hits the bottom, and the distance at which the button is activated is called its activation point [29]. While these features can be modeled with FD curves, we stress again that FD neglects velocity and vibration characteristics.
2.1 Capturing and modeling physical buttons
There are two main approaches in haptics research applicable to the modeling of buttons. The first is an analytical one aimed at formulating equations that capture the mechanics of haptic interaction, which in the case of buttons would involve the forces, vibrations, etc. during a press. Since these interactions are complex, analytical models almost inevitably need to make simplifying assumptions. For example, the spring–mass-damper system in buttons could be described as a lumped mass [44]. Analytical models applicable to buttons include modeling of spring–mass-damper systems [6] and friction [20]. While prior applications to buttons and knobs do exist [4], the ones presented thus far are too low-parametric to capture the rich design space of push-buttons.
The second approach is a reality-based, or data-driven, one that starts with physical measurements and constructs models based on data. In the case of buttons, one starts by physically probing a button to measure the interaction forces between the button and the probe as displacement and even higher-order variables. Displacement has been approached in such a manner outside the button domain. One could cite as example applications the automotive gearshift [5], non-rigid materials [47, 61], and human tissue [51]. Displacement-only models are relatively simple. For buttons, this approach is insufficient. There have been studies examining higher-order variables, such as velocity [68] and acceleration [12, 39, 40]. This, however, complicates everything from measurement to simulation. Nonetheless, we followed the reality-based approach. We captured the forces involved, displacement values, vibration, and pressing velocities, and we found a way to collapse the data to a more understandable, lower-parametric model.
2.2 Haptics rendering
Our work is aligned with haptics research pursuing the creation of rich and realistic sensations [25]. While this area of research is too broad to review here, some relevant findings are worth mentioning. Firstly, research has looked at advanced factors affecting haptic perception, such as friction, temperature, or texture [16]. However, the focus has been on exploration or manipulation of objects, which is quite different from a keypress, which occurs in around 100 ms. The rapid compression and mechanical vibration of tissue in the fingertip are core elements of a button press. Secondly, general-purpose haptic simulators have been produced that could be used for buttons. The Phantom device [42, 59, 17] is a 6-DOF pen-type general force-rendering device capable of emulating the softness of deformable objects. However, a low operating rate (60 Hz), excessive degrees of freedom (six instead of one), and lack of vibrotactile simulation limit its use for buttons. Softness displays [45, 63, 47] too might aid in simulating the stiffness of a button, but these are restricted to so-called simple stiffness, which is inadequate for buttons. Finally, pseudo-force-feedback has been explored. By changing the contact area of the finger [16, 22] or using electro-tactile displays, one can create a softness-like sensation [24, 65]. However, this is not central to commodity push-buttons’ design.
2.3 Button simulators
Prior work on button simulation has been limited to static (speed-agnostic) FD simulators, which have the limitations described above. Doerrer and Werthschuetzky [15] enabled users to edit FD curves in software, and Liao et al. [38] have presented an FD simulator. The Phantom haptic interface [42] also can render a virtual button. Yet, as other simulators do, these too need an exaggerated FD curve to render the “snap” feeling of a tactile button. These papers omitted velocity and vibration dynamics from their model. Moreover, to our knowledge, the perceived realism achievable by FD simulators has not been empirically validated thus far.
3 Button Capture
Most previous work has captured buttons by a single-FD curve model. This approach has become conventional also in the way manufacturers present buttons on datasheets. However, button-pressing involves complex phenomena affected by the varying stiffness and damping effects produced by mechanical design. The stiffness effect means that the resisting force changes as a function of the button’s displacement. The damping effect entails the resisting force changing with the button’s velocity. An FD-only model captures neither the damping effect nor the high-frequency structural vibrations of a button press.
We propose an extension to the physical measurement of the tactility characteristics of push-buttons. Our capture method features three novel elements: (1) We measure presses under different velocities. (2) A human finger is used for pressing, as opposed to a rigid, static-velocity probing object as in earlier work. This allows us to better cover the response envelope people encounter in everyday button-pressing, via a procedure that requires no more than a few minutes to complete per button. (3) We record vibrations, which are important for covering more advanced button types. This necessitates a more complex measurement setup than before.
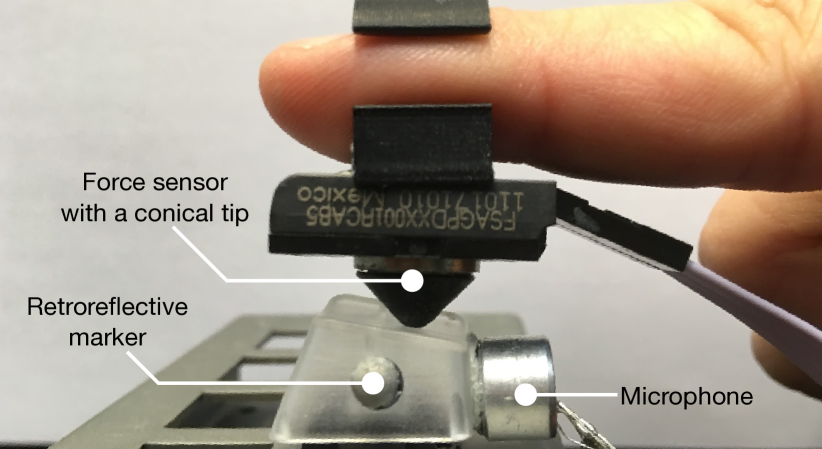
Setup: Our measurement setup is shown in Figure 3. Two retroreflective markers are attached to sides of the keycap. A motion-tracking system (OptiTrack Prime 13, 256 FPS) records the displacement of the button during a press. Also, a microphone (KY-038) is attached to the keycap, to detect vibration during button presses. On the user’s index finger is a force sensor (Honeywell, FSAGPDXX001RCAB5), with a conical tip (ABS, 3D printed, Bottom and top: 12 and 5 mm-diameter circles. Height: 5 mm) attached. A microprocessor (Adafruit Metro M0 Express) samples both sensors with its internal 10-bit ADC at 1 kHz frequency, which is the highest sampling rate allowed for the force sensor. Synchronization between the sensor data and the motion data is handled via an optical clapperboard (three 850 nm IR LEDs). The microprocessor is attached to a switch that turns on the LEDs. When the switch is triggered, the microprocessor and the motion tracking system record a reference point for synchronization.
Procedure: A participant is asked to wear the sensors and press the given button, following the instructions on the display. A velocity indicator is presented on this display, which shows animation for various velocities. The velocity indicator also creates a beep sound indicating the moment of contact and that of hitting the bottom. Note that we stated that the animation refers to the rate of pressing and the average velocity, not the moment-by-moment velocity. The participant is asked to press the button at the specified pace. We go through velocities of 50, 100, 150, and 200 mm/s, collecting 15 presses per velocity.
Example buttons: The paper reports on studies of six physical buttons: Cherry MX Clear and Brown (4 mm, tactile), Cherry MX Black and Red (4 mm, linear), HP PR1101U (3.6 mm, tactile), and MacBook Pro 2011 (2.2 mm, tactile). They have distinct haptic profiles (linear/tactile) and travel ranges.
4 FDVV Modeling
The raw measurement data must be transformed into a lower-dimensional FDVV model to allow efficient design and optimization. A series of preprocessing steps are followed to produce a synchronized and filtered dataset from multiple data sources. We then fit a B-spline model, using Bayesian Information Criteria (BIC) [32].
4.1 Preprocessing
The outputs of button capture are (timestamp, force, sound) data from the microprocessor and (timestamp, the 3D position of marker1, the 3D position of marker2) data from the motion tracker and vibration data. Our goals are to (1) filter out noise and outliers and (2) synchronize the two data sources.
Step 1, filtering: We pass force and vibration data through a low-pass filter for antialiasing, before the analog–digital conversion of the microprocessor. The filter consists of a resistor–capacitor circuit (R 333 ohm, C 1 uF) with a cutoff frequency of 500 Hz, using a Nyquist frequency of 1,000 Hz. Gaussian filters () are then applied to both force and displacement data, separately, for further denoising.
Step 2, synchronization: We then synchronize the data from the microprocessor and motion tracker, using the IR LED light data to find keyframes. Because the microprocessor runs at 1,000 Hz and the motion tracker at 256 Hz, resampling is required before synchronizing of the two sides. We chose to upsample displacement data by matching the of the motion tracker to the timestamp of the microprocessor, via linear interpolation. The displacement data get resampled up to 1,000 Hz frequency, after which we have synchronized the signals. We need resampling also to register force data against displacement (here, sampled every 50 m).
Step 3, outlier removal, averaging and smoothing: We use the resulting dataset to filter out incomplete button presses (ones where the button did not hit the bottom). Finally, we averaged the force data of the representative presses at each displacement point (every 50 m). A Gaussian filter () is then applied to smooth the averaged curve.
Step 4, synchronizing vibration data: Note that vibration data did not pass through steps 3–4. In most buttons, vibration is associated with the snap. This can be programmatically exploited to synchronize the vibration signal. On the other hand, one can ignore measurements detected in the beginning and the end portion, because these are caused mostly by the finger hitting the keycap or the keycap hitting the bottom. Hence, we consider only the middle part of the press, for which we use threshold-based event detection to find the onset of the vibration. For some buttons, this sound wave can be very subtle and rapid (typically <25 ms), making it hard to detect programmatically. To compensate for this, we can resort to a human observer (see “Iterative Compensation,” below).
4.2 B-Spline Fitting
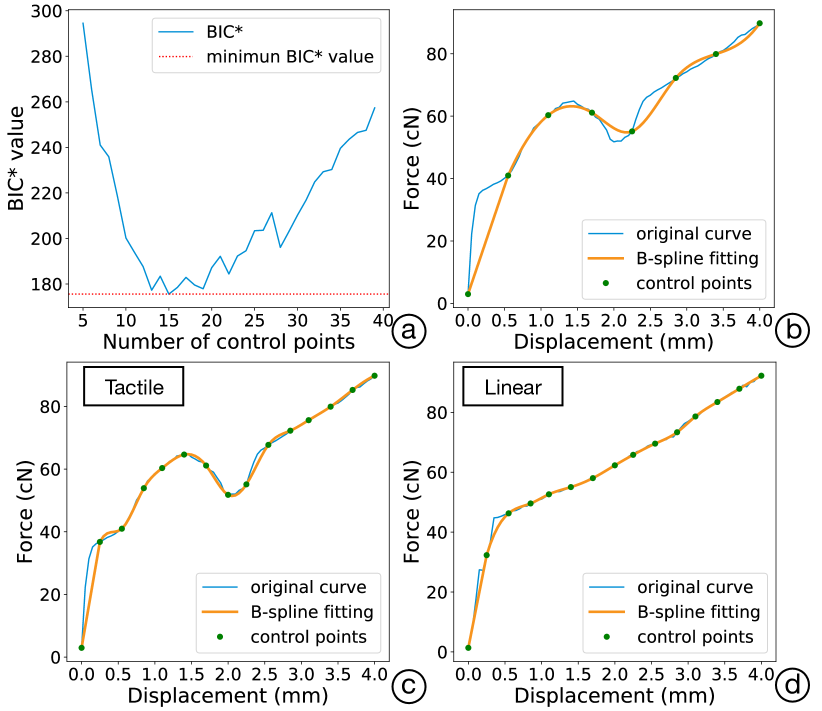
The preprocessed dataset is still too high-dimensional for editing by designers. For example, a typical 4 mm button requires approximately 800 parameters in our procedure. Hence, we use B-splines to achieve a lower-dimensional parametric model. While B-splines offer a suitable model for continuous multimodal data, there is still the question of how many control points are needed. We studied this by fitting B-spline models to our button dataset. To control against overfitting, we used Bayesian Information Criterion (BIC) [54, 32] for the fitness criteria. To reduce the number of parameters even further for feasibility for human editing, we added a custom penalty term: Complexity Penalty, P. This results in a modified BIC* function:
| (1) |
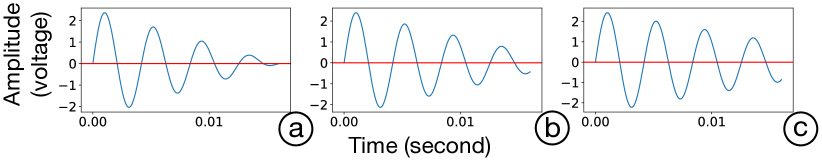
Where n stands for the number of observations, k for the number of parameters (control points), and for the maximized value of the likelihood function of the model. P is the added Complexity Penalty value, which is set to 2.5. Figure 4 (b, c, d) gives examples of fitting for a pressing segment of a certain velocity for Cherry MX Clear button.
Following this procedure, we found 15 B-spline control points was an ideal tradeoff for the six-button dataset with root mean square error of 0.14 cN; see Figure 4 (a). We also registered travel range, the activation point, and the vibration point in the resulting models, as examples shown in Figure 4 (c, d).
5 Button Simulator
Ours is the first physical simulator capable of the high-fidelity rendering of FDVV models. An overview is given in Figure 5. Our first design goal was to provide the high-frequency response and high-resolution rendering of forces and vibrations typical of buttons. The second was to enable full control from the software side.
Sensors and actuators: Figure 5 presents the four main components: (1) a linear force actuator (Moticont HVCM-025-022-003-01), (2) a linear position sensor (LVDT MHR 250, resolution: 0.05 mm), (3) a voice coil acting as a vibrotactile motor (Tectonic Teax13C02-8), and (4) a servo motor (Tower Pro Micro Servo, torque: 1.8 kg/cm). The force actuator, the sensor, and the servo motor are controlled by an Adafruit ItsyBitsy M0 board, which serves as the main processor of the prototype. The vibrotactile voice coil is driven by an Arduino Uno board and wave shield (Adafruit Wave Shield for Arduino Kit). These two boards are connected via the I2C protocol. When adjustments to the overall travel range are required, the ItsyBitsy board sends a command to the servo motor to adjust the location of the Travel Range Control, which further alters the lowest reachable displacement of the Travel Range Limiter and produces varying travel. When vibrotactile feedback is required, this board communicates with the Arduino Uno via I2C and asks it to drive the vibrotactile motor (voice coil) to present pre-recorded wave files.
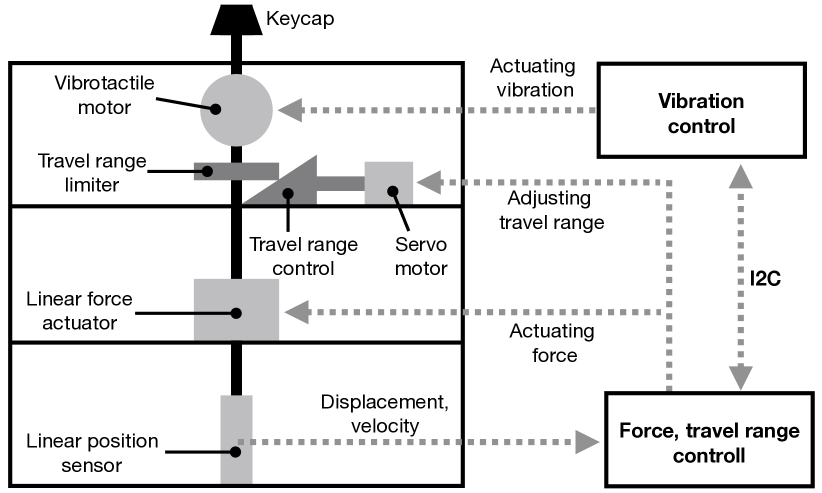
Microprocessor design: Before the simulation, the actuation signals (see “Iterative Compensation”) are uploaded to the main microprocessor (Adafruit ItsyBitsy M0) and it automatically sets the button travel range. During a simulation, the linear sensor constantly sends the reading value to the microprocessor. A moving-average filter (window size = 25) is applied here for denoising the reading from the position sensor. After the microprocessor has processed the values sent, it calculates the current displacement of the button and estimates the user’s pressing velocity. Then, it determines the corresponding Pulse-width modulation (PWM) signal and sends it to the linear force actuator. At the displacement where vibration starts, the microprocessor sends a command to the Arduino Uno for emitting the vibration. A high operating frequency is used (1 kHz) for the ItsyBitsy M0 board.
5.1 Spatial and temporal accuracy
We measured the spatial accuracy of the simulator via a probing device consisting of a linear actuator and a probe attached to a force gauge [38]. The probing velocity was 0.5 mm/s. We used this device to profile a 4 mm Cherry MX Clear button, checking the intended outputs of the simulator against the measurement results. Over multiple repetitions, we learned that the simulator can reproduce the force responses very accurately, with only 1.44 cN mean error (SD 1.68 cN). Time spent on each displacement sensing and computing actuation command is about 0.3 ms. From the command of rendering force to force generated takes less than 1 ms. Latency from sending the vibration command to its actuation is about 7ms. We compensated this latency by emitting vibration 300 m prior to the target starting point.
5.2 Simulation procedure
Prior to simulation, the actuation signals obtained from iterative compensation (see later) are uploaded to the microprocessor. Near the beginning of the press – i.e., at 0.5–1.0 mm of distance traveled – the microprocessor calculates the pressing velocity for the press. At least three timestamped samples are needed. From those samples, the simulator computes velocity and switches to the corresponding actuation specification. That specification is used to determine the resisting force and the vibration for the sensed level of displacement. To simulate the vibration, we followed an event-based approach wherein vibration recording is initiated at the right displacement [33], creating a snap-like sensation.
6 Iterative Compensation
A key objective in our work is to separate the model from the simulator. Any force actuator has its own transfer function in the play that must be canceled out if an FDVV curve is to be simulated correctly. To our knowledge, no prior work on button simulation has considered this issue, which may explain the lack of empirical evaluations of these simulators. To address the issue, we introduce an iterative compensation method shown in Figure 6:
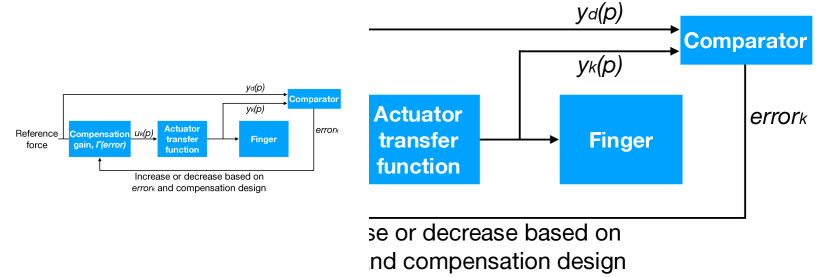
The idea is to raise or lower the force-actuation signal amplitude of each displacement point until the desired resisting force is measured by the sensor against the keycap. Per-displacement and per-speed repetition can be applied until the desired FDVV signal is measured from the sensor. This iterative compensation process can be expressed as
| (2) |
Here, is the actuation signal of a given displacement point in the current iteration, and is the actuation in the next iteration signal of the same displacement point. is the force detected from the sensor worn on the fingertip, and is the desired target force at that given displacement point. represents the proportion of adjustment of the actuation signal that must be applied, based on the error value in the current iteration (). The error from the current iteration is defined on a per-curve basis as follows:
| (3) |
In this definition, two terms make up the error. The first is the overall difference between the target FD curve and the measured curve. The second is the displacement error at which the largest error is observed. is the weight applied between thees two, which we set to 0.7 based on experiences.
Procedure: We first upload the reference data (FDVV model) to the simulator. A participant is asked to press the button repetitively in line with the speed indicator presented by a GUI. Figure 7 illustrates the whole process. The force sensor is connected to the same microprocessor that runs the simulator. The sensor (response rate: 1 kHz) captures the force responses during a press by the fingertip. The value sensed is passed through a resistor–capacitor filter with a 498 Hz cutoff rate, to reduce within sensor noise. All the resisting force samples within a 50 m interval are aggregated and averaged for this displacement point. In our experience, the procedure converges after only 8–12 presses; however, each button needs to be modeled at multiple velocities. With four velocities, there are 240 presses in total (4 velocities 4 rounds 15 presses) to compute its actuation signals. A typical example is presented in Figure 7 (b): decreases rapidly to below 3 cN within 10 presses.
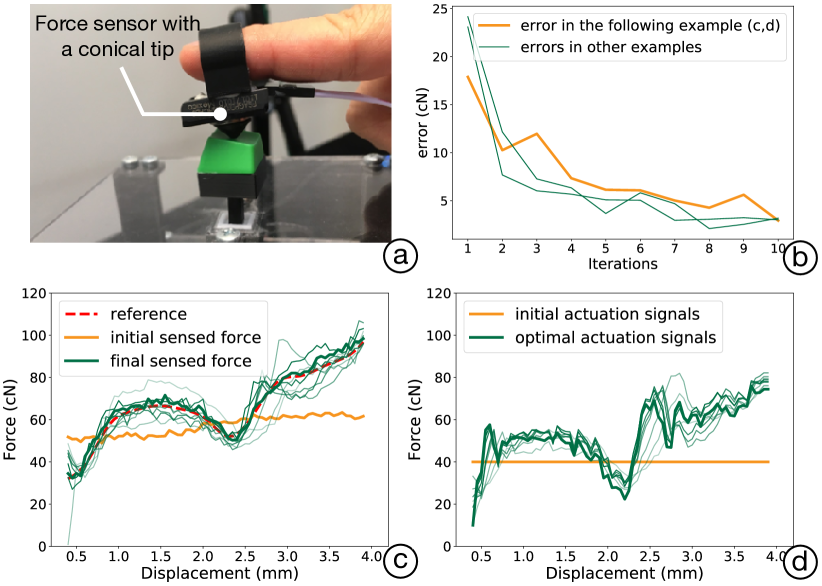
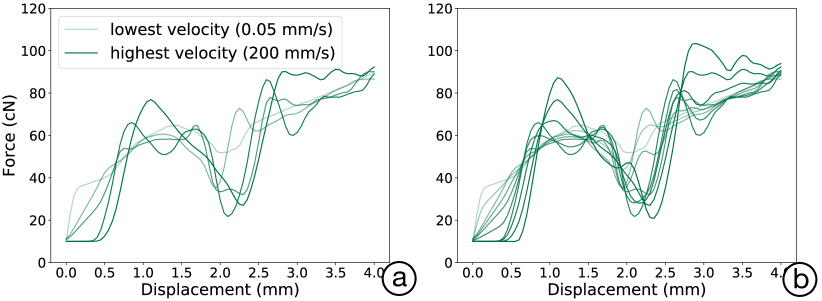
Outputs: After the process is complete, the microprocessor records the actuation signals that resulted in the minimal error. For a given reference force curve, we ran the iterative compensation process four times, obtaining four series of actuation signals. We then averaged these at each displacement and finally applied a Gaussian filter () to smooth the signals. After all the force-actuation signal curves were obtained (see Figure 8 (a)), we linearly interpolated the signal curves to form denser, more continuous curve sets that responded to more velocity changes (see Figure 8 (b)).
6.1 Optional human-in-the-loop vibration tuning
As described earlier, sometimes the vibration emitted at the snap point is weak and our sensor does not reliably pick it up accurately. Also, sometimes when vibration is measured as a soundwave, it may fail to reproduce the same sensation when reproduced using the vibration motor. In order to produce the desired snap sensation, the vibration needs to be accentuated. To this end, we devised a human-in-the-loop method for tuning the vibration response at the simulator side. To further render more realistic vibrotactile feedback, future work should consider more sophisticated modeling and rendering techniques[69, 49, 19, 52].
Procedure: We obtained 3 features from vibration measurements: (1) vibration onset, (2) duration and (3) frequency. Afterward, an algorithm generated several vibration templates that match the recorded vibration and duration. The generated templates are decaying sinusoidal waves with various frequencies and accentuated amplitudes. The generative method we follow is by Park et al.[53]. These sound-wave templates were uploaded to the Arduino Uno, which simulates them, using the vibrotactile motor (see Figure 5). Some templates are shown in Figure 9. Finally, as part of our human-in-the-loop tuning process, we asked a human observer to press the simulated button at the pace shown in the animation (see above). The user rated each button-design–vibration combination. We repeated this process for all velocities. The best-rated vibration sets were selected as the final actuation signals for that button.
7 A User Study: Perceived Realism
We assessed the perceived realism of the rendered buttons in a controlled study. We adopted the idea of ABX test as used in psychophysics for comparing two sensory stimulus options for identifying a target [43, 11, 30, 46]. A participant tries a real reference button (X) and is then asked to press two simulated buttons (A, B) and decide which offers a more realistic rendering of it. The A, B buttons are rendered via the same physical simulator, and the user can try out the three buttons as many times as desired. We compared our FDVV models against speed-agnostic FD models because it represents the prevailing understanding of button tactility represented in academic literature, hobbyist groups, and manufacturer datasheets.
7.1 Method
Participants: We recruited 12 participants (6 females) from a local university, of ages 21–41 (mean 29.75). All of them reported typing and other button-pressing experience. They were rewarded with a movie ticket (valued at 14 euros) for the 60-minute study.
Task and apparatus: The study compared six physical buttons listed previously in “Button Capture”. They differ in characteristics, but all are realistic. All the buttons were captured and transformed into (1) a single-FD model and (2) FDVV models. Actuation signals were computed as described in the previous section.
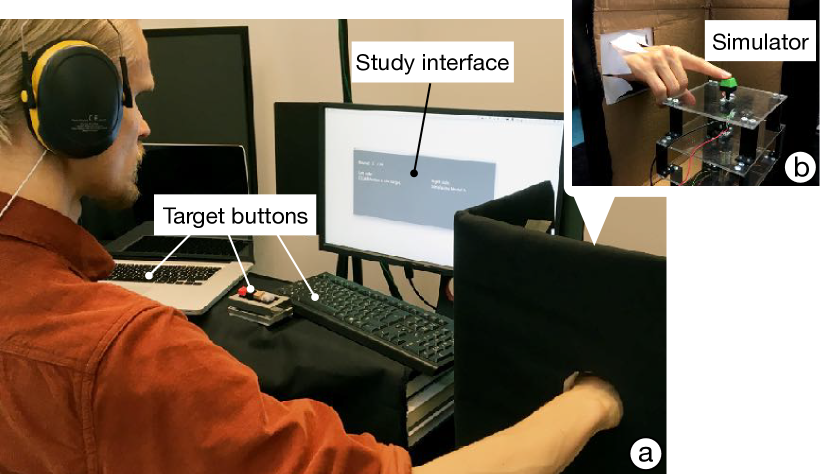
To prevent users’ haptic judgments from being biased by their vision, the simulator was placed inside a black box with a hole, into which the user reached to press. The target buttons and the simulator were at the same height. The participants were asked to wear a headset playing white noise and earmuffs, to isolate hearing during the study. A graphical interface showed which of the two buttons (labeled A and B) was currently active. The information displayed was the name of the target button (one of the six), the simulated button’s label (A or B), and the current trial number. Double-blind administration was employed: neither the experimenter nor the participant knew which button (A vs. B) used FDVV and which used FD.
Procedure and experiment design: The participants were told about the simulator and the purposes of the study. They were asked to explore the real buttons once, with different pressing velocities. We did not repeat this instruction during the study proper, though; we let them decide what was natural for them.
Again, each round featured a reference button and two simulated buttons. The interface identified the reference button and the label of the currently active button (see Figure 10). The participants were told that there are two simulated buttons in each round, denoted as button A and button B. In each round, participants were instructed to press the reference button and to feel it. After that, they were asked to try the alternative simulations, labeled A and B. They could switch among the three buttons as many times as they wished. When ready to make their judgment, they were asked to indicate which button had more realism (A, B, or equal) and to rate the perceived realism of A and B separately, on a seven-point Likert scale. After the study, an interview was conducted. We gave a three-minute break after every 20 minutes of button presses, to minimize fatigue. There were six rounds for each of the six buttons, making 36 trials in total. The trial order of the six button designs was counter-balanced by Latin square. The assignment of the FDVV and FD models to the labels, A and B, was randomized at each trial.
7.2 Results
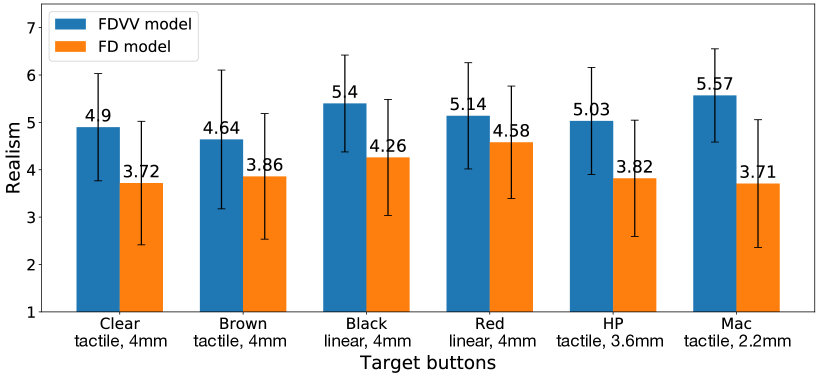
The results support the FDVV approach. It was associated with higher perceived realism for all the simulated buttons. The participants chose the FDVV model as more realistic 77.31% of the time. An overview is shown in Figure 11. We examined the ratings further by using Wilcoxon Signed Ranks Tests. The analysis showed that there are statistically significant differences for each target button between the FDVV and single-FD models:
-
1.
For the Clear button, the median FDVV model ranks (mdn 5.16, mean 4.9, STD 0.72) were significantly higher than the median single-FD ones (mdn 3.83, mean 3.72, STD 0.92), with , .
-
2.
For the Brown button, the median FDVV model ranks (mdn 4.92, mean 4.64, STD 1.02) were significantly higher than the median single-FD ones (mdn 3.83, mean 3.86, STD 0.87), with , .
-
3.
For the Black button, the median FDVV model ranks (mdn 5.33, mean 5.4, STD 0.53) were significantly higher than the median single-FD ones (mdn 3.83, mean 4.25, STD 0.72), with , .
-
4.
For the Red button, the median FDVV model ranks (mdn 5.33, mean 5.14, STD 0.9) were significantly higher than the median single-FD ones (mdn 4.67, mean 4.58, STD 0.54), with , .
-
5.
For the HP keyboard (spacebar), the median FDVV model ranks (mdn 5.33, mean 5.03, STD 0.58) were significantly higher than the median single-FD ranks (mdn 3.83, mean 4.0, STD 0.85), with , .
-
6.
For the MacBook Pro keyboard (spacebar), the median FDVV model ranks (mdn 5.42, mean 5.57, STD 0.57) were significantly higher than the median single-FD ranks (mdn 4.67, mean 3.67, STD 0.9), with , .
From Figure 11, we see that the smallest difference between the FDVV and FD simulation was for the Red button. This is a linear button, and the FD model offers a reasonable simulation. One participant stated, “The red one has a smooth (linear) feeling, and it’s lighter than the other buttons. I feel two models with a similarly smooth and light feeling, so it’s hard to tell the differences.”
8 Applications
We show three applications exploiting the approach.
8.1 Human-in-the-loop button optimization
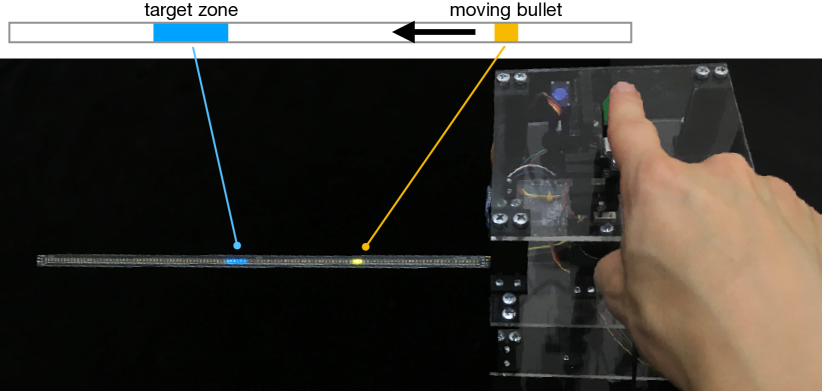
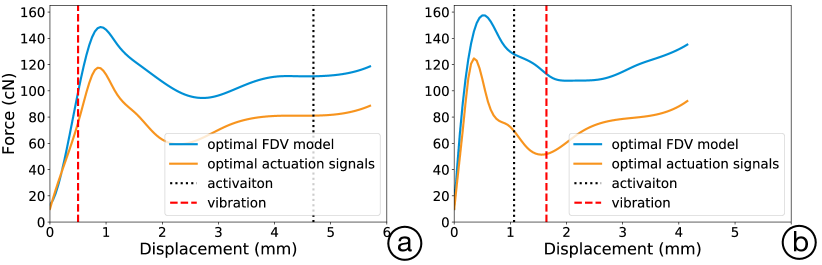
Firstly, we demonstrate the optimization of a button for an interactive task. We look at a temporal pointing task with no visual feedback [35]. It resembles games where a response must be elicited at just the right time (for instance, to catch an enemy). Our goal is to optimize the button’s FDV design and also its activation point. Velocity-dependent properties (the last V in FDVV) were excluded due to assuming a person presses a button at a similar speed all the time. The optimization we used was Bayesian optimization (BO), which is favorable for conditions wherein evaluations are noisy and expensive [62]. The objective in BO is to minimize a user’s mean asynchrony [35, 57], or the mean difference in time between the target and the user’s elicited response. Figure 14 depicts some example FDV models generated by the optimizer. To keep the study below one hour in total length, we limited the BO’s task to three control points and two other button parameters. We mapped this to the force-actuation signals, which the BO then manipulated so that once a new design is sent to the simulator, users can instantly try it out without iterative learning.
Method: We recruited 10 participants (4 females) from a local university, of ages 20–40 (mean 26). The study had two phases, training and validation. In the training phase, they were asked to press the button when the LED strip showed a bullet to have reached the center of the target zone. Two levels of task difficulty (easy = 100 pixels/second; difficult = 150 pixels/second) were used. For each level, 27 trials were collected and used to compute the mean asynchrony score. The whole process took about 60 minutes. Short breaks were given after every 15 minutes of presses.
Our BO implementation was based on Python’s GPyOpt library111 See http://sheffieldml.github.io/GPyOpt/. In each iteration, it changed the parameter values of the button model. We had three control points in the FDV and three other parameters: (displacements of three control points) and (actuation signals of those control points). The ranges of these six parameters were and . The other two additional parameters were activation point, , and vibration point, . The ranges of these two parameters were . An additional microprocessor, an Arduino Uno, was set to drive an LED strip (Adafruit DotStar) that displayed an array of LED lights with the bullet animation. This microprocessor was connected to the button simulator by software serial port. When the button passed the activation point, the microprocessor of the simulator sent a triggering signal to the LED strip, which would then calculate the temporal error of this press. After 20 presses, we calculated the mean asynchrony and sent the information back to the simulator. Then, the optimizer created a new design of button for the next iteration, based on the data collected, and triggered the simulator to reconfigure itself accordingly.
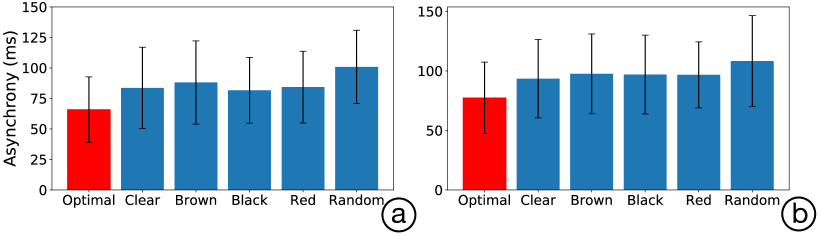
In the testing phase, a week after the training phase, the optimized button was compared to other non-optimized buttons: four 4 mm mechanical ones (Cherry MX Clear, Brown, Black, and Red) and a random button design (all parameters are randomly given within the defined range). Two difficulty levels are assigned in a counter-balanced order. Each button appeared twice per difficulty level, in counter-balanced order, and the participant needed to press the button 20 times in every trial. In total, we collected 240 observations of mean asynchrony (10 participants 2 difficulty levels 2 rounds 6 buttons).
Results: In Figure 13, we present some instances of optimal button designs. For the difficulty level Easy, the resulting mean asynchronies were 65.8 ms (STD 6.15), 83.6 (STD 7.65), 88.04 (STD 7.82), 81.65 (STD 6.19), 84.28 (STD 6.75), and 100.78 (STD 6.89), for the optimal, clear, brown, black, red, and random button, respectively. For the Hard difficulty level, the resulting mean asynchrony values are 77.3 ms (STD 6.89), 93.43 (STD 7.56), 97.48 (STD 7.69), 96.9 (STD 7.61), 96.65 (STD 6.36), and 108.22 (STD 8.77), for the optimal, clear, brown, black, red, and random button, respectively. A two-way repeated measures ANOVA was conducted. The main effect of buttons on mean asynchronies is significant, , . The post-hoc tests with Bonferroni correction confirmed the optimal button design as indeed outperforming the rest ().
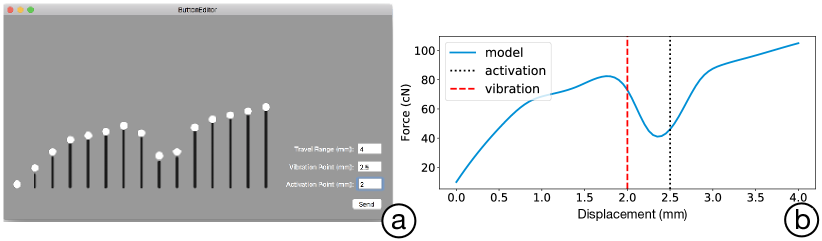
8.2 Interactive button design
We implement an interactive button-editing tool that lets engineers freely create and edit button designs (Figure 15). Using the tool (implemented on macOS using Swift), designers can manipulate force levels through 15 draggable control points to create a single-FD curve. Travel range, activation point, and vibration point can be edited textually. Next, the model is converted to high-dimensional force actuation signals (with B-spline fitting and iterative compensation). Finally, these signals are used to simulate the button. Several button designs implemented by the interactive button-editing tools are presented below, under “Innovative button designs.” While the tool allows for editing of one FDV model at a time, our backend (Python) also allows for more advanced editing, such as assigning a specific FD curve segment to be pressed or released, and merging multiple FD curves into an FDVV model.
8.3 Prototyping Innovative Buttons
Our setup enables prototyping innovative and extraordinary buttons that go beyond commodity designs. We give five examples here. The first two are instances of FDVV models, while the remaining are buttons that can be run on the simulator but can not be expressed as FDVV models.
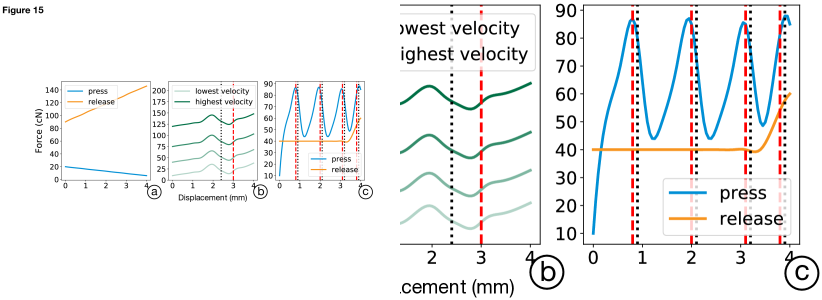
1. A fast tapping button: While humans can only reach about four presses per second in tapping tasks [57], we can increase this capacity via a novel button design. The principle is this: once a press is detected, the button drops to the bottom and returns automatically. This can be especially useful for content requiring high-frequency rhythmic tapping, such as music games (see Figure 16 (a)). One of the authors reached 8 presses per second with this button.
2. A non-Newtonian-fluid button: In non-Newtonian fluids, viscosity changes under force: the medium becomes either more liquid or more solid. We can design a button that adjusts its stiffness following pressing velocity; see Figure 16 (b). As a result, the button is softer when being pressed gently, but the resisting force increases during fast pressing. This design can be used to prevent accidental touches.
3. A multi-level button: We can extend the input modality of a button by giving multi-level haptic feedback. For example, a typical 4 mm button can be divided into several depth ranges. Through the provision of distinguishable haptic signals, a user can effectively activate different functions of the button by pressing down to different depths; see Figure 16 (c). This can be useful for easier use of single-button devices (e.g., in tuning the luminance of a lamp).
4. Vibration cues: We can deliver rich temporal information through continuous vibrotactile cues while the press is at the bottom. This interaction can enhance the effectiveness and efficiency of dwell-press applications[37]. For instance, when the shutter button of a camera is pressed and the camera is continuously shooting, vibration ticks can help the user easily count the number of shots via humans’ haptic sense.
5. A dynamically returning button: In certain situations, it might be desirable to avoid fast repetition with a given button. In the example of fighting games or shooting games, many attacks involve a cooldown time – i.e., a minimum duration before the next use of the relevant ability. Our simulator can easily render buttons with just such dynamic returning time, as demanded by the game content.
9 Conclusion
We have shown that the FDVV approach proposed as an extension to the dominant FD model increases the scope and perceived realism of button simulations. While this extension was motivated by prior literature, several engineering problems were solved to capture and simulate FDVV models. The added complexity notwithstanding, the core model is understandable and offers practitioners a workable starting point. We have demonstrated the benefit of model–simulator separation via three applications: human-in-the-loop button optimization, interactive button design, and examples of innovative buttons that would be tricky to realize without this approach.
While the FDVV approach permits greater realism, and opens many new practical possibilities, our results point also to clear opportunities for further improving realism. Firstly, the iterative compensation method can be enhanced, to better capture the dynamic effects of damping on the actuation signals. Our approach was to try to cancel the effect of the transfer function, but future research could consider learning a data-driven model of the black box through machine learning. This should be coupled with a clever controller design. Secondly, structural vibration can be modeled better. We opted to measure the snap-like vibration as a sound wave, but sometimes this was inadequate to reproduce the felt sensation of the tactile bump. To enhance the realism of the snap point, researchers could consider applying better measurement, modeling and controlling methods for handling the vibration[49, 52]. This would eliminate the human-dependent part of the vibration modeling. While these changes would increase realism, perfect button simulation entails simulating the texture and shape of the keycap, the sound emitted, etc. Finally, once a button has been designed and tested, a suitable electromechanical design should be fabricated. This presents an interesting challenge for future work aimed at bridging the gap between buttons in vitro and buttons in vivo.
10 Open Science
The materials and data in this paper are released on our project page at http://userinterfaces.aalto.fi/button-design. The materials include 3D models, circuit design, component specifications, construction details of the simulator, and the programs for controllers. The cost for the simulator construction is about $550. From capturing a button to simulation via our pipeline takes about an hour (5 minutes for capturing, 30 minutes for data preprocessing and FDVV modeling, and 30 minutes for iterative compensation and simulation). All the data for button measurements and experiments are released too. The materials also complement Figure 1 and Figure 8 with the graphs of other buttons.
11 Acknowledgement
This work has been funded by the European Research Council (ERC) under the European Union’s Horizon 2020 research and innovation programme (grant agreement No 637991) and by Korea Creative Content Agency (grant agreement No R2019020010).
References
- [1]
- [2] Victoria. E. Abraira and David. D. Ginty. 2013. The Sensory Neurons of Touch. Neuron 79, 4 (2013), 618 – 639. DOI:http://dx.doi.org/10.1016/j.neuron.2013.07.051
- [3] Kenichi Akagi. 1992. A Computer Keyboard Key Feel Study in Performance and Preference. Proceedings of the Human Factors and Ergonomics Society Annual Meeting 36, 5 (1992), 523–527. DOI:http://dx.doi.org/10.1177/154193129203600511
- [4] B. Allotta, V. Colla, and G. Bioli. 1999. A mechatronic device for simulating push-buttons and knobs. In Proceedings IEEE International Conference on Multimedia Computing and Systems, Vol. 1. 636–642 vol.1. DOI:http://dx.doi.org/10.1109/MMCS.1999.779274
- [5] M. Angerilli, A. Frisoli, F. Salsedo, S. Marcheschi, and M. Bergamasco. 2001. Haptic simulation of an automotive manual gearshift. In Proceedings 10th IEEE International Workshop on Robot and Human Interactive Communication. ROMAN 2001 (Cat. No.01TH8591). 170–175. DOI:http://dx.doi.org/10.1109/ROMAN.2001.981897
- [6] Jonathan Becedas, Gabriela Mamani, Vicente Feliu, and Hebertt Sira-Ramírez. 2009. Estimation of Mass-Spring-Dumper Systems. Springer Netherlands, Dordrecht, 411–422. DOI:http://dx.doi.org/10.1007/978-1-4020-8919-0_28
- [7] Jonathan Becedas, Gabriela Mamani, Vicente Feliu-Batlle, and Hebertt Sira-Ramírez. 2007. Algebraic Identification Method for Mass-Spring-Damper System.
- [8] Ingvars Birznieks, Per Jenmalm, Antony W. Goodwin, and Roland S. Johansson. 2001. Encoding of Direction of Fingertip Forces by Human Tactile Afferents. Journal of Neuroscience 21, 20 (2001), 8222–8237. DOI:http://dx.doi.org/10.1523/JNEUROSCI.21-20-08222.2001
- [9] Stephen P. Boyd and Craig H. Barratt. 1991. Linear Controller Design: Limits of Performance. Prentice-Hall, Inc., Upper Saddle River, NJ, USA.
- [10] Andy Clark. 2013. Whatever next? Predictive brains, situated agents, and the future of cognitive science. Behavioral and Brain Sciences 36, 3 (2013), 181–204. DOI:http://dx.doi.org/10.1017/S0140525X12000477
- [11] David Clark. 1982. High-Resolution Subjective Testing Using a Double-Blind Comparator. J. Audio Eng. Soc 30, 5 (1982), 330–338. http://www.aes.org/e-lib/browse.cfm?elib=3839
- [12] M. B. Colton and J. M. Hollerbach. 2005. Identification of nonlinear passive devices for haptic simulations. In First Joint Eurohaptics Conference and Symposium on Haptic Interfaces for Virtual Environment and Teleoperator Systems. World Haptics Conference. 363–368. DOI:http://dx.doi.org/10.1109/WHC.2005.77
- [13] Matthew J. C. Crump and Gordon D. Logan. 2010. Warning: This keyboard will deconstruct— The role of the keyboard in skilled typewriting. Psychonomic Bulletin & Review 17, 3 (01 Jun 2010), 394–399. DOI:http://dx.doi.org/10.3758/PBR.17.3.394
- [14] R. S. Dahiya, G. Metta, M. Valle, and G. Sandini. 2010. Tactile Sensing—From Humans to Humanoids. IEEE Transactions on Robotics 26, 1 (Feb 2010), 1–20. DOI:http://dx.doi.org/10.1109/TRO.2009.2033627
- [15] C. Doerrer and R. Werthschuetzky. 2002. Simulating Push-Buttons Using a Haptic Display: Requirements on Force Resolution and Force-Displacement Curve. (2002).
- [16] K. FUJITA. 2001. A New Softness Display Interface by Dynamic Fingertip Contact Area Control. 5th World Multiconference on Systemics, Cybernetics and Informatics, 2001 (2001), 78–82. https://ci.nii.ac.jp/naid/10031028472/en/
- [17] Nico Galoppo, Serhat Tekin, Miguel A. Otaduy, Markus Gross, and Ming C. Lin. 2007. Interactive Haptic Rendering of High-Resolution Deformable Objects. In Virtual Reality, Randall Shumaker (Ed.). Springer Berlin Heidelberg, Berlin, Heidelberg, 215–223.
- [18] T. Hachisu, G. Cirio, M. Marchal, A. Lécuyer, and H. Kajimoto. 2011. Pseudo-haptic feedback augmented with visual and tactile vibrations. In 2011 IEEE International Symposium on VR Innovation. 327–328. DOI:http://dx.doi.org/10.1109/ISVRI.2011.5759662
- [19] T. Hachisu and H. Kajimoto. 2017. Vibration Feedback Latency Affects Material Perception During Rod Tapping Interactions. IEEE Transactions on Haptics 10, 2 (April 2017), 288–295. DOI:http://dx.doi.org/10.1109/TOH.2016.2628900
- [20] Vincent Hayward and Brian Armstrong. 2000. A new computational model of friction applied to haptic rendering. In Experimental Robotics VI. Springer London, London, 403–412.
- [21] Robert D. Howe and Mark R. Cutkosky. 1989. Sensing skin acceleration for slip and texture perception. Proceedings, 1989 International Conference on Robotics and Automation (1989), 145–150 vol.1.
- [22] Yoshiaki Ikeda and Kinya Fujita. 2004. Display of Soft Elastic Object by Simultaneous Control of Fingertip Contact Area and Reaction Force. Transactions of the Virtual Reality Society of Japan 9, 2 (2004), 187–194. DOI:http://dx.doi.org/10.18974/tvrsj.9.2_187
- [23] Devin L Jindrich, Aruna D Balakrishnan, and Jack T Dennerlein. 2004. Effects of keyswitch design and finger posture on finger joint kinematics and dynamics during tapping on computer keyswitches. Clinical Biomechanics 19, 6 (2004), 600 – 608. DOI:http://dx.doi.org/https://doi.org/10.1016/j.clinbiomech.2004.03.003
- [24] Hiroyuki Kajimoto, Naoki Kawakami, Taro Maeda, and Susumu Tachi. 2001. Electro-Tactile Display with Force Feedback.
- [25] Krueger L. (Ed.) Krueger L. (Ed.) Katz, D. 1989. The World of Touch. New York: Psychology Press. DOI:http://dx.doi.org/https://doi.org/10.4324/9780203771976
- [26] Johan Kildal. 2010. 3D-press: Haptic Illusion of Compliance when Pressing on a Rigid Surface. In International Conference on Multimodal Interfaces and the Workshop on Machine Learning for Multimodal Interaction (ICMI-MLMI ’10). ACM, New York, NY, USA, Article 21, 8 pages. DOI:http://dx.doi.org/10.1145/1891903.1891931
- [27] Jeong Ho Kim, Lovenoor Aulck, Michael C. Bartha, Christy A. Harper, and Peter W. Johnson. 2014a. Differences in typing forces, muscle activity, comfort, and typing performance among virtual, notebook, and desktop keyboards. Applied Ergonomics 45, 6 (2014), 1406 – 1413. DOI:http://dx.doi.org/https://doi.org/10.1016/j.apergo.2014.04.001
- [28] Jeong Ho Kim, Lovenoor S. Aulck, Michael C. Bartha, Christy A. Harper, and Peter W. Johnson. 2014b. Differences in typing forces, muscle activity, comfort, and typing performance among virtual, notebook, and desktop keyboards. Applied ergonomics 45 6 (2014), 1406–13.
- [29] Sunjun Kim, Byungjoo Lee, and Antti Oulasvirta. 2018. Impact Activation Improves Rapid Button Pressing. In Proceedings of the 2018 CHI Conference on Human Factors in Computing Systems (CHI ’18). ACM, New York, NY, USA, Article 571, 8 pages. DOI:http://dx.doi.org/10.1145/3173574.3174145
- [30] Sunjun Kim and Geehyuk Lee. 2013. Haptic Feedback Design for a Virtual Button Along Force-displacement Curves. In Proceedings of the 26th Annual ACM Symposium on User Interface Software and Technology (UIST ’13). ACM, New York, NY, USA, 91–96. DOI:http://dx.doi.org/10.1145/2501988.2502041
- [31] Sunjun Kim, Jeongmin Son, Geehyuk Lee, Hwan Kim, and Woohun Lee. 2013. TapBoard: Making a Touch Screen Keyboard More Touchable. In Proceedings of the SIGCHI Conference on Human Factors in Computing Systems (CHI ’13). ACM, New York, NY, USA, 553–562. DOI:http://dx.doi.org/10.1145/2470654.2470733
- [32] Sadanori Konishi and Genshiro Kitagawa. 2007. Information Criteria and Statistical Modeling (1st ed.). Springer Publishing Company, Incorporated.
- [33] K. J. Kuchenbecker, J. Fiene, and G. Niemeyer. 2006. Improving contact realism through event-based haptic feedback. IEEE Transactions on Visualization and Computer Graphics 12, 2 (March 2006), 219–230. DOI:http://dx.doi.org/10.1109/TVCG.2006.32
- [34] Byungjoo Lee, Sunjun Kim, Antti Oulasvirta, Jong-In Lee, and Eunji Park. 2018. Moving Target Selection: A Cue Integration Model. In Proceedings of the 2018 CHI Conference on Human Factors in Computing Systems (CHI ’18). ACM, New York, NY, USA, Article 230, 12 pages. DOI:http://dx.doi.org/10.1145/3173574.3173804
- [35] Byungjoo Lee and Antti Oulasvirta. 2016. Modelling Error Rates in Temporal Pointing. In Proceedings of the 2016 CHI Conference on Human Factors in Computing Systems (CHI ’16). ACM, New York, NY, USA, 1857–1868. DOI:http://dx.doi.org/10.1145/2858036.2858143
- [36] James R Lewis, Kathleen M Potosnak, and Regis L Magyar. 1997. Keys and keyboards. In Handbook of human-computer interaction. Elsevier, 1285–1315.
- [37] Yi-Chi Liao, Yen-Chiu Chen, Liwei Chan, and Bing-Yu Chen. 2017. Dwell+: Multi-Level Mode Selection Using Vibrotactile Cues. In Proceedings of the 30th Annual ACM Symposium on User Interface Software and Technology (UIST ’17). ACM, New York, NY, USA, 5–16. DOI:http://dx.doi.org/10.1145/3126594.3126627
- [38] Yi-Chi Liao, Sunjun Kim, and Antti Oulasvirta. 2018. One Button to Rule Them All: Rendering Arbitrary Force-Displacement Curves. In The 31st Annual ACM Symposium on User Interface Software and Technology Adjunct Proceedings (UIST ’18 Adjunct). ACM, New York, NY, USA, 111–113. DOI:http://dx.doi.org/10.1145/3266037.3266118
- [39] Karon E. MacLean and William K. Durfee. 1995. Apparatus to study the emulation of haptic feedback. In ASME Dynamic Systems and Control Division, Vol. 57-2. ASME, 615–621.
- [40] Karon E. MacLean. 1996. The”Haptic Camera”: a technique for characterizing and playing back haptic properties of real envi.
- [41] Richard W. Marklin and Mark L. Nagurka. 2000. Measurement of Stiffness and Damping Characateristics of Computer Keyboard Keys. Proceedings of the Human Factors and Ergonomics Society Annual Meeting 44, 6 (2000), 678–681. DOI:http://dx.doi.org/10.1177/154193120004400637
- [42] Thomas H. Massie and J. K. Salisbury. 1994. The PHANToM haptic interface: A device for probing virtual objects. In Proceedings of the ASME Dynamic Systems and Control Division. 295–301.
- [43] Carr B. Carr B. Meilgaard, M. 2007. Sensory Evaluation Techniques (4th edition ed.). Boca Raton: CRC Press. DOI:http://dx.doi.org/https://doi.org/10.1201/b16452
- [44] Leonard Meirovitch. 1997. Principles and techniques of vibrations. Vol. 1. Prentice Hall New Jersey.
- [45] G. Moy, C. Wagner, and R. S. Fearing. 2000. A compliant tactile display for teletaction. In Proceedings 2000 ICRA. Millennium Conference. IEEE International Conference on Robotics and Automation. Symposia Proceedings (Cat. No.00CH37065), Vol. 4. 3409–3415 vol.4. DOI:http://dx.doi.org/10.1109/ROBOT.2000.845247
- [46] W. A. Munson and Mark B. Gardner. 1950. Standardizing Auditory Tests. The Journal of the Acoustical Society of America 22, 5 (1950), 675–675. DOI:http://dx.doi.org/10.1121/1.1917190
- [47] Ken Nakagaki, Daniel Fitzgerald, Zhiyao (John) Ma, Luke Vink, Daniel Levine, and Hiroshi Ishii. 2019. inFORCE: Bi-directional ‘Force’ Shape Display for Haptic Interaction. In Proceedings of the Thirteenth International Conference on Tangible, Embedded, and Embodied Interaction (TEI ’19). ACM, New York, NY, USA, 615–623. DOI:http://dx.doi.org/10.1145/3294109.3295621
- [48] Daichi Ogawa, Vibol Yem, Taku Hachisu, and Hiroyuki Kajimoto. 2015. Multiple Texture Button by Adding Haptic Vibration and Displacement Sensing to the Physical Button. In SIGGRAPH Asia 2015 Haptic Media And Contents Design (SA ’15). ACM, New York, NY, USA, Article 12, 2 pages. DOI:http://dx.doi.org/10.1145/2818384.2818394
- [49] A. M. Okamura, M. R. Cutkosky, and J. T. Dennerlein. 2001. Reality-based models for vibration feedback in virtual environments. IEEE/ASME Transactions on Mechatronics 6, 3 (Sep. 2001), 245–252. DOI:http://dx.doi.org/10.1109/3516.951362
- [50] Antti Oulasvirta, Sunjun Kim, and Byungjoo Lee. 2018. Neuromechanics of a Button Press. In Proceedings of the 2018 CHI Conference on Human Factors in Computing Systems (CHI ’18). ACM, New York, NY, USA, Article 508, 13 pages. DOI:http://dx.doi.org/10.1145/3173574.3174082
- [51] Dinesh K. Pai, Austin Rothwell, Pearson Wyder-Hodge, Alistair Wick, Ye Fan, Egor Larionov, Darcy Harrison, Debanga Raj Neog, and Cole Shing. 2018. The Human Touch: Measuring Contact with Real Human Soft Tissues. ACM Trans. Graph. 37, 4, Article 58 (July 2018), 12 pages. DOI:http://dx.doi.org/10.1145/3197517.3201296
- [52] Gunhyuk Park and Seungmoon Choi. 2018. PhysVib: Physically Plausible Vibrotactile Feedback Library to Collisions on a Mobile Device. In Haptic Interaction, Shoichi Hasegawa, Masashi Konyo, Ki-Uk Kyung, Takuya Nojima, and Hiroyuki Kajimoto (Eds.). Springer Singapore, Singapore, 409–413.
- [53] Gunhyuk Park, Seungmoon Choi, Kyunghun Hwang, Sunwook Kim, Jaecheon Sa, and Moonchae Joung. 2011. Tactile Effect Design and Evaluation for Virtual Buttons on a Mobile Device Touchscreen. In Proceedings of the 13th International Conference on Human Computer Interaction with Mobile Devices and Services (MobileHCI ’11). Association for Computing Machinery, New York, NY, USA, 11–20. DOI:http://dx.doi.org/10.1145/2037373.2037376
- [54] David Posada and Thomas R. Buckley. 2004. Model Selection and Model Averaging in Phylogenetics: Advantages of Akaike Information Criterion and Bayesian Approaches Over Likelihood Ratio Tests. Systematic Biology 53, 5 (10 2004), 793–808. DOI:http://dx.doi.org/10.1080/10635150490522304
- [55] Robert G. Radwin and One-Jang Jeng. 1997. Activation Force and Travel effects on Overexertion in Repetitive Key Tapping. Human Factors 39, 1 (1997), 130–140. DOI:http://dx.doi.org/10.1518/001872097778940605 PMID: 9302885.
- [56] David Rempel, Elaine Serina, Edward Klinenberg, Bernard J. Martin, Thomas J. Armstrong, James A. Foulke, and Sivakumaran Natarajan. 1997. The effect of keyboard keyswitch make force on applied force and finger flexor muscle activity. Ergonomics 40, 8 (1997), 800–808. DOI:http://dx.doi.org/10.1080/001401397187793 PMID: 9336104.
- [57] Bruno H. Repp. 2005. Sensorimotor synchronization: A review of the tapping literature. Psychonomic Bulletin & Review 12, 6 (01 Dec 2005), 969–992. DOI:http://dx.doi.org/10.3758/BF03206433
- [58] Yann Roudaut, Aurélie Lonigro, Bertrand Coste, Jizhe Hao, Patrick Delmas, and Marcel Crest. 2012. Touch sense. Channels 6, 4 (2012), 234–245. DOI:http://dx.doi.org/10.4161/chan.22213 PMID: 23146937.
- [59] J. K. Salisbury and M. A. Srinivasan. 1997. Phantom-based haptic interaction with virtual objects. IEEE Computer Graphics and Applications 17, 5 (Sep. 1997), 6–10. DOI:http://dx.doi.org/10.1109/MCG.1997.1626171
- [60] Robert A. Scheidt, Michael A. Conditt, Emanuele L. Secco, and Ferdinando A. Mussa-Ivaldi. 2005. Interaction of Visual and Proprioceptive Feedback During Adaptation of Human Reaching Movements. Journal of Neurophysiology 93, 6 (2005), 3200–3213. DOI:http://dx.doi.org/10.1152/jn.00947.2004 PMID: 15659526.
- [61] E. P. Scilingo, M. Bianchi, G. Grioli, and A. Bicchi. 2010. Rendering Softness: Integration of Kinesthetic and Cutaneous Information in a Haptic Device. IEEE Transactions on Haptics 3, 2 (April 2010), 109–118. DOI:http://dx.doi.org/10.1109/TOH.2010.2
- [62] Bobak Shahriari, Kevin Swersky, Ziyu Wang, Ryan P Adams, and Nando De Freitas. 2015. Taking the human out of the loop: A review of Bayesian optimization. Proc. IEEE 104, 1 (2015), 148–175.
- [63] Aiguo Song, Jia Liu, and Juan Wu. 2008. Softness Haptic Display Device for Human- Computer Interaction. In Human Computer Interaction, Ioannis Pavlidis (Ed.). IntechOpen, Rijeka, Chapter 16. DOI:http://dx.doi.org/10.5772/6299
- [64] Paul Strohmeier and Kasper Hornbæk. 2017. Generating Haptic Textures with a Vibrotactile Actuator. In Proceedings of the 2017 CHI Conference on Human Factors in Computing Systems (CHI ’17). ACM, New York, NY, USA, 4994–5005. DOI:http://dx.doi.org/10.1145/3025453.3025812
- [65] Seiya Takei, Ryo Watanabe, Ryuta Okazaki, Taku Hachisu, and Hiroyuki Kajimoto. 2015. Presentation of Softness Using Film-Type Electro-Tactile Display and Pressure Distribution Measurement. Springer Japan, Tokyo, 91–96. DOI:http://dx.doi.org/10.1007/978-4-431-55690-9_17
- [66] A. B. Vallbo and Roland Johansson. 1999. Properties of cutaneous mechanoreceptors in the human hand-related to touch sensation.
- [67] Wenping Wang, Helmut Pottmann, and Yang Liu. 2006. Fitting B-spline Curves to Point Clouds by Curvature-based Squared Distance Minimization. ACM Trans. Graph. 25, 2 (April 2006), 214–238. DOI:http://dx.doi.org/10.1145/1138450.1138453
- [68] D. W. Weir, M. Peshkin, J. E. Colgate, P. Buttolo, J. Rankin, and M. Johnston. 2004. The haptic profile: capturing the feel of switches. In 12th International Symposium on Haptic Interfaces for Virtual Environment and Teleoperator Systems, 2004. HAPTICS ’04. Proceedings. 186–193. DOI:http://dx.doi.org/10.1109/HAPTIC.2004.1287195
- [69] Parris S. Wellman and Robert D. Howe. 1995. Towards Realistic Vibrotactile Display In Virtual Environments.
- [70] K.J. Åström and T. Hägglund. 2001. The future of PID control. Control Engineering Practice 9, 11 (2001), 1163 – 1175. DOI:http://dx.doi.org/https://doi.org/10.1016/S0967-0661(01)00062-4