A broadband X-ray view of the NLSy1 1E 0754.6+392.8
Abstract
Context. The soft X-ray band of many active galactic nuclei (AGN) is affected by obscuration due to partially ionised matter crossing our line of sight. In this context, two past XMM-Newton observations (6 months apart) and a simultaneous NuSTAR-Swift (8 years later) exposure of the Narrow Line Seyfert 1 galaxy 1E 0754.6+392.8 revealed an intense and variable WA and hints of additional absorbers in the Fe K band.
Aims. We aim at providing the first X-ray characterisation of this AGN discussing its broadband (0.3-79 keV) spectrum and temporal properties.
Methods. We conduct a temporal and spectroscopic analysis on two 10 ks (net exposure) XMM-Newton snapshots performed in April and October 2006. We also study the high energy behaviour of 1E 0754.6+392.8 modelling its broadband spectrum using simultaneous Swift-NuSTAR data. Both phenomenological and physically motivated models are tested.
Results. We find the presence of flux variability (150% and 30% for 0.3-2 and 2-10 keV bands, respectively) and spectral changes at months timescales (0.4). A reflection component that is consistent with being constant over years and arising from relatively cold material far from the central super massive black hole is detected. The main spectral feature shaping the 1E 0754.6+392.8 spectrum is a warm absorber. Such a component is persistent over the years and variability of its ionisation and column density is observed down on months in the ranges 3 N and 1.5 2.1. Despite the short exposures, we find possible evidence of two additional high-ionisation and high-velocity outflow components in absorption.
Conclusions. Our analysis suggests the existence of a complex system of absorbers in 1E 0754.6+392.8. Longer exposures are mandatory in order to characterise, on more solid grounds, the absorbers in this AGN.
Key Words.:
galaxies:active – galaxies:Seyfert – quasars:general – X-rays:galaxies1 Introduction
Active galactic nuclei (AGNs) lie in the central region of galaxies, and their emission is observed from gamma rays down to radio frequencies. Most of the released energy is emitted in the optical-UV band due to accretion of gas from a disc surrounding a supermassive black hole (SMBH, Event Horizon Telescope Collaboration et al., 2019). Moreover, most AGNs are luminous in the X-ray band, and this energetic emission can be explained in terms of an inverse Compton mechanism involving seed disc photons and a distribution of thermal electrons overlying the disc, the so-called hot corona (e.g. Haardt & Maraschi, 1991, 1993). In X-rays, AGNs display a power law-like spectrum (e.g. Guainazzi et al., 1999; Bianchi et al., 2009), which depends on the physical conditions of the coronal plasma (i.e. electron temperature and optical depth). At hard X-ray energies, an exponential cut-off is often observed (e.g. Fabian et al., 2015, 2017; Tortosa et al., 2018), and it is interpreted as a further signature of the nuclear Comptonisation (Rybicki & Lightman, 1979). The coronal emission can further interact with the SMBH surroundings, and the emerging spectra can be modified by absorption and reflection. The reprocessing of the primary emission gives rise to additional spectral features such as a Compton hump at about 30 keV (e.g. Matt et al., 1991; George & Fabian, 1991) and a fluorescence Fe K emission line.
A detailed analysis of absorption profiles in X-ray spectra can provide additional information about the surroundings of the central engine. About 50% of AGNs (Reynolds, 1997) display soft X-ray absorption features due to ionised gas along the line of sight which are indicative of a warm absorber (WA, Blustin et al., 2005). Such phenomenon, first reported in Halpern (1984), consists in a spectral dip, indicating distant outflowing material covering the inner X-ray emission at 1 keV. High resolution spectroscopy provides the best way to discern and characterise the outflowing components (e.g. Longinotti et al., 2010; Behar et al., 2017; Laha et al., 2014, 2016; Mao et al., 2019), though low resolution studies still provide insights and can be applied on a larger number of sources (e.g. Piconcelli et al., 2005; Tombesi et al., 2010; Gofford et al., 2013; Cappi et al., 2016). The ionisation parameter of the WAs is typically in the range 0–3 and the equivalent hydrogen column density is between NH– cm-2. The relative absorption lines and edges are often blue-shifted, indicating that the gas is outflowing with velocities from v km s-1 up to v km s-1.
Highly blueshifted Fe K absorption lines indicative of ultra fast outflows (UFOs) with velocities higher than 10000 km s-1 have been reported in the X-ray spectra of several AGNs (e.g. Tombesi et al., 2010; Gofford et al., 2013). The ionisation of this outflowing plasma can be very high, in the range 3-6 and the column density is also large, up to values of cm-2 (e.g. Tombesi et al., 2011). Recent studies are reporting on the presence of multi-structured disc winds. Reeves et al. (2018) found an additional component of the fast wind in PDS 456 while caught in the a low-flux state with XMM-Newton and NuSTAR, while the case of MCG-03-58-007 is discussed in Braito et al. (2018) and Matzeu et al. (2019). Moreover, a positive correlation between the outflow velocity of the UFOs and the X-ray luminosity (e.g. Matzeu et al., 2017; Pinto et al., 2018) has been observed, and this is expected in a radiatively driven wind scenario.
These disc winds are observed at sub-parsec scales from the central SMBH and seem to be powerful enough to affect the host galaxy environment (e.g. Tombesi et al., 2012). Indeed, the recent detection of UFOs in some ultra-luminous infrared galaxies (ULIRGs) showed that they are likely responsible for driving the observed massive, large-scale interstellar matter (ISM) outflows (e.g. Tombesi et al., 2015, 2017; Feruglio et al., 2015; Fiore et al., 2017; Veilleux et al., 2017) , and that they may quench star formation as expected from AGNs feedback models (e.g. Zubovas & King, 2012; Faucher-Giguère & Quataert, 2012).
In this paper we focus on the X-ray analysis of 1E 0754.6+392.8 . This object is one of the two brightest AGNs in the NuSTAR serendipitous source catalogue (Lansbury et al., 2017), the other being HE 0436-4717 (Middei et al., 2018b). 1E 0754.6+392.8 is classified by Berton et al. (2015) as a local () radio quiet Narrow Line Seyfert 1 galaxy (NLS1, see also Enya et al., 2002). For the mass of the central black hole, we adopt the single-epoch estimate by Berton et al. (2015), MBH/M, consistent with the reverberation-based value M reported by Sergeev et al. (2007). The bolometric luminosity and Eddington ratio are estimated as (L=45.4 and (Lbol/LEdd)=-0.85 (Berton et al., 2015). Although several works discuss the optical properties of 1E 0754.6+392.8, this source is poorly studied in the X-rays. The Einstein observatory (Giacconi et al., 1979) observed this AGN and Gioia et al. (1990) reported its flux to be F=1.810-12 ergs cm-2 s-1. Throughout the paper, the standard cosmology CDM with H0=70 km s-1 Mpc-1, =0.27, =0.73, is adopted.
2 Data reduction
| Satellite | Instrument | Obs. ID | Net exp. | Start-date |
| (ks) | yyyy-mm-dd | |||
| XMM-Newton | PN | 0305990101 | 13.5 | 2006-04-18 |
| XMM-Newton | PN | 0406740101 | 14.7 | 2006-10-22 |
| NuSTAR | FPMA/B | 60001131002 | 45.1 | 2014-09-12 |
| Swift | XRT | 00080595001 | 2.7 | 2014-09-12 |
This work takes advantage of two archival XMM-Newton observations and one Swift-NuSTAR simultaneous observation (see the log in Tab. 1). The XMM-Newton (Jansen et al., 2001) observatory pointed twice 1E 0754.6+392.8 on April 18 2006 and October 22 2006. NuSTAR (Harrison et al., 2013) observed the source serendipitously on September 12 2014 (Lansbury et al., 2017) simultaneously with Swift.
XMM-Newton data were processed using the XMM-Newton Science Analysis System (, Version 18.0.0). To select the extraction radius of each observation and to screen for high background time intervals we used an iterative process that maximises the Signal-to-Noise (S/N) ratio in the 3-9 keV band (details in Piconcelli et al., 2004). We therefore use a 19 arcsec radius for extracting the source in Obs. 1, while a 40 arcsec of circular region was found to maximise the S/N ratio for Obs. 2. We extract the background of both the observations from a circular region of 50 arcsec radius located on a blank area of the detector close to the source. We binned all the spectra to have at least 25 counts for each bin, and not to oversample the instrumental energy resolution by a factor larger than 3.
Data from the MOS detectors have a much lower statistics even when the spectra are co-added. Being our analysis mainly focused on the Fe K energy band, we decided to use only PN due to the lower statistics of the co-added MOS spectrum.
The NuSTAR observation was reduced in accordance with the standard procedure described in Perri et al., 2013, and using HEASOFT (v. 6.25), NuSTARDAS (v 1.8.0) and the ‘x20180710’ version of the calibration database. Spectra were extracted for both the hard X-ray detectors FPMA/B on the NuSTAR focal plane. A circular extraction region with 40 arcsec radius was used for the source, while the background was obtained adopting a region of the same size in a blank area of the same chip. The NuSTAR spectra were binned not to over-sample the instrumental resolution by a factor larger than of 2.5 and to have a S/N greater than 3 in each spectral channel.
Finally, we used online facilities provided by the ASI Space Science Data Center (SSDC) for processing and reducing the Swift/XRT data (multimission archive, http://www.ssdc.asi.it/mma.html). The spectrum was extracted from a circular region with a radius of 20 arcsec centered on the source while the background was sampled from an annular region extending between 40 arcsec and 80 arcsec around the source. For spectral fitting we use the source spectrum binned to a minimum of 20 counts per bin.
The spectra of the whole dataset, unfolded using a =2 power law model with common normalisation, are shown in Fig. 1.

3 Spectral and timing analysis
We consider the EPIC-pn data in the E=0.3-10 keV energy band and the NuSTAR-Swift/XRT simultaneous observation in the 0.5-79 keV band. We point out that XMM-Newton/NuSTAR exposures are about 8 years apart, thus their corresponding spectra are not simultaneously fitted. A Galactic column density of NH=5.6 cm-2 (HI4PI Collaboration et al., 2016) is always considered when fitting the spectra. Finally, in the text errors are quoted at 90% confidence level and errors in the plots account for 68% uncertainties.
3.1 Swift/XRT-NuSTAR: The 0.5-79 keV band
We investigated the temporal properties of the NuSTAR observation first. The 3-10 keV light curve reveals the presence of intra-observation variability (up to a factor of 2) while a more constant behaviour characterises the 10-30 keV band, see Fig. 2. No significant spectral variability is observed, thus we considered the source spectrum integrated over the whole observation length.

To model the primary continuum, we simultaneously fit the Swift/NuSTAR data with a power law in the 3-10 keV band. Moreover, a cross-normalisation constant is included as a free parameter to account for the different instruments involved. This crude model leads to a good fit characterised by =71 for 66 d.o.f. and a corresponding =1.950.04 and normalisation Npo=(2.50.2)10-3 photons kev-1 cm-2 s-1. The cross-calibration constants for Swift and NuSTAR are found to be consistent within 10%, while the two NuSTAR modules agree each other within a .
When considering the 0.5-79 keV data, the tested model turns out to be unacceptable in terms of statistics (=247 for 176 d.o.f. ), mainly due to absorption affecting the soft X-rays, see Fig. 3. To model this absorption, we included a detailed grid computed with the photoionisation code XSTAR Kallman & Bautista (2001). This table takes into account absorption lines and edges for all the metals characterised by an atomic number 30. The XSTAR table is calculated assuming a typical =2 for describing the spectral energy distribution in the 0.1-106 eV band, a high energy cut-off at Ec=100 keV, and a covering factor of 1. Elements abundance is set to the Solar one Asplund et al. (2009), and a turbulence velocity v 200 km s-1 is considered, based on the typical values of turbulent velocity for warm absorbers (Laha et al., 2014). By letting the ionisation parameter and the column density free to vary, keeping the redshift fixed, the fit is improved by a =55 for 2 d.o.f. less. The photon index of this new model is consistent within the errors with what previously obtained. The best-fit values of the WA are =2.10.2 and NH=(31) 1022 cm-2.
We further tested the current dataset adopting xillver (García et al., 2014; Dauser et al., 2016), a self-consistent model reproducing the continuum and ionised reflection of AGNs. In the fit, the photon index, the high energy cut-off, the reflection fraction and the normalisation are left free to vary. The iron abundance AFe is fixed to the Solar value, while the ionisation parameter is set to the lowest value allowed by the model, close to neutrality. These steps lead to the best-fit ( 174 for 172 d.o.f.) showed in Fig. 4. The photon index and the reflection parameter are and , respectively. A lower limit of Ec ¿ 170 keV is found for the high energy cut-off while the normalisation is Nxill=(5.00.5) photons kev-1 cm-2 s-1. Finally, we find that the WA parameters are still consistent within the errors with the previous fit.


3.2 XMM-Newton: The 0.3-10 keV band, analysis using a phenomenological model

Visual inspection of the XMM-Newton light curves ( see Fig. 5) shows no evidence of flux and spectral variability, hence we used the averaged spectra to improve spectral statistics. On the other hand, the comparison of the hardness ratios between the XMM-Newton Obs. 1 and Obs. 2 suggests that the source changed its spectral shape between the two XMM-Newton visits.

The soft X-rays in the XMM-Newton observations show signs of intense absorption (see Fig. 1 and Fig. 6, panel a), therefore, we modelled the source spectra using a power-law to reproduce the underlying nuclear continuum and a XSTAR table to model the absorption below 2-3 keV.
In the fit, the photon index the normalisation as well as the WA column density and ionisation are free to vary and untied between Obs. 1 and Obs. 2. The XSTAR table enhances the fit statistics by a d.o.f=2258/4 and the resulting modelling (still unacceptable in terms of statistics, =283 for 179 d.o.f.) is reported in Fig. 6, panel b. A prominent emission line (which its rest frame energy likely corresponds to the O VII transition) remains unmodelled in both pointings. We included a Gaussian line to account for it, and by fitting its energy centroid and normalisation (untied between the pointings) a corresponding =49 for 4 parameters is found. The current model provides a fit characterised by =234 for 175 degree of freedom.
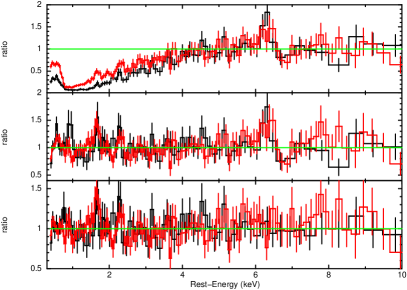
The present model allows us to focus on the iron line energy band and, in particular, on the absorption/emission features left unmodelled in the 6-9 keV energy interval (see Fig. 6, b panel). Besides the residuals at about 6.4 keV in emission, an absorption trough appears in the XMM-Newton data at the energy of 7 keV. Moreover, at higher energies, the first XMM-Newton observation shows a further absorption feature at about 8 keV. We account for these additional spectral complexities including Gaussian lines: one is used to model the Fe k emission line and an other to reproduce the absorption feature at E6.8 keV. During the fitting procedure, we assumed that the width of both Gaussian components is zero (unresolved by the instrument resolution) and we let the energy centroid and normalisation free to vary. We find the values for both the emission and absorption lines to be consistent between the two observations. For this reason, we fit these two Gaussian components tying the energy centroid and the normalisation between the two XMM-Newton exposures.
From a statistical point of view, the inclusion of the emission line accounting for the Fe K enhances the fit by = 18 for 2 d.o.f., while the absorption line at 6.8 keV leads to a fit improvement of = 11 for 2 d.o.f.. These steps yield a global statistics of =205 for 171 degrees of freedom.
Moreover, as shown by Fig. 6 panel b, a drop of counts is observed at about 8 keV in Obs. 1. We include an additional absorption line in our model to account for it. This line has a free energy centroid and normalisation while its intrinsic width is set fixed to 200 eV, which is comparable to the energy resolution of the EPIC-pn at these energies. A =8 for 2 d.o.f. indicates that this component is marginally detected.
Best-fit parameters for the primary continuum and the Gaussian emission/absorption lines are reported in Table 2.
Significant spectral variability is found between Obs. 1 and 2, and the power-law normalisation is found about to double in the second pointing. The observed 2-10 keV fluxes are and (2.3 ergs cm-2 s-1, respectively, and in the soft X-rays (0.3-2 keV) we find (3.0 and (7.4 ergs cm-2 s-1.
Within the errors, the intensity of emission line at energy 0.57 keV remains constant, and the neutral Fe K is consistent with being narrow. The Fe K equivalent width (EW) is also constant between the observations with an average value of 130 eV. The Gaussian line at 6.8 keV is likely associated with blueshifted Fe XXV, while the marginally detected component at higher energy is more likely associated with a highly blueshifted Fe XXVI.
In panel c of Fig.6 and in Fig.7 we notice the presence of further features not reproduced by the current phenomenological model, especially between 1.5-2.5 keV. Some of these features in this band may be directly attributed to the detector calibration uncertainties (e.g. Si K-edge 1.84 keV), and at the Au M-edge (2.4 keV) (see Kaastra et al., 2011; Di Gesu et al., 2015; Ursini et al., 2015; Cappi et al., 2016; Middei et al., 2018a, for discussions and comparisons). We notice that modelling these features with Gaussian lines or ignoring the spectra in the 1.5-2.5 keV band do not affect the values reported in Table 2.
| Component | Parameter | Obs. 1 | Obs. 2 |
|---|---|---|---|
| TBabs | N | 0.056 | 0.056 |
| power-law | 1.660.04 | 2.050.10 | |
| Norm (10-3) | 0.640.1 | 1.40.2 | |
| WA | 2.000.04 | 1.750.15 | |
| 7.90.9 | 5.40.4 | ||
| 0.096 | |||
| /d.o.f. | 642/2 | 1616/2 | |
| zgauss (Emi) | E (keV) | 0.560.02 | 0.590.02 |
| 0.096 | - | ||
| Norm () | 1.40.4 | 2.61.0 | |
| EW (eV) | 7030 | 4525 | |
| /d.o.f. | 18/2 | 31/2 | |
| zgauss (Emi) | E (keV) | 6.300.8 | |
| 0.096 | |||
| Norm (10-6) | 5.02.0 | ||
| EW (eV) | 13090 | 12580 | |
| /d.o.f. | 18/2 | ||
| zgauss (Abs) | E (keV) | 6.800.07 | |
| 0.096 | |||
| Norm (10-6) | -3.51.2 | ||
| EW (eV) | -10050 | -10050 | |
| /d.o.f. | 11/2 | ||
| zgauss (Abs) | E (keV) | 8.20.2 | |
| (eV) | 200 | - | |
| 0.096 | - | ||
| Norm () | -5.43.1 | - | |
| EW (eV) | -220120 | - | |
| /d.o.f. | 8/2 |
3.3 XMM-Newton: The 0.3-10 keV band, analysis using a physical model
As a subsequent step we reanalysed the EPIC-pn spectra using a self-consistent emission model (xillver). Such a model simultaneously fits the source emission and its associated ionised reflection component. Moreover, we accounted for the absorption troughs in the 6.5-8.5 keV energy band including two XSTAR tables. One, Abs1, is used to reproduce the absorption at E6.8 keV, while, the other, Abs2 is included to model the absorption at 8 keV.
The fit was performed allowing the photon index, the reflection fraction and the normalisation to vary also between the two pointings. The high energy cut-off is kept frozen to =100 keV, while the ionisation parameter is free to vary but tied between Obs. 1 and Obs. 2. Concerning the ionised absorbers, we fit the ionisation parameter and column density in both the observations. The table accounting for the drop at 6.8 keV was fitted tying its parameters between the two XMM-Newton observations, while the grid accounting for Abs2 was only included in Obs. 1. Finally, we considered the redshift of all the tables (zobs) as being a free parameter in order to constrain the possible velocity shift.
The steps just described lead to the best-fit in Fig. 9. The fit has a statistics of =170 for 168 d.o.f. and the corresponding best-fit values of the various parameters are reported in Table 3. As already shown by the phenomenological model, spectral variability characterises the primary continuum of 1E 0754.6+392.8. The nuclear emission normalisation increases by a factor 1.25 between the two XMM-Newton visits, while the reflection fraction is found to be 1 and constant within the uncertainties. The WA component varies both in column density and ionisation in the range 3 N and 1.52.1, respectively. These values, though slightly smaller, are consistent within the errors with those of the phenomenological model. Higher ionisations states and column densities characterise both Abs1 and Abs2. The physical parameters of these two components are marginally constrained by the current dataset and in Fig. 8 we show the confidence regions for the vs NH parameters. Using the redshift best-fit values, we can only found an upper limit of v1500 km s-1 for the WA.
Abs1 is consistent with being in outflow with a velocity vout in the range 4400-6200 km s-1, while a vout=(0.230.02) ( being the speed of light) is estimated for the possible Abs2 component.
These physical quantities for various absorbers in 1E 0754.6+392.8 are compatible with what is found by other authors (e.g. Tombesi et al., 2010, 2013) with the exception of the WA column density that appears to be larger than typical values, but it could be related to a more equatorial inclination of this AGN (see also Krolik & Kriss, 2001; Behar et al., 2017).
| Model | Parameter | Obs. 1 | Obs. 2 |
|---|---|---|---|
| TBabs | N | 0.056 | 0.056 |
| xillver | 1.660.04 | 2.070.06 | |
| 1.3 | |||
| R | 1.00.5 | 1.00.4 | |
| Norm (10-5) | 1.50.2 | 2.00.1 | |
| WA | 2.000.05 | 1.500.07 | |
| NH (1022 cm-2) | 7.01.0 | 4.00.5 | |
| vout/ | ¡0.005 | ¡0.004 | |
| vout (km s-1) | ¡1500 | ¡1100 | |
| 482/3 | 1171/3 | ||
| Abs1 | 3.40.1 | ||
| NH (1023 cm-2) | 2.6 | ||
| vout/ | 0.0170.04 | ||
| vout (km s-1) | 5300900 | ||
| 23/3 | |||
| Abs2 | 3.40.3 | - | |
| NH (1023 cm-2) | 1.3 | - | |
| vout/ | 0.230.02 | - | |
| vout (km s-1) | 7400010000 | ||
| 14/3 | - |


3.4 Comparison between XMM-Newton and Swift/NuSTAR data

The current dataset covers a 8 years long time interval, thus it is suitable for variability studies. As showed in Fig. 1, the spectra of 1E 0754.6+392.8 varied both in shape and amplitude. The observed flux in the 0.5-2 keV band exhibits a change between the XMM-Newton exposures and in the subsequent Swift-NuSTAR pointing in which it increased by a factor larger than 10. On the other hand, the observed 3-10 keV flux is fairly consistent with F10-12 erg cm-2 s-1 in Obs. 1 and Obs. 2, while the source doubled the flux in the same band during the Swift-NuSTAR observation. It is worth noting that the reflection fraction is higher when the 3-10 keV flux is lower, suggesting a constant reflected emission.
Intense absorption in the soft X-rays is the major component that shapes the source spectrum.
The WA varies in ionisation and column density. For the physical parameters of this component and using the self-consistent models in Sect. 3.1 and 3.3 we computed the confidence regions showed in Fig. 10. These contour plots have been calculated by assuming the redshift of the XSTAR tables fixed at its best-fit value. In Fig. 10, the low statistics of the XRT data and the FPMA&B bandpass explain the poor constraints on the WA in the 2014 observation.
Moreover, we tested Swift-NuSTAR data for the presence of absorption lines. We started with the phenomenological model presented in Sect. 3.1 to which we have added Gaussian components in absorption: a narrow line with an energy centroid of 6.8 keV; a 200 eV width absorption line centered at 8.2 keV. The fit to the data does not require a Gaussian component at 6.8 keV. On the other hand, the other line provides a weak improvement of the fit (/d.o.f.=6/2) and the absorption line is characterised by E=8.90.3 keV, N=(6.24.0)10-6 photons cm-2 s-1 EW=-10060 eV. However, the statistics of the available Swift-NuSTAR exposure is not suitable for adequately searching for faint absorption features.
4 Statistical significance of the absorption features
In order to assess the statistical significance of the two absorption features at 6.8 and 8 keV, we performed Monte Carlo simulations. These simulations are particularly suitable for quantifying the correct significance of any absorption/emission component detected with a blind search over a certain energy interval (e.g. Porquet et al., 2004; Miniutti & Fabian, 2006; Markowitz et al., 2006; Tombesi et al., 2010; Gofford et al., 2013; Tombesi & Cappi, 2014; Marinucci et al., 2018; Smith et al., 2019).
Therefore, we used the fakeit command in XSPEC to generate a set of 1000 synthetic spectra for each of the two exposures. To simulate these fake spectra, we used the background and response files of the real data and the same exposure time of the observations. The underlying model considered for the simulations is the one presented in Sect. 3.2 but without the emission and absorption lines. Finally, the simulated data were binned in the same way as those observed. After that, we add a new narrow (or with a width of 200 eV, for the candidate UFO) Gaussian line whose normalisation was initially set to zero and free to vary in the range between -1 and +1. The energy centroid was free to vary between 6.5 and 9 keV for both the features, in order to sample the searched energy interval. We used the steppar command in XSPEC to map the using 100 eV steps, and the resulting variation where recorded.
Defining N as the number of simulations in which a chance improvement of the is found to be equal or larger than the one on the real data and S being the total number of simulated spectra, we estimated the Monte Carlo statistical significance of the detections to be 1-N/S. Following this definition, we obtained N=16 with S=1000 for the absorption line at 6.8 keV. Hence the significance of this feature in accordance with the simulations is 98.4%, this corresponding to a 2.4 detection. For the candidate UFO at E8 keV, we find N=39 which corresponds to a significance of 96.1% i.e. 2.06. We note that the Monte Carlo statistical significance of these features is higher than the threshold of 95% typically used in extensive searches of Fe K features (e.g. Tombesi et al., 2010, 2014; Gofford et al., 2013).
5 Conclusions and summary
We reported on the first X-ray broadband (0.3-79 keV) spectroscopic analysis of the NLSy1 galaxy 1E 0754.6+392.8 based on two 2006 XMM-Newton observations (taken 6 months apart) and on a NuSTAR-Swift simultaneous snapshot performed in 2014. The spectra of 1E 0754.6+392.8 are well described by a variable power-law spectrum with a photon index between 1.65 and 2.07. This spectral variability is observed from months to years, while down to hours the source exhibits a constant behaviour as suggested by the hardness ratios in Fig. 2 and Fig. 5). Long term flux variations mainly affect the soft X-rays (0.3-2 keV), whose flux doubles in six months and increases more than a factor 10 in 8 years . On the other hand, the continuum emission at higher energies is less affected by variations on monthly timescales, but, over the years, the observed 2-10 keV flux increased by a factor 2.5.
Two significant emission lines are detected at 6.4 keV and 0.57 keV, respectively. The former is interpreted as fluorescent emission of K-shell iron in a low-ionisation state. Its width is unresolved in both the observations (upper limits ¡0.19 keV), and this may rule out an origin in the inner parts of the accretion disc. Furthermore, such emission feature has a constant equivalent width and normalisation. The reflected flux is consistent with being constant over the years and it is likely originating in distant material. The other feature in emission observed at about 0.57 keV may result from He -like oxygen triplet emission arising from the same low-ionisation state plasma responsible for the iron K emission line. However, such line may also be produced in a much farther region from the SMBH (e.g. the Narrow Line Region) and it is more easily detected due to the presence of the WA itself (Piconcelli et al., 2004).
The main spectral feature in the spectrum is an intense absorption affecting the soft X-ray band. In particular, data show a variable WA that is persistent over the years. This component is consistent with being at the same redshift of the source and at pc scales with respect to the central SMBH. The physical quantities derived for the WA are shown in Fig. 10 for the different observations. The change in column density and/or ionisation state of this component can be the result of a clumpy or filamentary inhomogeneous absorber (e.g. Gaspari & S\kadowski, 2017; Serafinelli et al., 2019).
The iron line energy band shows further signatures of absorption likely due to highly ionised and high column density matter crossing our line of sight. Though, these components have only a low significance (98% for Fe XXV and 96% for Fe XXVI assessed using Monte-Carlo simulations). The Fe K absorber Abs1 is observed in both XMM-Newton observations and is consistent with a Fe XXV. Abs2, a candidate UFO, is characterised by a mildly outflowing velocity (vout=(0.230.03)) and its ionisation and column density are compatible with what often observed for UFOs (Tombesi et al., 2011; Parker et al., 2017; Reeves et al., 2018; Parker et al., 2018; Braito et al., 2018; Serafinelli et al., 2019; Matzeu et al., 2019).
The presence/absence of the Abs2 component in the analysed data is consistent with SMBH winds being variable as it has been repeatedly confirmed through ensemble studies or single object analyses. For instance, Tombesi et al. (2010) reported on the variability of such winds using a sample of Seyfert galaxies and found a detection rate of the order of 5020% for these components (see also Tombesi et al., 2011; Gofford et al., 2013).
It is worth noticing that the various types of absorbers can be part of a single large-scale multiphase outflow seen at different distances from the SMBH (e.g. Tombesi et al., 2013). The properties of the WAs, the UFOs and the highly ionised non-UFO absorbers (like as our Abs1) have been found to show significant trends: the closer the absorber is to the central BH, the higher the ionisation, column, outflow velocity. Within this context, the possible simultaneous presence of three different types of absorbers suggests 1E 0754.6+392.8 to be a fantastic laboratory in which to study the relations between the different absorbing phases. In fact, though being rarely observed so far, the presence of multiple phases allows unprecedented insights on the outflows structure and physics (e.g. Serafinelli et al., 2019).
In conclusion, the current data, despite the low S/N, suggest that 1E 0754.6+392.8, clearly hosting a variable WA, may have further absorbing phases characterised by much higher outflow velocities. Only longer exposures or the higher sensitivity of an X-ray calorimeter (e.g. XRISM and Athena) will allow us to put firmer conclusions on the putative multiphase outflows possibly present on this source and to better assess for the presence of its accretion disc wind component.
Acknowledgements.
We thank the referee for her/his suggestions which improved the manuscript. RM thanks Valentina Braito and James Reeves for useful discussions and comments. RM acknowledges support from the Faculty of the European Space Astronomy Centre (ESAC), Fondazione Angelo Della Riccia for financial support and Université Grenoble Alpes and the high energy SHERPAS group for welcoming him at IPAG. FT acknowledges support by the Programma per Giovani Ricercatori - anno 2014 “Rita Levi Montalcini”. Part of this work is based on archival data, software or online services provided by the Space Science Data Center - ASI. SB and AZ acknowledge financial support from ASI under grants ASI-INAF I/037/12/0 and n. 2017-14-H.O. RS acknowledges financial contribution from the agreement ASI-INAF n.2017-14-H.0. POP thanks financial support by the french CNES agency. GAM is supported by European Space Agency (ESA) Research Fellowships. This work is based on observations obtained with: the NuSTAR mission, a project led by the California Institute of Technology, managed by the Jet Propulsion Laboratory and funded by NASA; XMM-Newton, an ESA science mission with instruments and contributions directly funded by ESA Member States and the USA (NASA).References
- Asplund et al. (2009) Asplund, M., Grevesse, N., Sauval, A. J., & Scott, P. 2009, ARA&A, 47, 481
- Behar et al. (2017) Behar, E., Peretz, U., Kriss, G. A., et al. 2017, A&A, 601, A17
- Berton et al. (2015) Berton, M., Foschini, L., Ciroi, S., et al. 2015, A&A, 578, A28
- Bianchi et al. (2009) Bianchi, S., Guainazzi, M., Matt, G., Fonseca Bonilla, N., & Ponti, G. 2009, A&A, 495, 421
- Blustin et al. (2005) Blustin, A. J., Page, M. J., Fuerst, S. V., Branduardi-Raymont, G., & Ashton, C. E. 2005, A&A, 431, 111
- Braito et al. (2018) Braito, V., Reeves, J. N., Matzeu, G. A., et al. 2018, MNRAS, 479, 3592
- Cappi et al. (2016) Cappi, M., De Marco, B., Ponti, G., et al. 2016, A&A, 592, A27
- Dauser et al. (2016) Dauser, T., García, J., Walton, D. J., et al. 2016, A&A, 590, A76
- Di Gesu et al. (2015) Di Gesu, L., Costantini, E., Ebrero, J., et al. 2015, A&A, 579, A42
- Enya et al. (2002) Enya, K., Yoshii, Y., Kobayashi, Y., et al. 2002, ApJS, 141, 45
- Event Horizon Telescope Collaboration et al. (2019) Event Horizon Telescope Collaboration, Akiyama, K., Alberdi, A., et al. 2019, ApJ, 875, L5
- Fabian et al. (2017) Fabian, A. C., Lohfink, A., Belmont, R., Malzac, J., & Coppi, P. 2017, MNRAS, 467, 2566
- Fabian et al. (2015) Fabian, A. C., Lohfink, A., Kara, E., et al. 2015, MNRAS, 451, 4375
- Faucher-Giguère & Quataert (2012) Faucher-Giguère, C.-A. & Quataert, E. 2012, MNRAS, 425, 605
- Feruglio et al. (2015) Feruglio, C., Fiore, F., Carniani, S., et al. 2015, A&A, 583, A99
- Fiore et al. (2017) Fiore, F., Feruglio, C., Shankar, F., et al. 2017, A&A, 601, A143
- García et al. (2014) García, J., Dauser, T., Lohfink, A., et al. 2014, ApJ, 782, 76
- Gaspari & S\kadowski (2017) Gaspari, M. & S\kadowski, A. 2017, ApJ, 837, 149
- George & Fabian (1991) George, I. M. & Fabian, A. C. 1991, MNRAS, 249, 352
- Giacconi et al. (1979) Giacconi, R., Branduardi, G., Briel, U., et al. 1979, ApJ, 230, 540
- Gioia et al. (1990) Gioia, I. M., Maccacaro, T., Schild, R. E., et al. 1990, ApJS, 72, 567
- Gofford et al. (2013) Gofford, J., Reeves, J. N., Tombesi, F., et al. 2013, MNRAS, 430, 60
- Guainazzi et al. (1999) Guainazzi, M., Matt, G., Molendi, S., et al. 1999, A&A, 341, L27
- Haardt & Maraschi (1991) Haardt, F. & Maraschi, L. 1991, ApJ, 380, L51
- Haardt & Maraschi (1993) Haardt, F. & Maraschi, L. 1993, ApJ, 413, 507
- Halpern (1984) Halpern, J. P. 1984, ApJ, 281, 90
- Harrison et al. (2013) Harrison, F. A., Craig, W. W., Christensen, F. E., et al. 2013, ApJ, 770, 103
- HI4PI Collaboration et al. (2016) HI4PI Collaboration, Ben Bekhti, N., Flöer, L., et al. 2016, A&A, 594, A116
- Jansen et al. (2001) Jansen, F., Lumb, D., Altieri, B., et al. 2001, A&A, 365, L1
- Kaastra et al. (2011) Kaastra, J. S., Petrucci, P.-O., Cappi, M., et al. 2011, A&A, 534, A36
- Kallman & Bautista (2001) Kallman, T. & Bautista, M. 2001, ApJS, 133, 221
- Krolik & Kriss (2001) Krolik, J. H. & Kriss, G. A. 2001, The Astrophysical Journal, 561, 684
- Laha et al. (2016) Laha, S., Guainazzi, M., Chakravorty, S., Dewangan, G. C., & Kembhavi, A. K. 2016, MNRAS, 457, 3896
- Laha et al. (2014) Laha, S., Guainazzi, M., Dewangan, G. C., Chakravorty, S., & Kembhavi, A. K. 2014, MNRAS, 441, 2613
- Lansbury et al. (2017) Lansbury, G. B., Alexander, D. M., Aird, J., et al. 2017, ApJ, 846, 20
- Longinotti et al. (2010) Longinotti, A. L., Costantini, E., Petrucci, P. O., et al. 2010, A&A, 510, A92
- Mao et al. (2019) Mao, J., Mehdipour, M., Kaastra, J. S., et al. 2019, A&A, 621, A99
- Marinucci et al. (2018) Marinucci, A., Bianchi, S., Braito, V., et al. 2018, MNRAS, 478, 5638
- Markowitz et al. (2006) Markowitz, A., Reeves, J. N., & Braito, V. 2006, ApJ, 646, 783
- Matt et al. (1991) Matt, G., Perola, G. C., & Piro, L. 1991, A&A, 247, 25
- Matzeu et al. (2019) Matzeu, G. A., Braito, V., Reeves, J. N., et al. 2019, MNRAS, 483, 2836
- Matzeu et al. (2017) Matzeu, G. A., Reeves, J. N., Braito, V., et al. 2017, MNRAS, 472, L15
- Middei et al. (2018a) Middei, R., Bianchi, S., Cappi, M., et al. 2018a, A&A, 615, A163
- Middei et al. (2018b) Middei, R., Vagnetti, F., Tombesi, F., et al. 2018b, A&A, 618, A167
- Miniutti & Fabian (2006) Miniutti, G. & Fabian, A. C. 2006, MNRAS, 366, 115
- Parker et al. (2018) Parker, M. L., Matzeu, G. A., Guainazzi, M., et al. 2018, MNRAS, 480, 2365
- Parker et al. (2017) Parker, M. L., Pinto, C., Fabian, A. C., et al. 2017, Nature, 543, 83
- Piconcelli et al. (2004) Piconcelli, E., Jimenez-Bailón, E., Guainazzi, M., et al. 2004, MNRAS, 351, 161
- Piconcelli et al. (2005) Piconcelli, E., Jimenez-Bailón, E., Guainazzi, M., et al. 2005, A&A, 432, 15
- Pinto et al. (2018) Pinto, C., Alston, W., Parker, M. L., et al. 2018, MNRAS, 476, 1021
- Porquet et al. (2004) Porquet, D., Reeves, J. N., Uttley, P., & Turner, T. J. 2004, A&A, 427, 101
- Reeves et al. (2018) Reeves, J. N., Braito, V., Nardini, E., et al. 2018, ApJ, 854, L8
- Reynolds (1997) Reynolds, C. S. 1997, MNRAS, 286, 513
- Rybicki & Lightman (1979) Rybicki, G. B. & Lightman, A. P. 1979, Radiative processes in astrophysics
- Serafinelli et al. (2019) Serafinelli, R., Tombesi, F., Vagnetti, F., et al. 2019, A&A, 627, A121
- Sergeev et al. (2007) Sergeev, S. G., Klimanov, S. A., Chesnok, N. G., & Pronik, V. I. 2007, Astronomy Letters, 33, 429
- Smith et al. (2019) Smith, R. N., Tombesi, F., Veilleux, S., Lohfink, A. M., & Luminari, A. 2019, arXiv e-prints, arXiv:1910.14583
- Tombesi & Cappi (2014) Tombesi, F. & Cappi, M. 2014, MNRAS, 443, L104
- Tombesi et al. (2012) Tombesi, F., Cappi, M., Reeves, J. N., & Braito, V. 2012, MNRAS, 422, L1
- Tombesi et al. (2013) Tombesi, F., Cappi, M., Reeves, J. N., et al. 2013, MNRAS, 430, 1102
- Tombesi et al. (2011) Tombesi, F., Cappi, M., Reeves, J. N., et al. 2011, ApJ, 742, 44
- Tombesi et al. (2010) Tombesi, F., Cappi, M., Reeves, J. N., et al. 2010, A&A, 521, A57
- Tombesi et al. (2015) Tombesi, F., Meléndez, M., Veilleux, S., et al. 2015, Nature, 519, 436
- Tombesi et al. (2014) Tombesi, F., Tazaki, F., Mushotzky, R. F., et al. 2014, MNRAS, 443, 2154
- Tombesi et al. (2017) Tombesi, F., Veilleux, S., Meléndez, M., et al. 2017, ApJ, 850, 151
- Tortosa et al. (2018) Tortosa, A., Bianchi, S., Marinucci, A., Matt, G., & Petrucci, P. O. 2018, A&A, 614, A37
- Ursini et al. (2015) Ursini, F., Boissay, R., Petrucci, P.-O., et al. 2015, A&A, 577, A38
- Veilleux et al. (2017) Veilleux, S., Bolatto, A., Tombesi, F., et al. 2017, ApJ, 843, 18
- Zubovas & King (2012) Zubovas, K. & King, A. 2012, ApJ, 745, L34