2INAF - Osservatorio Astrofisico di Arcetri, Largo Enrico Fermi 5, 50125 Firenze, Italy
3Instituto de Astrofísica e Ciências do Espaço, Universidade do Porto, CAUP, Rua das Estrelas, PT4150-762 Porto, Portugal
4GRANTECAN, Cuesta de San José s/n, E-38712 , Breña Baja, La Palma, Spain
5Instituto de Astrofísica de Canarias, Vía Láctea s/n, E-38200 La Laguna, Tenerife, Spain
6Instituto de Astronomía, Universidad Nacional Autonoma de México, Apdo. Postal 70264, 04510, México D.F., México
7Departamento de Física de la Tierra y Astrofísica, Facultad de CC. Físicas, Universidad Complutense de Madrid, E-28040 Madrid, Spain
8Instituto de Física de Cantabria, CSIC-UC, 39005 Santander, Spain
11email: villarmm@cab.inta-csic.es
The peculiar emission line spectra of core-Extremely Red BOSS Quasars at 2-3: orientation and/or evolution?
Abstract
Context. Core-extremely red quasars (core-ERQ) have been proposed to represent an intermediate evolutionary phase in which a heavily obscured quasar is blowing out the circumnuclear interstellar medium with very energetic outflows prior to becoming an optical quasar.
Aims. In this work, we investigate whether the properties of core-ERQ fit in the AGN orientation-based unification scenario.
Methods. We revise the UV and optical emission line properties of core-ERQ in the context of the orientation based scenario. We use diagnostic diagrams based on UV emission line ratios and UV-optical line kinematic information to compare the physical and kinematic gas properties of core-ERQ with those of other luminous narrow and broad line AGN. In particular, we provide a revised comparison of the [OIII] kinematics in 21 core-ERQ (20 from Perrotta et al. 2019 and SDSS J171420.38+414815.7, based on GTC EMIR near infrared spectroscopy) with other samples of quasars matched in luminosity with the aim of evaluating whether core-ERQ host the most extreme [OIII] outflows.
Results. The UV line ratios suggest that the physical properties (for instance, density, metallicity) of the ionised gas in core-ERQ are similar to those observed in the BLR of blue Nitrogen-loud QSOs. The [OIII] outflow velocities of core-ERQ are, on average, consistent with those of very luminous blue QSO1, although extreme outflows are much more frequent in core-ERQ. These similarities can be explained in the context of the AGN unification model, assuming that core-ERQ are viewed with an intermediate orientation between type 2 (edge-on) and type 1 (face-on) QSOs.
Conclusions. We propose that core-ERQ are very luminous but otherwise normal quasars viewed at an intermediate orientation. Such orientation allows a direct view of the outer part of the large BLR, from which core-ERQ UV emission originates; the extreme [OIII] outflow velocities are instead a consequence of the very high luminosity of core-ERQ.
Key Words.:
galaxies – quasars – kinematics – outflows1 Introduction
Ross et al. Ross2015 2015 discovered a population of extremely red quasars (ERQ) in Data Release 10 (DR10) of the Baryon Oscillation Sky Survey (BOSS; Ross et al. 2012, Dawson et al. 2013) in the Sloan Digital Sky Survey-III (SDSS-III; Eisenstein et al. 2011). They show very red colours (SDSS band to WISE band) similar to dust obscured galaxies (DOG). The authors identified 65 ERQ which span a redshift range of 0.284.36 with a bimodal distribution, with peaks at 0.8 and 2.5. Most objects are type 2 quasars (QSO2) or heavily reddened type 1 quasars (QSO1), but there is a subsample of 12 objects presenting very peculiar emission line to continuum properties which defy standard explanations based on extinction and/or orientation. This subclass, which was later named core-ERQ by Hamann et al. (2017, H17 hereafter), is the topic of this paper.
H17 enlarged the core-ERQ catalogue to 97 objects by defining a less stringent colour condition. These have nearly uniform peculiar properties selected via 4.6 (AB system) and rest frame equivalent width of CIV1550 (CIV hereafter), REW100 Å, at redshifts 2.0-3.4.
Core-ERQ have very high bolometric luminosities (median log47.10.3; see H17 and Ross2015 2015 for a detailed characterisation and investigation of core-ERQ properties). They show unexpectedly flat UV spectra given their red UV-to-mid-IR colours and large line REW: 50% core-ERQ have REW150 Å, vs. 1% in normal blue type 1 quasars matched in or magnitude. They show signs of strong absorption in the X-rays with inferred column densities of 1023 cm-2 (Goulding et al., 2018).
Core-ERQ have peculiar, wingless rest-frame UV emission line profiles, with full width at half maximum (FWHM) values between between those found for very luminous type 1 and type 2 active galactic nuclei (AGN) at similar . Their median FWHMCIV=3050990 km s-1 is narrower than FWHMCIV=5836 1576 km s-1 for blue quasars matched in (H17 ), but significantly broader than FWHM2000 km s-1 of QSO2 (Alexandroff et al., 2013) and narrow line radio galaxies (NLRG, de Breuck et al. 2000) at similar . Large blueshifts in excess of 2500 km s-1 in CIV and other high-ionization UV lines compared to the HI Balmer and low-ionization permitted lines in the UV are also reported, which have been interpreted in terms of outflows (H17, ). CIV blueshifts are common in normal QSO1 (e.g. Gaskell 1982, Sulentic et al. 2007, Runnoe et al. 2014, Vietri et al. 2018). They have been widely interpreted within the context of accretion disk-wind models (e.g. Richards et al. 2011)
Even more striking are the kinematic properties of the forbidden [OIII]4959,5007 lines ([OIII] hereafter) revealed by near infrared spectroscopy. (Zakamska et al. 2016 (Z16 hereafter), Perrotta et al. 2019). Core-ERQ exhibit extremely broad and blueshifted [O III] emission, with widths () ranging between 2053 and 7227 km s-1, and maximum outflow speeds () up to 6702 km s-1. According to the authors, at least 3-5 per cent of their bolometric luminosity is being converted into the kinetic power of the observed winds, thus having the potential of affecting the entire host galaxy.
Core-ERQ also show peculiar line ratios. For instance, Ly is often very strongly absorbed, sometimes almost completely, resulting in very low line intensities relative to other lines such as CIV or NV1240 (hereafter, NV). They are also characterised by a high NV/CIV ratio (often 1.5) and an intermediate [OIII]/H1–4 ratio (Perrotta et al. 2019)111These values are derived using the total line fluxes, without any differentiation between NLR and BLR. between type 1 and type 2 luminous AGN.
Disentangling the various explanations for these puzzling core-ERQ spectral features in its own right is of great interest. Moreover, these systems might also be very relevant to studies of galaxy formation and evolution. They have been proposed to be near- or super-Eddington accreting obscured quasars, hosts of some of the most massive black holes (BH) at 3, capable of triggering strong galactic outflows that inhibit star formation in the early universe. They may represent an intermediate phase in which a heavily obscured quasar is blowing out the circumnuclear interstellar medium (ISM) with very energetic outflows prior to becoming an optical quasar (Z16 , H17 , Goulding et al. 2018, Perrotta et al. 2019).
In the unified model of AGN (e.g., Antonucci 1993; Urry & Padovani 1995), the orientation with respect to the observer of a dusty, obscuring central structure (torus or other) located within the BH gravitational radius of influence can explain certain differences found between an obscured and an unobscured quasar. Such obscuring structure would block the view along some lines of sight towards the accretion disk and the clouds within the broad line region (BLR), so that these become partly or totally hidden. Independently of the specific properties of the blocking structure and the role of other factors that can influence the diversity of quasar properties, it is clear that orientation is key to explain certain differences (e.g., Alonso Herrero et al. 2011; Ramos Almeida et al. 2011; Elitzur 2012; Mateos et al. 2016). We investigate in this paper the role played by orientation, extinction and the extreme luminosities of the core-ERQ on their observed emission lines and continuum spectral properties and the possible implications on the evolutive scenario.
We adopt H0 = 71 km s-1 Mpc-1, = 0.73, and = 0.27.
2 Sample
| J0834+0159 | ||||||
|---|---|---|---|---|---|---|
| CIV/CIII] | CIV/HeII | CIII]/HeII | NV/CIV | NV/HeII | NIII]/CIII] | NIV]/CIV |
| 1.70.3 | 4.6 | 2.3 | 1.10.4 | 3.3 | 0.51 | 0.25 |
| Ly/HeII | Ly/CIV | (SiIV+OIV])/CIV | CII/CIV | OIII]1663/CIV | [OIII]/H | |
| 23 | 5.00.2 | 0.350.06 | 0.14 | 0.24 | 2.2 | |
| J1232+0912 | ||||||
| CIV/CIII] | CIV/HeII | CIII]/HeII | NV/CIV | NV/HeII | NIII]/CIII] | NIV]/CIV |
| 5.00.8 | 6.9 | 1.2 | 1.70.1 | 11.7 | 0.80 | 0.14 |
| Ly/HeII | Ly/CIV | (SiIIV+OIV])/CIV | CII/CIV | OIII]1663/CIV | [OIII]/H | |
| 6.3 | 0.860.08 | 0.590.07 | 0.130.03 | 0.13 | 2.8 | |
| J2215-0056 | ||||||
| CIV/CIII] | CIV/HeII | CIII]/HeII | NV/CIV | NV/HeII | NIII]/CIII] | NIV]/CIV |
| 1.70.1 | 4.2 | 2.3 | 1.00.1 | 3.7 | 0.52 | 0.29 |
| Ly/HeII | Ly/CIV | (SiIV+OIV])/CIV | CII/CIV | OIII]1663/CIV | [OIII]/H | |
| 8.6 | 2.10.3 | 0.310.09 | 0.29 | 0.25 | 2.2 | |
| J2323-0100 | ||||||
| CIV/CIII] | CIV/HeII | CIII]/HeII | NV/CIV | NV/HeII | NIII]/CIII] | NIV]/CIV |
| 4.70.8 | 5.3 | 1.0 | 1.90.2 | 9.8 | 1.1 | 0.18 |
| Ly/HeII | Ly/CIV | (SiIV+OIV])/CIV | CII/CIV | OIII]1663/CIV | [OIII]/H | |
| 2.4 | 0.430.07 | 0.540.06 | 0.090.02 | 0.18 | 2.1 | |
| J1714+4148 | ||||||
| CIV/CIII] | CIV/HeII | CIII]/HeII | NV/CIV | NV/HeII | NIII]/CIII] | NIV]/CIV |
| 2.60.3 | 3.24 | 1.2 | 1.80.2 | 5.2 | 0.96 | 0.38 |
| Ly/HeII | Ly/CIV | (SiIV+OIV])/CIV | CII/CIV | OIII]1663/CIV | [OIII]/H | |
| 3.5 | 1.10.2 | 0.530.05 | 0.35 | 0.32 | 1.40.3 | |
| High NLRG | ||||||
| CIV/CIII] | CIV/HeII | CIII]/HeII | NV/CIV | NV/HeII | NIII]/CIII] | NIV]/CIV |
| 2.50.1 | 1.660.06 | 0.640.03 | 0.360.02 | 0.590.04 | 0.1 | 0.060.01 |
| Ly/HeII | Ly/CIV | (SiIV+OIV])/CIV | CII/CIV | OIII]1663/CIV | ||
| 10.20.4 | 6.10.2 | 0.190.01 | 0.04 | 0.090.01 | ||
| High QSO2 Group 1 | ||||||
| CIV/CIII] | CIV/HeII | CIII]/HeII | NV/CIV | NV/HeII | NIII]/CIII] | NIV]/CIV |
| 2.50.2 | 3.440.08 | 1.400.12 | 0.410.03 | 1.370.09 | N/A | 0.170.10 |
| Ly/HeII | Ly/CIV | (SiIV+OIV])/CIV | CII/CIV | OIII]1663/CIV | ||
| 18.93.5 | 5.50.9 | 0.200.02 | N/A | N/A | ||
| High QSO2 Group 2 | ||||||
| CIV/CIII] | CIV/HeII | CIII]/HeII | NV/CIV | NV/HeII | NIII]/CIII] | NIV]/CIV |
| 3.11.0 | 6.60.4 | 2.10.2 | 0.500.03 | 3.30.3 | N/A | 0.060.01 |
| Ly/HeII | Ly/CIV | (SiIV+OIV])/CIV | CII/CIV | OIII]1663/CIV | ||
| 27.62.0 | 4.20.2 | 0.180.02 | N/A | N/A | ||
| Radio Quiet QSO1 | ||||||
| CIV/CIII] | CIV/HeII | CIII]/HeII | NV/CIV | NV/HeII | NIII]/CIII] | NIV]/CIV |
| 3.00.4 | 38.019.5 | 12.86.8 | 0.460.06 | 17.58.8 | 0.0160.002 | 0.0160.003 |
| Ly/HeII | Ly/CIV | (SiIV+OIV])/CIV | CII/CIV | OIII]1663/CIV | ||
| 100.050.0 | 2.60.3 | 0.310.05 | 0.0260.011 | 0.0180.016 | ||
| Radio Loud QSO1 | ||||||
| CIV/CIII] | CIV/HeII | CIII]/HeII | NV/CIV | NV/HeII | NIII]/CIII] | NIV]/CIV |
| 3.940.06 | 43.71.8 | 11.10.5 | 0.420.01 | 18.50.9 | 0.0380.002 | 0.0540.002 |
| Ly/HeII | Ly/CIV | (SiIV+OIV])/CIV | CII/CIV | OIII]1663/CIV | ||
| 84.03.6 | 1.920.02 | 0.170.01 | 0.0070.001 | 0.0430.001 | ||
| N-loud quasars | ||||||
| CIV/CIII] | CIV/HeII | CIII]/HeII | NV/CIV | NV/HeII | NIII]/CIII] | NIV]/CIV |
| 3.6 | 7.7 | 1.9 | 0.95 | 6.1 | 0.56 | 0.08 |
| Ly/HeII | Ly/CIV | (SiIV+OIV])/CIV | CII/CIV | OIII]1663/CIV | ||
| N/A | N/A | N/A | N/A | 0.09 |
The sample studied in this paper consists of 21 core-ERQ. We focus on the 20 core-ERQ studied by Perrotta et al. (2019) (which includes the four objects studied by Z16 ), for which the authors present near infrared spectroscopy in the H-[OIII]4959,5007 region. These lines, especially the [OIII] doublet will provide essential information in our argumentation. We exclude core-ERQ-like objects (see H17 ) to have a more homogeneous sample in terms of peculiar spectral energy distributions (SED) and emission line properties. Detailed information on the sample can be found in Perrotta et al. (2019). We also include the core-ERQ SDSS J171420.38+414815.7 at 2.34 (J1714+4148 hereafter) that we observed with the 10.4m Gran Telescopio Canarias (GTC) (see Sect. 3).
2.1 Measurement of the UV line ratios
We have measured UV line ratios for the sample of core-ERQ using the BOSS optical spectra. As a guidance, we show in Table 1 the line ratios for the four core-ERQ in Z16 and for J1714+4148. The UV ratios for 16 the remaining core-ERQ are shown in Appendix A. Through the text, we will refer to the emission lines as follows: NV for NV1240, CIV for CIV1550, HeII for HeII1640, CIII] for CIII]1909, SiV+OIV] for SiV+OIV]1400.
Ly is often blended with NV (see Fig. 18 in H17 ). This effect is less severe in core-ERQ than in QSO1 because Ly is often heavily absorbed and the lines are narrower. Isolating both lines could be done clearly in 16/21 objects. A careful evaluation of the possible contamination of NV by Ly was necessary in five objects with severe blending (see, for instance, spectra of J0834+0159 and J2215-0056 in Fig. 1 of Z16 ).
To estimate this effect, we proceeded as follows. Maximum contamination might be expected for the highest possible Ly flux. This is, for no Ly absorption and maximum flux relative to NV. As a reference to estimate this, we have used the measured CIV fluxes and the typical Ly/CIV ratios observed in AGN.
A range of values Ly/CIV1-20 is measured in luminous type 2 AGN (e.g. de Breuck et al. 2000, Villar Martín et al. 2007, Alexandroff et al. 2013). The lowest values are a consequence of prominent Ly absorption. The ratio is typically Ly/CIV6 in QSO1 (Zheng et al. 1997, Lusso et al. 2018, Telfer et al. 2002).
For each object we have created artificial Ly spectral profiles for which Ly/CIV=20. The Ly FWHM and velocity offset relative to NV are set to be equal to those of the strongest emission lines (CIV, SiIV). This ”unabsorbed” Ly profile would result in a maximum possible contamination of NV. The strongest emission lines in our sample have spectral profiles reasonably well fitted with a Gaussian. Consistently, in our analysis we have assumed a Gaussian shape for the unabsorbed Ly. Given that the UV lines of each target typically show a range in their FWHM and in their redshifts , we have assumed the worst case scenario and adopted as Ly FWHM the broadest value observed among the different lines. It was found that uncertainties on the relative velocity () with respect to NV did not have a significant impact on the results.
The uncertainties of the NV flux derived from the above evaluation were 20% for four of the five objects under consideration and 30% for a fifth object. Since Ly is heavily absorbed in general and the worst case scenario has been adopted when estimating the Ly contamination, we can reasonably conclude that its impact is in general low. The errors hereafter quoted about the line ratios involving NV will include all the above mentioned uncertainties. These can therefore be qualified as the maximum errors expected.
3 J1714+4148: GTC EMIR observations, data reduction and analysis
We obtained HK-band spectroscopy of the core-ERQ J1714+4148 at 2.34 with the 10.4m Gran Telescopio Canarias (GTC) and the EMIR (Espectrógrafo Multiobjeto Infra-Rojo) instrument in long slit mode (program GTC14-19A). EMIR is a near-infrared wide field imager and medium-resolution multi-object spectrograph installed at the Naysmith-A focal station. It is equipped with a 20482048 Teledyne HAWAII-2 HgCdTe NIR-optimised chip with a pixel size of 0.2. The low resolution HK grism covers a spectral range of 1.45-2.42 m with a dispersion of 6.8 Å pixel-1. The slit width used during the observations was 1.0. The instrumental profile measured from the OH sky lines is FWHMIP=31.34.0 Å. The total exposure time on source was 3840 seconds. A typical ABBA nodding pattern was applied. The seeing during the observations was FWHM0.7.
The spectra were reduced using several python routines customised by GTC staff for EMIR spectroscopic data. The sky background was first eliminated using consecutive A-B pairs. They were subsequently flat-fielded, calibrated in wavelength and combined to obtain the final spectrum.
To correct for telluric absorption, we observed a telluric standard star with the same observing set up as the science target, right after the J1714+4148 observations and at similar airmass. To apply the correction we used a version of Xtellcor (Vacca 2003) specifically modified to account for the atmospheric conditions of La Palma observatory (Ramos Almeida et al. 2009).
Relative flux calibration was applied using the spectrum of the star, which was obtained with the same narrow 1.0 slit. The accuracy is 10%. It is not clear how different this is from the absolute flux calibration, since near infrared magnitudes are not available for the object. Based on previous experience, we estimate a maximum deviation of 30% between the relative and absolute flux calibrations. Since galactic extinction is very low (=0.06) correction for this effect was not applied.
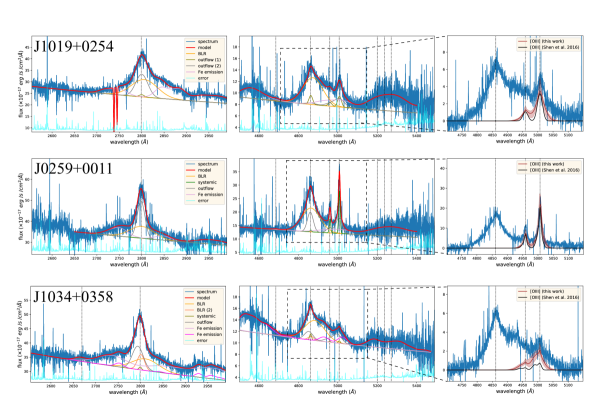
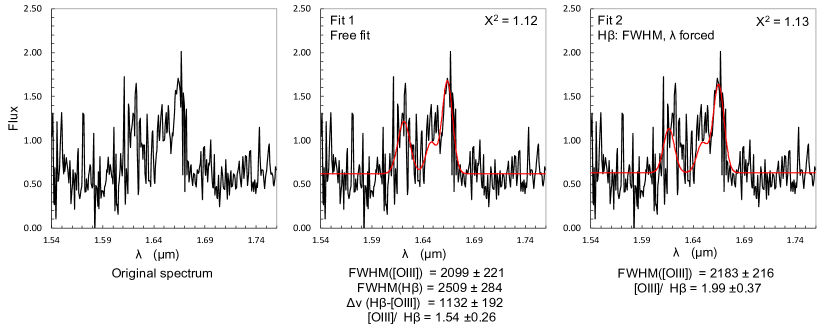
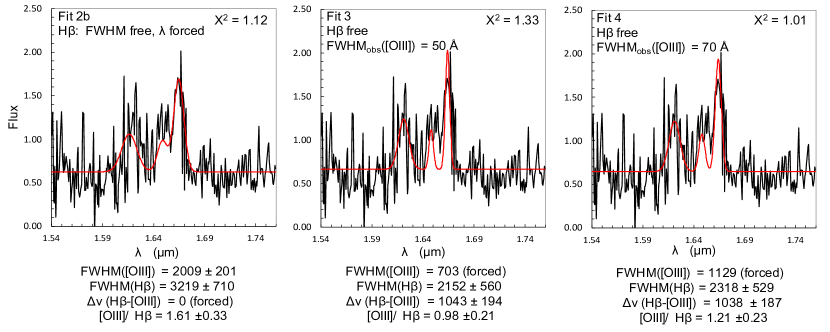
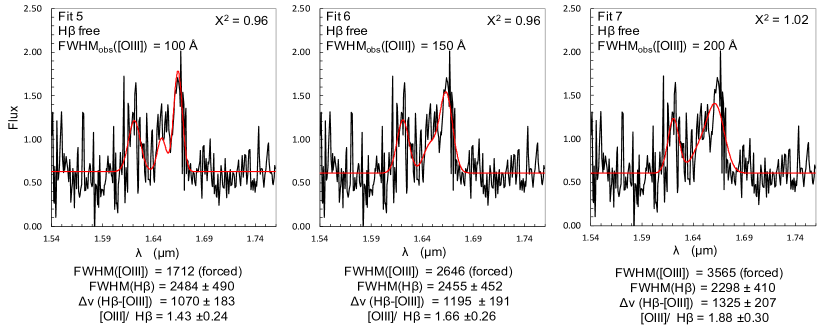
We fitted H and [OIII]4959,5007 with single Gaussian profiles to obtain an approximate quantitative characterisation of the gas kinematics. The separation in and flux ratio (3:1) for the [OIII] doublet were fixed to the theoretical values. Each line is parametrised with a central , observed FWHM and amplitude (and thus, the flux). The two [OIII] lines were forced to have the same FWHM. More complex profiles are likely to be more realistic (Perrotta et al. 2019) but this approach is not possible with our data given the low S/N ([OIII]5007 is detected with S/N6). All FWHM values in km s-1 quoted below have been corrected for instrumental broadening in quadature.
We show in Fig. 1 (first panel) the H and [OIII] spectrum and the best-fits for different sets of constraints. We attempted different fits applying a variety of kinematic constraints to determine useful ranges of the lines FWHM and the shift in velocity . Some examples are shown in Fig. 1. Each panel shows the fit with the smallest mathematical errors (minimum reduced chi-squared, ) for that specific set of constraints.
The low S/N of the spectrum prevents accurate constraints on the [OIII] and H parameters. In fact, the visual comparison between the data and the fits shows that 1 is not always associated with satisfactory results (see, for instance, fits 4 and 7).
From this analysis, we propose two tentative results: the [OIII] lines are broad, with a most probable range 1700 FWHM2300 km s-1 (100 FWHM130Å. The fits suggest that H is broader than [OIII] and is redshifted, although we cannot discard that this is an artificial result due to the noise of the H profile. Tentatively, 2000 FWHM3000 km s-1 and 9001300 km s-1. Such broad H and [OIII] lines and prominent [OIII] blueshifts are common in core-ERQ (Perrotta et al. 2019).
4 Results and discussion
4.1 Comparison of the UV emission line ratios with blue QSO1, QSO2 and high NLRG
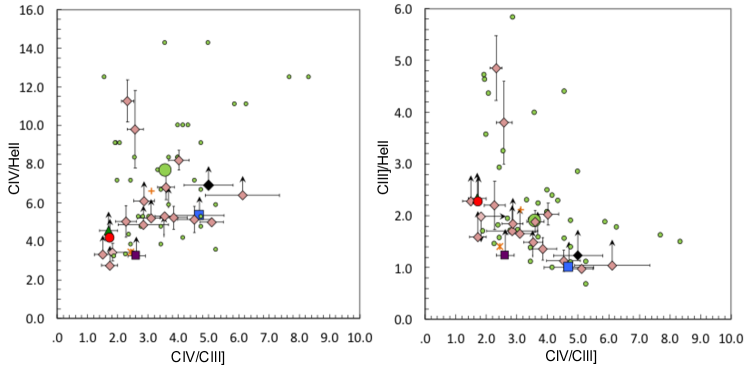
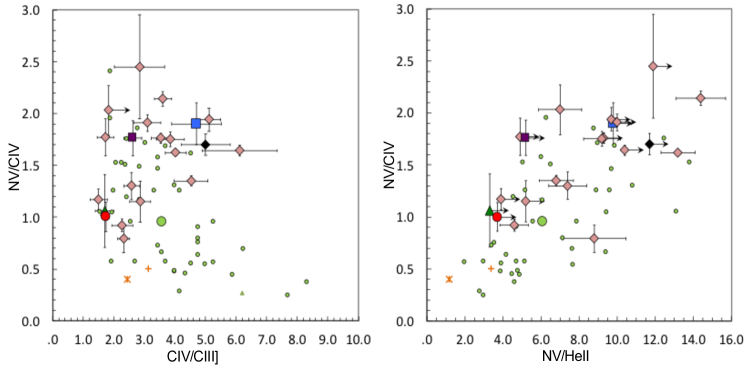
The line ratios of the four core-ERQ in Z16 and J1714+4148 are shown in Table 1 (see Appendix A for the remaining 16 objects in the sample). The UV line ratios of three composite spectra of other powerful AGN samples are also shown for comparison: NLRG, radio loud (RL) and radio quiet (RQ) QSO1 (Telfer et al. 2002). The NLRG composite (Vernet et al. 2001) was created by combining high signal to noise Keck spectra of 9 powerful radio galaxies at 2.5. The RQ and RL QSO1 composites (Telfer et al. 2002) were created by combining Hubble Space Telescope (HST) spectra of QSO1 at 0.3z3.6. Most objects (139 out of 184) are at 1.5. The RQ and RL composites include spectra of 107 and 77 objects respectively. The median line ratios of the sample of nitrogen-loud (N-loud) QSO1 from Batra & Baldwin (2014) and the median line ratios of SDSS-III BOSS QSO2 candidates at 24.3 (Alexandroff et al. 2018, Silva et al. 2020) are also shown. The location of the 21 core-ERQ in several diagnostic diagrams involving relevant UV lines is shown in Fig. 2.
4.1.1 Comparison with luminous type 2 AGN
The comparison with NLRG is interesting because these are obscured AGN with quasar like luminosities (Vernet et al. 2001). The BLR is hidden and the emission line spectrum originates in the NLR. As shown by Humphrey et al. (2008), the UV and optical emission line ratios of high NLRG are best explained by AGN photoionization of low density gas (1000 cm-3).
The line ratios of the core-ERQ are inconsistent with NLRG (Table 1, see also Silva et al. 2020). NLRG show much stronger HeII relative to other lines and fainter NV. Typically, CIV/HeII2, CIII]/HeII1, NV/CIV1 and NV/HeII1 in NLRG (Villar Martín et al. vm97 1997, de Breuck et al. 2000, Humphrey et al. 2008; see also Table 1). As can be seen in Fig. 2, in general, core-ERQ show CIV/HeII3, CIII]/HeII1, NV/CIV1 and NV/HeII3. Star forming galaxies also show relatively weak HeII, with high CIV/HeII and CIII]/HeII similar to core-ERQ. However, stellar photoionization can be discarded with confidence as a relevant excitation mechanism of the gas on the basis of the huge EW of the emission lines and the strength of NV (e.g. Feltre, Charlot & Gulkin 2016, Nakajima et al. 2018).
Alexandroff et al. (2013) identified a sample of 145 QSO2 candidates at 24.3 selected from the quasar sample of the SDSS-III BOSS. They have weak rest-frame UV continuum (typical continuum magnitude of 22) and strong CIV and Ly, with FWHM2000 km s-1. Silva et al. (2020) have recently studied the physical properties and abundances of the ionized gas in these systems based on their location in rest-frame UV diagnostic diagrams and on the comparison with AGN photoionization model predictions. Compared to NLRG at similar redshifts, the QSO2 are offset to higher NV/HeII, CIV/HeII and CIII]/HeII.
Silva et al. (2020) have classified the QSO2 in two groups: objects with ‘normal’ CIV/HeII ratios of 4 (Group 1), and those with ’extreme’ CIV/HeII ratios of 4 (Group 2). Group 2 QSO2 also have systemically higher NV/HeII ratios for otherwise similar line ratios. To explain such systems as well as the difference with Group 1 QSO2 and high z NLRG, Silva et al. (2020) propose a combination of high gas density 107 cm-3 and/or supersolar abundances 4 with N/H16 assuming secondary production of N that results in a quadratic (rather than linear) increase of its N/H abundance. The secondary production of C is also discussed by these authors as a possible explanation for the extreme CIV/HeII ratios seen in some QSO2s. However, in the case of core-ERQ no models can explain the line ratios simultaneously.
Based on the value CIV/HeII4, 17 of the 21 core-ERQ studied here are confirmed to belong to Group 2 (Fig. 2, tope left panel). The classification of the remaining 4 is not possible based on the CIV/HeII lower limits. However, the high NV/HeII (lower limits in the range 4-7) strongly suggest that they also belong to Group 2 (NV/HeII3 for Group 1 QSO2, Silva et al. 2020). The same classification appears to apply to core-ERQ in general, based on the visual inspection of their spectra (H17 ).
The four core-ERQ studied by Z16 roughly show the lower (J0834+0159 and J2215-0056) and upper values J1232+0912 and J2323-0100) of the range of line ratios spanned by core-ERQ (Fig. 2; let us not forget that only upper limits could be measured for HeII). We highlight them with different symbols for guidance and as rough markers of the extreme locations in the diagrams of core-ERQ. Most of the remaining core-ERQ overlap with them or lie in between.
We discuss next the optimum AGN photoionization models within the range explored by Silva et al. (2020). They consider in the range 102-8 cm-3 and gas metallicity in the range (0.5-5.0).
J0834+0159 and J2215-0056. They have among the lowest UV line ratios of core-ERQ. Based on their location in the diagrams NV/CIV vs. NV/HeII, NV/CIV vs. CIV/CIII], CIV/HeII vs. CIV/CIII], the optimum models have the following parameters (see Fig. 1 in Silva et al. 2020):
-
•
Secondary N and primary C models. Models with 106-8 cm-3 and 3-5 are consistent with the location of the two objects in all diagrams mentioned above. These models are also consistent with NIV]/CIV0.3 measured in these two objects.
-
•
No adequate secondary N and secondary C models are found. Only models with 102-4 cm-3 and 2 can reach NV/CIV2. However, these fail in other diagrams. For instance, they produce NV/HeII1 (compared with the observed NV/HeII3). Also, they produce CIV/CIII]5, compared with the measured CIV/CIII]=1.7.
Therefore, within the range of models explored by Silva et al. (2020), those favoured for J0834+0159 and J2215-0056 have primary production of C and secondary production of N, 106-8 cm-3 and 3-5.
J1232+0912 and J2323-0100. Their line ratios are rather extreme. NV is very strong compared with QSO2: NV/CIV2 and NV/HeII10, while QSO2 show in general NV/CIV1 and NV/HeII10. CIV/CIII]5 is also at the high end of the range of values spanned by QSO2. There are no optimum models within the parameter space explored by Silva et al. (2020) that can explain all line ratios simultaneously. On the other hand, the high NV ratios and large CIV/HeII strongly suggest high densities 106 cm-3 and/or high metallicities 4.
The discussion above suggests that densities 106 cm-3 and well above solar metallicities are unavoidable in the gas responsible for emitting the UV lines in the four core-ERQ. Since these ratios span roughly the most extreme values among core-ERQ line ratios (Fig. 2), we extend this conclusion to core-ERQ in general. We will next argue that the UV emission lines in core-ERQ have a significant, even dominant contribution from the BLR (see also Alexandroff et al. 2018).
4.1.2 Comparison with QSO1
The relative weakness of HeII is characteristic of QSO1. The UV emission lines in these systems are preferentially emitted in the BLR. They show typical CIV/HeII35, CIII]/HeII10, NV/HeII15 (Table 1; see also Vanden Berk 2001). Moreover, most core-ERQ show enhanced NV in comparison with the QSO1 composites (NV/CIV0.45; see also Vanden Berk 2001). The 97 objects in H17 have median NV/CIV=1.44 and 90% show NV/CIV0.5. 65% show NV/CIV1.0 in the range 1.0-2.9.
The enhanced NV emission is reminiscent of N-loud quasars. The strong UV Nitrogen lines in these systems have been interpreted in terms of supersolar metallicities in the BLR (e.g. Hamann & Ferland 1993, Dietrich et al. 2003, Baldwin et al. 2003, Nagao et al. 2006, Matsuoka et al. 2011), sometimes as extreme as 10 (e.g. Baldwin et al. 2003). Batra & Baldwin (2014) analysed the UV spectra of 41 N-loud quasars at 2.0-3.5. They show median NV/CIV=0.95 and NV/CIV1.0-2.4 for half the objects. The inferred metallicities are in the range 1-18 with median 5.5 .
The UV line ratios of Batra & Baldwin (2014) N-loud QSO1 are shown in the diagnostic diagrams of Fig. 2 . The two Telfer et al. (2002) QSO1 composites do not appear because their large ratios relative to HeII place them outside three of the diagrams. It can be seen that core-ERQ overlap partially in the diagrams with the area covered by N-loud QSO1. This relation is likely to apply to the general population of core-ERQ, given the similar line ratios suggested by the visual inspection of their spectra (H17 ).
This suggests that the UV lines in core-ERQ are emitted in metal rich BLR.
Different authors have reported a correlation between quasar and the BLR metallicity , as traced by the Nitrogen (N+2, N+3, N+4) emission line ratios (Hamann & Ferland 1999, Warner et al. 2004, Shemmer et al. 2004, Nagao et al. 2006, Juárez et al. 2009). Given the high of core-ERQ, high BLR abundances (and the enhacement of the NV emission as a consequence) are similarly expected if they follow the same correlation. According to Xu et al. (2018), 7-16 are expected in the BLR of quasars with log47.0-48.0 (i.e., similar to core-ERQ).
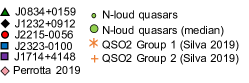
To investigate the origin of the - relation, Matsuoka et al. (2011) used the optical spectra of 2383 quasars at 2.3 3.0 extracted from SDSS. They divided the sample into bins based on and the Eddington ratio . They then extracted composite spectra for each bin of and and proceeded to measure the line ratios most sensitive to BLR metallicity, which include NV/CIV and NV/HeII. They found that the most lumoninous QSO1 show the highest NV ratios (see Fig. 3). We investigate next how NV/CIV and NV/HeII for core-ERQ behave in relation to this QSO1 correlation.
Because no reliable are available for core-ERQ (see Section 4.3), we investigate the behaviour of the line ratios with instead. for the different bins in Matsuoka et al. (2011) QSO1 sample have been obtained using and in their Table 3. They are in the range 46.34log()47.54. For comparison, 46.98log()47.86 for the core-ERQ discussed in this work (Perrotta et al. (2019)). We plot the QSO1 bins and the core-ERQ ratios in the NV/CIV vs. NV/HeII diagram (Fig. 3). QSO1 are represented with blue, red and green colours in order of increasing . The tight correlation between NV/CIV and NV/HeII for QSO1 reflects at least partially the lack of Baldwin effect of NV1240 in type 1 AGN at 5 (Dietrich et al. 2002). While the optical and UV broad and narrow lines of type 1 AGN show an anticorrelation between the REW and the continuum luminosity (the so called Baldwin effect, Baldwin 1977), the REW of NV1240 remains nearly constant over 6 orders of magnitude in continuum luminosity (Dietrich et al. 2002). The different behaviour of this line has been explained as a consequence of the increasing gas metallicity with AGN luminosity and the secondary production of N; this is, N/O O/H (Korista et al. 1998).
Core-ERQ show a large scatter, in part due to the non-detection of HeII in most of them. In spite of this, it appears clear that the NV ratios in these systems are among the highest compared to Matsuoka et al. (2011) QSO1, as we would expect based on their extreme . This supports that the lines are emitted in metal-rich BLR.
The above comparison should be taken with caution. NV ratios are very sensitive to the ionization level of the gas (Humphrey et al. 2008, Batra & Baldwin 2014). To isolate ionization effects from those due to the gas abundances, it would be necessary to measure other lines such as NIV] and NIII] (Batra & Baldwin 2014), which are in general undetected in the SDSS spectra of the core-ERQ. In spite of this limitation, the comparison presented above with QSO1 strongly suggest that the UV lines in core-ERQ are emitted by metal rich BLR (see also H17 and Alexandroff et al. 2018).
4.2 The size and density of the UV emission line region
We argued above that the UV lines are emitted in the BLR of core-ERQ. The supression of the UV/optical continuum, the wingless line profiles and the intermediate FWHM between QSO1 and QSO2 (see Sect. 4.3) suggest that we are observing the outskirts of this region.
The range in density in the BLR comes mainly from the estimated radii and photoionization theory (e.g. Osterbrock 1989, Ferland et al. 1992). Clouds with densities from 109 cm-3 (close to 3.2109 cm-3 of C III]1909) to cm-3 are expected. The highest density clouds 1013 cm-3 are continuum radiators (Rees et al., 1989). Thus, we assume 109 cm-3.
The BLR in AGN is photoionized. The main evidence is that the emission-line spectra change in response to changes in the continuum, with lag-times corresponding to characteristic radii of the BLR (Peterson, 1993). Assuming, thus, photoionization, the radiation pressure likely confines the ionized layer of the illuminated gas (Stern et al., 2014). An implication is that the gas density near the ionization front varies with distance from the nucleus as:
where is the ionizing luminosity in units of 1045 erg s-1 and is in units of 50 pc. Knowing and we can thus infer distances.
We have estimated (Stern et al., 2014). If the UV lines we see are preferentially emitted in a region of 109 cm-3, 2.1-6.7 pc or 0.7-2.1 pc for 1010 cm-3, depending on the object in the sample of 20 core-ERQ in Perrotta et al. (2019) (J1714+4148 is not considered here because is not available).
The radial size of the BLR, of 0.3 type 1 AGN with 45.0 correlates with the rest-frame 5100 Å luminosity as (Kaspi et al. 2005). This relation was expanded up to 46.0 by Vestergaard (2002). We constrain next for the core-ERQ, assuming that they follow this correlation.
We have inferred following (Runnoe et al., 2012). If core-ERQ follow this correlation, we expect log(46.1-47.2 for the 20 core-ERQ. These are 7-45 times higher than the values inferred from the observations (Perrotta et al., 2019). This shows that the optical continuum at 5100 Å is strongly suppressed (H17 ,Perrotta et al. 2019), as naturally expected in our proposed scenario. The inferred from imply 0.6-3.1 pc depending on the object, which are in reasonable agreement with the values estimated for 109-10 cm-3. Because of their high luminosity, the expected BLR sizes are 24-126 times larger than the median size inferred for the low type 1 AGN sample (29.2 lt-days, Kaspi et al. 2005). The sizes could be somewhat larger if obscuration makes any of the near-and mid-infrared emission anisotropic, since the intrinsic luminosities would be even higher (H17 ). Core-ERQ are therefore expected to have large BLR due to their extreme luminosities. This may favour the partial visibility at a wider range of inclinations than for less luminous quasars.
4.3 Orientation and partial view of the broad line region
The impact of orientation on the properties of the SED and the emission line spectra of broad line active galaxies (for instance, quasars and broad line radio galaxies, BLRG) has been widely investigated in the literature (e.g. Marziani et al. 2017, Liu et al. 2018). Some authors have proposed that at least a fraction of BLRG are partially obscured, misdirected quasars, seen at somewhat larger angles than the quasar population. In this scenario, they are quasars seen through the edge of the obscuring torus (Dennett-Thorpe et al. 2000, Morganti et al. 1997) which, thus, does not have a distinct edge (Baker 1997).
The role of orientation in the context of core-ERQ has also been discussed (H17 ). Alexandroff et al. (2018) highlight its essential role in the model they propose to explain the UV emission line and continuum spectropolarimetric properties of the core-ERQ SDSS J1652+1728 at =2.94. The authors describe a polar outflow model seen at an intermediate orientation between type 1 (face on) and type 2 (edge-on) with the UV lines being produced on spatial scales similar or greater than the scales of the dusty broad emission and broad absorption emission line regions (see also H17 ). This scenario is in turn inspired on the model proposed by Veilleux et al. (2016) for the nearest quasar MRK231.
Next we review and reinforce with new arguments the significant role that orientation plays in determining the observed properties of core-ERQ. Based on all arguments combined, we propose that a significant fraction of core-ERQ are very luminous but otherwise normal quasars seen at an intermediate orientation between type 1 (face-on) and type 2 (edge-on). This results in a partial view of the BLR, with the outskirts being visible, while the inner BLR and the AGN continuum remain hidden.
This scenario is consistent with:
The UV line ratios consistent with metal rich BLR (Sect. 4.1). The continuum source is hidden from the view while the BLR is partially observable.
The core-ERQ intermediate UV line FWHM values between QSO1 and QSO2 at similar (Sect. 1) and the lack of broad wings typical of blue QSO1 (H17 ). This can be explained if the inner BLR is obscured. The inner BLR clouds would be responsible for the broad wings of the UV lines since they are closer to the SMBH and are expected to have higher velocities (gravitational and non-gravitational due to radiation driven outflows, for instance). In such situation, the FWHM of the broad emission lines is not a reliable tracer of the BLR kinematics and not adequate to estimate black hole masses.
The large line-of-sight hydrogen column densities cm-2 implied by X-ray observations are unlikely due to galactic absorption and are naturally explained by the central AGN dusty obscuring structures (for instance, the classical equatorial optically thick dusty torus and polar dust; Ramos Almeida & Ricci 2017, Goulding et al. 2018). Moreover, the measured for typical type 1 AGN, for which a nearly face-on orientation is expected, are overall at least a factor of ten lower than those measured for core-ERQ (e.g. Mateos et al. 2005, Mateos et al. 2010, Corral et al. 2011).
The intermediate REW[OIII] between QSO1 and QSO2. Orientation seems to play a major role (although it is not the only driver) in the variance of the REW[OIII] in QSO1. REW[OIII] is used as indicator of the accretion disk inclination (e.g. Risaliti et al. 2011, Bisogni et al. 2017). Its value increases when we move from face-on to more edge-on systems, due to the decreasing contribution of the AGN continuum and FeII contamination from the BLR.
The [OIII]5007 REW of Perrotta et al. (2019) sample have REW42-646 Å with median 177 Å. For comparison, the sample of WISE/SDSS selected hyper-luminous (WISSH) QSO1 with detected and measurable REW0.2-80 Å (median 2.8 Å), being the dispersion of these values due at least in part to orientation (e.g. Bischetti et al. 2017; Vietri et al. 2018). Another parameter that influences REW[OIII] is , with very luminous systems showing lower REW[OIII] (the Baldwin effect mentioned above). The of the core-ERQ is within the range of the WISSH QSO1 ( erg s-1). If subestimated due to obscuration (H17 ), the large REW for such high intrinsic further support a more edge-on inclination than luminous blue QSO1.
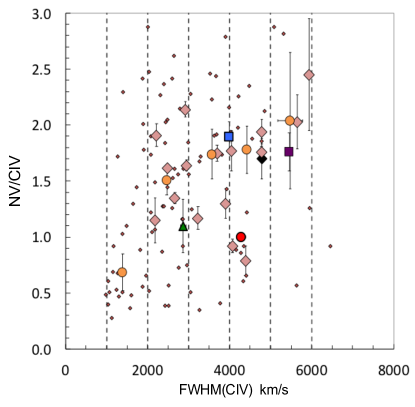
NV/CIV vs. FWHMCIV.
The general properties (ionization, density, kinematics, abundances) of the BLR and the NLR in AGN are extremely different, and this is clearly reflected on the BLR and NLR line FWHM and the UV emission line ratios (see comparison between the NLRG and the QSO1 line ratios in Fig. 2). It is natural to expect that as we move gradually from an edge-on to a face-on orientation, the UV emission line properties should change from QSO2 type to QSO1 type, as the BLR emission becomes more prominent.
The UV line FWHM and the NV line ratios are two of the most clearly distinct parameters between type 1 and type 2 AGN spectra. As explained in the previous section, high NV ratios are characteristic of the BLR, but not of the NLR. Thus, we naturally expect that FWHMCIV and NV/CIV both increase from type 2 to type 1 orientation, as the BLR becomes gradually more visible and its contribution to the UV spectrum becomes increasingly dominant relative to the NLR.
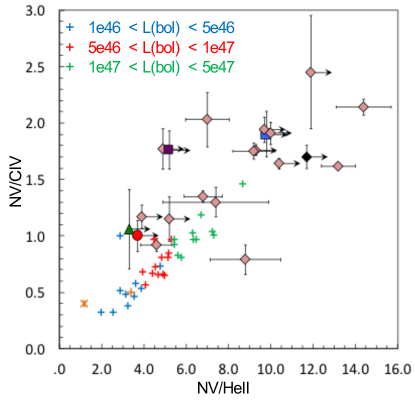
We have grouped the 97 core-ERQs in H17 in five groups according to the range of FWHMCIV: 1000-2000, 2000-3000, 3000-4000, 4000-5000 and 5000-6000 km s-1. We have calculated the median value of FWHMCIV and NV/CIV for all groups and plotted them in Fig. 4. The scatter of the whole sample is huge, but when considering the median values, it is found that as the lines become broader, NV/CIV increases. Objects with FWHM2000 km s-1 maybe similar in orientation to the QSO2 sample of Alexandroff et al. (2013), although 10 times more luminous. The large scatter of the data shows that orientation is not the only parameter influencing NV/CIV and FWHMCIV. Naturally, other parameters such as , metallicity, ionization parameter and the nature of the kinematics must be involved (as is the case in other AGN). In spite of this complexity, that the median values behave as expected from a gradual change of inclination, adds support to the idea that orientation plays an important role. According to this scenario, groups of increasingly broader CIV have an increasing relative contribution of the BLR to the emission line fluxes, that would result on higher NV/CIV, more typical of QSO1.


An intermediate orientation may also explain the heavily absorbed Ly, which suggests the presence of large amounts of absorbing gas.
The Ly profile in core-ERQ is often absorbed across most or even the entire spectral line profile (Fig. 5; see also H17 ). It is likely that in at least some objects, the emission at 1216 Å flux is not dominated by Ly but by OV]1214,1218 instead (Humphrey 2019). The Ly absorbers span a broad range of velocities of thousands km s-1 which are both blueshifted and redshifted. This is reminiscent of the broad line absorbers (BLA) (also both blueshifted and/or redshifted depending on the lines) found by Zhou et al. (2019) in a small sample of QSO1. They propose that the highly redshifted BAL arising from neutral hydrogen, helium and FeII atoms are due to inflowing gas directly feeding the accretion disk. The authors propose high inclination angles, intermediate between face-on and edge-on and a location for the absorbers between the accretion disk and the dusty torus.
4.4 The [OIII] outflows and the effects of orientation
The unified model proposes that the [OIII]5007 emission in AGN originates from regions outside the central obscuring structure and should therefore be independent of orientation. On the other hand, because the AGN continuum is strongly anisotropic, some [OIII] properties do indeed depend on orientation. QSO1 studies have shown that not only REW[OIII] changes as a function of orientation, but also the prominence and observed kinematics of the outflowing gas in the NLR as traced by the [OIII] profile (e.g. Shen & Ho 2014, Bisogni et al. 2017, Marziani et al. 2017). The blue broad outflow component decreases both in intensity and in velocity shift relative to the reference wavelength with increasing REW[OIII]. They interpret these results in terms of a gradual change of orientation from face-on (low REW[OIII]) to more edge on (high REW[OIII]) positions.
In an orientation based scenario, the most extreme kinematics associated with an ionised outflow are expected to be observed in face-on luminous quasars. This means that extreme [OIII] outflows with velocities of several 1000s km s-1 should be detected in QSO1 with similar to those of core-ERQs. On the contrary, Perrotta et al. (2019) found that core-ERQ exhibit the broadest and more blueshifted [OIII] emission lines ever reported, with outflow velocities about three times larger than those of luminosity-matched blue quasar samples (see also Z16 ). These extreme and apparently unique [OIII] kinematics contradict the orientation scenario.
We revise next whether there is enough evidence to sustain this conclusion.
4.4.1 Fitting [OIII] in luminous QSO1
Perrotta et al. (2019) considered for the comparative QSO1 sample the five WISSH QSOs presented in Bischetti et al. (2017), and the 74 luminous QSO1 in Shen (2016), which have 46.248.2 and 1.53.5. They re-built the artificial [OIII]5007 lines for each QSO1, using the best-fit gaussian parameters quoted by Shen (2016) and Bischetti et al. (2017). They compared the inferred non-parametric velocities with those of core-ERQs. No errors have been estimated. They derived an average = km s-1 for this QSO1 sample.
The first issue to take into account is that the low REW[OIII], the complex H+[OIII] blend and the presence of strong and complex FeII emission in luminous QSO1 makes the determination of [OIII] spectral parameters very challenging. Different works have shown that, albeit with a very large scatter, REW[OIII] decreases with increasing AGN luminosity (the [OIII] Baldwin effect; Brotherton 1996, Dietrich et al. 2002, Shen 2016). This is, at the highest luminosities, the [OIII] lines, if detected, are more difficult (often impossible) to parametrise due to their low REW and the relatively stronger contamination by the broad H and the underlying FeII multiplets. We argue that the particular orientation of core-ERQ facilitates the detection and parametrisation of the outflows, thanks to the higher contrast of the [OIII] lines relative to the continuum, the FeII multiplets and to the broad H, since these are totally or partially obscured.
Indeed, we note that i) about 70% of the 18 WISSH QSO1 analysed in Vietri et al. (2018) (see also Bischetti et al. 2017) shows weak/absent [OIII] emission, hindering the detection and accurate characterisation of the outflows in most of their targets, and ii) about 35% of the QSO1 in Shen (2016) is associated with [OIII] detections with significance. Furthermore, the QSO1 in Shen (2016) are characterised by low REW, with an average REW[OIII] = (see Fig. 4 in Shen 2016). Therefore, the outflow velocities must be associated with very large uncertainties.
Recently, Coatman et al. (2019) re-analysed all rest-frame spectra of z¿1.5 type 1 QSOs available from the literature, in order to infer the properties of ionised outflows traced by [OIII] gas with a uniform analysis strategy. The authors provided new independent velocity measurements for the Shen (2016) targets, also reporting significant differences in the derived [OIII] fluxes and velocities. They showed that such discrepancies are not due to the quality of the analysed near-infrared spectra, but to the systematic effects associated with the fit. For instance, the chosen templates to model the FeII emission (see e.g. Kovac̆ević et al. 2010, Vietri et al. 2018 and refs therein), the adopted function(s) to reproduce the BLR emission (for instnace, single or multiple Gaussian or Lorentzian functions, or broken power-laws; see e.g. Nagao et al. 2006, Shen et al. 2011), and the shape of the underlying continuum (e.g. Mejiá-Restrepo et al. 2016; Varisco et al. 2018) can significantly affect the analysis results. All these systematic effects are more and more important for QSO1 with high , for which we expect more extreme outflows (e.g. King & Pounds 2015; Ishibashi et al. 2018) but also higher emission from the more nuclear regions relative to the [OIII] line flux (e.g. Shen & Ho 2014, Shen 2016).
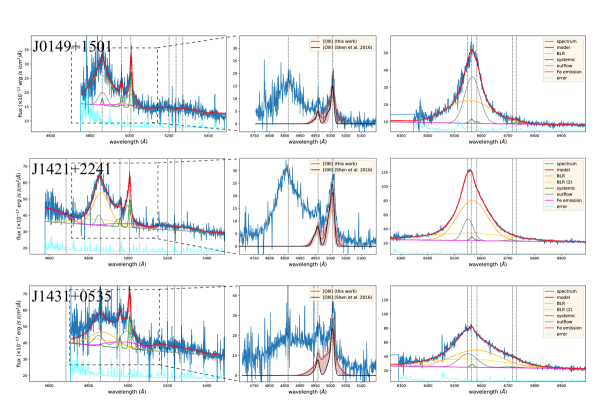
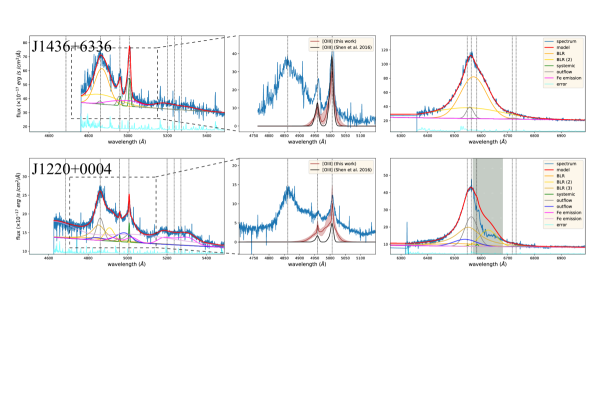
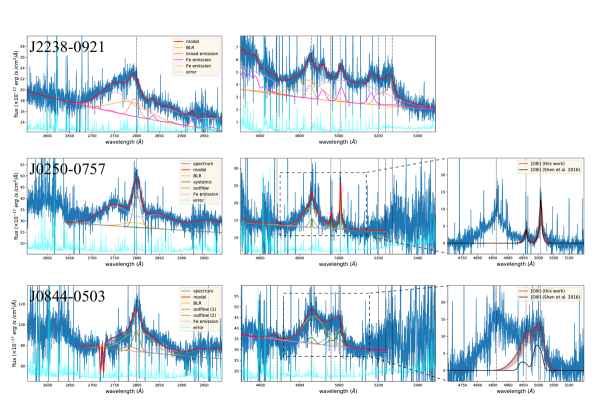
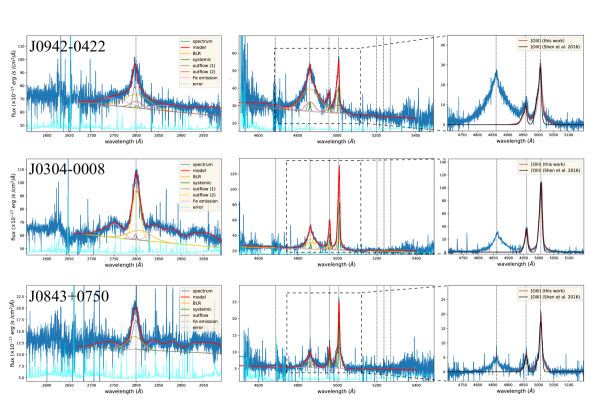
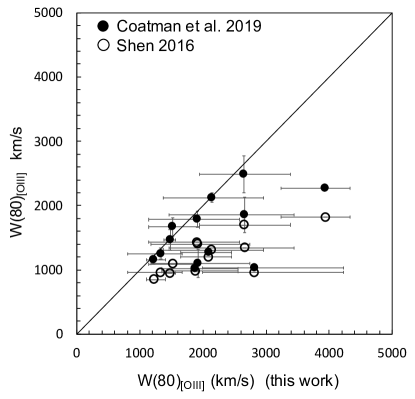
To further highlight the difficulties in deriving robust [OIII] kinematics of high luminosity QSO1, we derive new outflow velocity measurements for a subsample of blue QSO1 presented in Shen (2016), using a different method, the multicomponent simultaneous fit analysis (e.g. Brusa et al. 2015). We focus on the 13 out of 19 targets at z (as the core-ERQs) associated with good quality NIR spectra. We refer to Appendix B for details regarding the fit analysis and the main differences with respect to the previous work by Shen (2016) and Coatman et al. (2019). In Table 2 we report the and measurements we derived from the [OIII] profiles, together with those from Shen (2016) and Coatman et al. (2019) analysis (see also Table 5 in Appendix B).
The three sets of values are also compared in Fig. 6. Our results are in better agreement with Coatman et al. (2019) than with Shen (2016), who measures lines 1.3 to 3 times narrower. The differences in the analysis results between our work and these two studies highlight the difficulties in deriving robust [OIII] kinematic measurements for very luminous QSO1. Such difficulty is reflected also by the large errors of our values. These are larger than those in Coatman et al. (2019). We consider our errors more realistic, since they take into account (whenever possible) all systematic effects related to the modelling of continuum, FeII, BLR and NLR emission (see Appendix B). Non-parametric velocities errors are not available for Shen (2016).
The 13 QSO1 discussed above have (0.8-15.0)1044 erg s-1. We infer 2000 km s-1 for 11 of them (see Table 2). All are above the median 1568 km s-1 quoted by Perrotta et al. (2019) for the entire QSO1 sample from Shen (2016). Out of the 18 QSO1 within the range as the subsample fitted by us, they find only three with 2000 km s-1 (see their Fig. 4). Based on the Shen (2016) fits, they clearly obtain significantly narrower lines than core-ERQ for the blue QSO1 comparative sample. With all the caveats mentioned above, it is clear that these kinematic parameters must be affected by very large uncertainties. Unless errors are quoted, any comparison with core-ERQ can only be considered tentative.
It is also important to note that the core-ERQ values in Perrotta et al. (2019) are lower limits. They estimated for each object, multiplying the [O III] REW by the luminosity at 5007 Å. To obtain the continuum fluxes at this , they linearly interpolated the WISE W1 (3.6m) and SDSS or magnitudes and then converted the derived values at 5007 Å into fluxes. As pointed out by the authors, the luminosities could be on average 6.3 times higher, since the median core-ERQ spectral energy distribution (SED) is suppressed at 5000Å by about 2 mag relative to normal/blue quasars (H17 ). The correction factor could be even higher (Sect. 4.2).
4.4.2 [OIII] kinematics. Comparison between core-ERQ and luminous QSO1
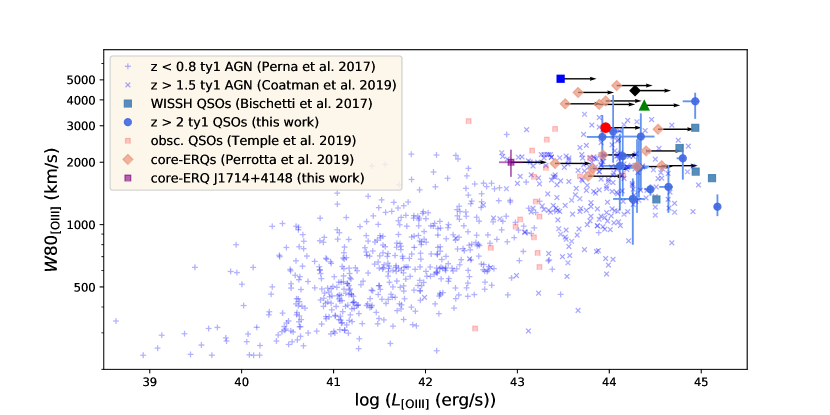
In Fig. 7 we compare the [OIII] kinematics of core-ERQs as traced by with other samples of type 1 AGN. In particular, we consider:
Perrotta et al. (2019) core-ERQ (the four objects from Z16 are highlighted with different symbols as in Fig. 2). have been derived rescaling their , assuming 0.72. This is consistent with the value expected for a gaussian profile, and with the ratios in Zakamska & Greene (2014) for type 2 AGN, in Z16 for core-ERQs and in Coatman et al. (2019) for QSO1;
SDSS J1714+4148 (see Sect. 3);
13 QSO1 from Shen (2016) at 2 using the result from our new fits;
Low X-ray detected SDSS type 1 AGN at 0.8 from Perna et al. (2017a). This sample allows us to highlight the correlation between and over a range of five dex, as well as its large scatter at fixed luminosity;
Five WISSH QSO1 from Bischetti et al. (2017). We have measured by reconstructing the [OIII] profiles with the Gaussian parameters provided by the authors in their tables;
Coatman et al. (2019) sample of luminous QSO1 (45.549.0) at 1.54.0. The 13 QSO1 at 2 re-analysed in this work have not been excluded from the figure (see Fig.6 and Table 2 for a comparison between their fit results and ours);
22 heavily reddened quasar candidates from the UKIDSS-LAS, VISTA VHS and VIKING imaging surveys at 2.02.6 and 46.0log()48.5 (Temple et al. 2019).
These are the main conclusions:
- core-ERQ fall on the vs. correlation defined by different samples of type 1 AGN. This is consistent with the scenario in which more kinematically extreme outflows are triggered by more luminous AGN. Any reasonable correction factor to due to dust extinction would maintain them within the correlation.
- there are very luminous non-obscured QSO1 with [OIII] as broad as core-ERQ (Shen 2016, Bischetti et al. 2017, Coatman et al. 2019). 9 out of the 22 heavily reddened quasar candidates (Temple et al. 2019) show [OIII] kinematics similar to some core-ERQ (see Fig. 7). The extreme [OIII] kinematics is, therefore, not exclusive of this object class.
- taking into account the lower limits on and the new results on the blue QSO1 sample of Shen (2016) it cannot be claimed that core-ERQ show in general more extreme kinematics compared with blue QSO1 of matched bolometric luminosities.
- Extreme [OIII] kinematics is indeed much more frequent in core-ERQ (100%) than in QSO1, as already pointed out by Perrotta et al. (2019). Considering all AGN samples, out of the 9 objects with the most extreme kinematics (4000 km s-1), 8 are core-ERQ. Whether this is a real intrinsic difference due to truly more extreme outflows being triggered in core-ERQ or rather an artificial effect due to uncertainties resultant of all caveats mentioned above and the easier detection and parametrisation of outflows in core-ERQ is unknown.
Based on the above, we conclude that the extreme [OIII] kinematics of core-ERQ do not pose a problem for the orientation based scenario.
| Name | 1044 | 1044 | |||||||
|---|---|---|---|---|---|---|---|---|---|
| erg s -1 | km s-1 | km s-1 | erg s-1 | km s-1 | km s-1 | km s-1 | km s-1 | ||
| J0149+1501 | 2.0726 | 1.3 | 1920 | 2540 | 1.0 | 1100221 | 1457287 | 1400 | 1695 |
| J1421+2241 | 2.1887 | 2.0 | 1910 | 2500 | 2.0 | 1784126 | 2341178 | 1430 | 1750 |
| J1431+0535 | 2.1004 | 2.2 | 2660 | 3560 | 1.9 | 1856275 | 2410320 | 1340 | 1720 |
| J1436+6336 | 2.0665 | 2.1 | 1880 | 2480 | 1.1 | 101945 | 130463 | 980 | 1270 |
| J1220+0004 | 2.0479 | 1.1 | 2820 | 3690 | 0.3 | 103339 | 132388 | 960 | 1260 |
| J0250-0757 | 3.3376 | 1.8 | 1330 | 1800 | 1.8 | 125085 | 1740106 | 960 | 1360 |
| J0844+0503 | 3.3603 | 8.6 | 3940 | 4960 | 49.0 | 22707 | 29128 | 1820 | 2250 |
| J0942+0422 | 3.2790 | 6.3 | 2090 | 3140 | 5.1 | 126623 | 161635 | 1200 | 1520 |
| J0304-0008 | 3.2859 | 15.0 | 1220 | 1920 | 8.1 | 115564 | 1634129 | 850 | 1140 |
| J0843+0750 | 3.2648 | 2.8 | 1480 | 2060 | 2.6 | 1464163 | 2008273 | 950 | 1210 |
| J1019+0254 | 3.3829 | 1.4 | 2140 | 2870 | 0.7 | 212174 | 272396 | 1310 | 1670 |
| J0259+0011 | 3.3724 | 4.4 | 1520 | 2070 | 3.4 | 1668141 | 2306223 | 1090 | 1490 |
| J1034+0358 | 3.3918 | 0.84 | 2650 | 3430 | 0.5 | 2484287 | 2959305 | 1700 | 2060 |
4.4.3 Kinetic power of the [OIII] outflows
High outflow kinetic powers of at least 3-5% of have been inferred for core-ERQ (Perrotta et al. 2019). In principle, such powerful winds have the potential to affect the evolution of the host galaxies. For these calculations, sizes =1 kpc and densities =200 cm-3 were assumed. The authors provide a range of uncertainties to account for a possible range 100-1000 cm-3 and outflow sizes 0.5-7 kpc.
The most likely situation is that the ionized outflows are spatially unresolved (Karouzos et al. 2016, Villar Martín et al. 2016, Husemann et al. 2016, Rose et al. 2018, Tadhunter et al. 2018). The integrated spectra used for the outflow measuments are expected to be dominated by the compact NLR where a broad range densities of up to 107 cm-3 are likely to exist (see Villar Martín et al. 2016 for a discussion). For a broad distribution of densities, the emission of a certain forbidden line is expected to peak at gas with similar to its critical density (e.g. Stern et al. 2014). For the [OIII]4959,5007 lines, =8.6105 cm-3. If as argued in Sect. 4.2 radiation pressure confinement defines the gas density spatial profile, we can infer the size of the [OIII] region for eacth object using equation [eq. 1], and . The inferred sizes are 73-227 pc, depending on the object. Using these sizes and , the kinetic powers of the outflows are reduced by a factor of 300-977 depending on the object and become 1% . The existence of lower gas in the outflows is of course possible (e.g. Baron & Netzer 2019; Perna et al. 2017b) and it may carry a significant amount of mass, but with the existing data, nothing can be said about it.
High spatial resolution spectroscopy is essential to resolve the ionized outflows and characterise more accurately their sizes, geometry, and density distribution. In the meantime, the kinetic powers are too uncertain to infer any useful conclusion regarding their potential to affect the evolution of the host galaxies.
5 Summary and conclusions
Core-extremely red quasars (core-ERQ) have been proposed to represent an intermediate evolutionary phase in which a heavily obscured quasar is blowing out the circumnuclear ISM with very energetic outflows prior to becoming an optical quasar, as well as sites of extreme large scale (1 kpc) outflows that inhibit star formation.
Based on the revision of the general UV and optical emission line properties of core-ERQ at 2-3 we propose that at least a high fraction of core-ERQ are very luminous but otherwise normal quasars viewed at an intermediate orientation between type 1 (face-on) and type 2 (edge-on). The general properties are not necessarily indicative of the particular evolutionary phase mentioned above, but are instead strongly determined by orientation and the effects of the high bolometric luminosities.
The calculations and results presented here rest on the assumption that core-ERQ follow many correlations identified in other AGN samples. Although this is uncertain, the argumentations suggest that they host large broad line regions (several pc). The highly inclined line of sight is such that we observe only part (the outskirts) of the super-solar metallicity BLR. We propose that the inner BLR and the continuum source remain hidden by the torus.
An intermediate orientation is consistent with many properties of core-ERQ: the UV line ratios similar to N-loud QSO1, the large CIV1550 and [OIII]5007 rest-frame equivalent widths compared with QSO1 of similar , the intermediate FWHM of the UV lines between QSO1 and QSO2 at similar and their wingless profiles. It is also consistent with the large 1023 cm-2 implied by X-ray observations and the heavily absorbed Ly profiles.
We present a revised comparison of the [OIII] kinematics in 21 core-ERQ (20 from Perrotta et al. (2019) and SDSS J1714+4148, based on GTC EMIR near infrared spectroscopy) with other samples of type 1 AGN. Core-ERQ fall on the vs. correlation defined by different samples of type 1 AGN. This is consistent with the scenario in which more kinematically extreme outflows are triggered by more luminous AGN.
The extreme [OIII] kinematics of core-ERQ are not exclusive of this object class, as demonstrated by our revised spectral fits of luminous non-obscured QSO1 at similar and other recent works (Bischetti et al. 2017, Coatman et al. 2019, Temple et al. 2019). Contrary to other works (Perrotta et al. 2019), we find that there is no evidence to support that core-ERQ show in general more extreme kinematics compared with blue QSO1 of matched bolometric luminosities. The difficulty to detect and/or the large uncertainties affecting the parametrisation of the [OIII] profiles in the luminous QSO1 comparison sample, and the fact that both and of core-ERQ are very uncertain (and underestimated), lie at the core of this discrepancy.
Extreme [OIII] kinematics are indeed much more frequent in core-ERQ (100%), as already pointed out by other authors (Perrotta et al. 2019). Whether this is a real intrinsic difference due to truly more extreme outflows being triggered in core-ERQ or rather an artificial selection effect due to the difficulties to detect and characterise [OIII] outflows in luminous QSO1 in comparison with the much easier detection and parametrisation in core-ERQ is unknown.
High spatial resolution spectroscopy is essential to resolve the [OIII] outflows and characterise more accurately their sizes, geometry and density distribution. In the meantime, the kinetic powers are too uncertain to infer any useful conclusion regarding their potential to affect the evolution of the host galaxies.
As proposed by other authors, core-ERQ are ideal systems to detect and characterise the most extreme AGN outflows. Whether this is a consequence of the blow-out quasar phase or of a particular intermediate orientation remains to be disentangled.
Acknowledgements.
We thank José Acosta Pulido for valuable scientific discussions and the anonymous referee for the thorough revision of the manuscript. Thanks also to Yue Shen for making his QSO1 NIR spectra available. Partly based on observations made with the GTC telescope and the EMIR instrument at the Spanish Observatorio del Roque de los Muchachos of the Instituto de Astrofísica de Canarias (program GTC14-19A). We thank the GTC staff for their support with the observations. We thank Joel Vernet for providing the high NLRG composite spectrum. MVM acknowledges support from the Spanish Ministerio de Ciencia, Innovación y Universidades through the grants AYA2015-64346-C2-2-P and PGC2018-094671-B-I00 (MCIU/AEI/FEDER,UE). MP is supported by the Programa Atracción de Talento de la Comunidad de Madrid via grant 2018-T2/TIC-11715. MP acknowledges support from the Spanish Ministerio de Economía y Competitividad through the grant ESP2017-83197-P. AH acknowledges FCT Fellowship SFRH/BPD/107919/2015; Support from European Community Programme (FP7/2007-2013) under grant agreement No. PIRSES-GA-2013-612701 (SELGIFS); Support from FCT through national funds (PTDC/FIS-AST/3214/2012 and UID/FIS/04434/2013), and by FEDER through COMPETE (FCOMP-01-0124-FEDER-029170) and COMPETE2020 (POCI-01-0145-FEDER-007672). S.M. acknowledges financial support through grant AYA2016-76730-P (MINECO/FEDER). This research has made use of: 1) the VizieR catalogue access tool, CDS, Strasbourg, France. The original description of the VizieR service was published in Ochsenbein et al. A&AS, 143, 23; 2) data from Sloan Digital Sky Survey. Funding for the SDSS and SDSS-II has been provided by the Alfred P. Sloan Foundation, the Participating Institutions, the National Science Foundation, the U.S. Department of Energy, the National Aeronautics and Space Administration, the Japanese Monbukagakusho, the Max Planck Society, and the Higher Education Funding Council for England. The SDSS Web Site is http://www.sdss.org/; 3) the Cosmology calculator by Wright (2006); 4) the NASA/IPAC Extragalactic Database (NED), which is operated by the Jet Propulsion Laboratory, California Institute of Technology, under contract with the National Aeronautics and Space Administration.References
- Alexandroff et al. (2013) Alexandroff, R., Strauss, M., & Greene, J., et al. 2013, MNRAS, 435, 3306
- Alexandroff et al. (2018) Alexandroff, R., Zakamska, N.L., & Barth, A.J., et al. 2018, MNRAS, 479, 4936
- Alonso Herrero et al. (2011) Alonso Herrero, A., Ramos Almeida, C., Mason, R., et al. 2011, ApJ, 736, 82
- Antonucci (1993) Antonucci, R., 1993, ARA&A, 31, 473
- Bae & Woo (2016) Bae, H.J., & Woo, J.H., 2016, ApJ, 828, 97
- Baker (1997) Baker, J.C., 1997, MNRAS, 286, 23
- Baldwin (1977) Baldwin, J.A., 1977, ApJ, 214, 679
- Baldwin et al. (1995) Baldwin, J.A., Ferland, G., Korista, K., & Verner, D., 1995, ApJL, 455, 119
- Baldwin et al. (2003) Baldwin, J. A., Hamann, F., Korista, K. T., et al. 2003, ApJ, 583, 649
- Baron & Netzer (2019) Baron, D., & Netzer, H., 2019, MNRAS, 486, 4290
- Baskin & Laor (2018) Baskin, A., & Laor, A., 2018, MNRAS, 474, 1970
- Batra & Baldwin (2014) Batra, N.D., & Baldwin, J.A., 2014, MNRAS, 439, 771
- Bischetti et al. (2017) Bischetti, M., Piconcelli, E., & Vietri, G.M., et al. 2017, A&A, 598, 122
- Bisogni et al. (2017) Bisogni, S., Marconi, A., Risaliti, G., & Lusso, E., 2017, Front. Astron. Space Sci., 4, 48
- Bisogni et al. (2017b) Bisogni, S., di Serego Alighieri, S., Goldoni, P., & Ho, L.C., 2017, A&A, 603, 1
- Boroson & Green (1992) Boroson T. A., & Green R. F., 1992, ApJS, 80, 109
- Bottorff et al. (2002) Bottorff, M., Baldwin, J.A., Ferland, G.J., Ferguson, J.W., & Korista, K.T., 2002, ApJ, 581, 932
- Brotherton (1996) Brotherton, M.S., 1996, ApJS, 102, 1
- Brusa et al. (2015) Brusa, M., Bongiorno, A., & Cresci, G., et al. 2015, MNRAS, 446, 2394
- Cappellari (2017) Cappellari, M., 2017, MNRAS, 466, 798
- Coatman et al. (2019) Coatman, L., Hewett, P.C., Banerji, M., et al. 2019, MNRAS, 486, 5335
- Concas et al. (2019) Concas, A., Popesso, P., Brusa, M., et al. 2019, A&A, 622, 188
- Corral et al. (2011) Corral, A., Della Ceca, R., Caccianiga, A., et al. 2011, A&A, 530, 42
- Czerny & Hryniewicz (2011) Czerny, B., & Hryniewicz, K., 2011, A&A, 525, 8
- Dawson et al. (2013) Dawson, K.S., Schlegel, D.J., & Ahn, C.P., et al. 2013, AJ, 145, 10
- de Breuck et al. (2000) De Breuck, C., Rötgering, H., Miley, G., van Breugel, W., & Best, P., 2000, A&A, 362, 519
- Dennett-Thorpe et al. (2000) Dennett-Thorpe, J., Barthel, P.D., & van Bemmel, I.M., 2000, A&A, 364, 501
- Dietrich et al. (2002) Dietrich, M., Hamann, F., Shields, J. C., et al. 2002, ApJ, 581, 912
- Dietrich et al. (2003) Dietrich, M., Hamann, F., Shields, J.C., et al. 2003, ApJ, 589, 722
- Eisenstein et al. (2011) Eisenstein, D.J., Weinberg, D.H., & Agol, E., et al. 2011, AJ, 142, 72
- Elíasdóttir et al. (2009) Elíasdóttir, Á., Fynbo, J.P.U., & Hjorth, J., et al. 2009, ApJ, 697, 1725
- Elitzur (2012) Elitzur, M., 2012, ApJL, 747, 33
- Feltre, Charlot & Gulkin (2016) Feltre, A., Charlot, S., & Gutkin, J., 2016, MNRAS, 456, 3354
- Ferland et al. (1992) Ferland, G.J., Peterson, B.M., Horne, K., Welsh, W.F., & Nahar, S.N., 1992, ApJ, 387, 95
- Gaskell (1982) Gaskell, C.M., 1982, ApJ, 263, 79
- Goulding et al. (2018) Goulding, A.D., Zakamska, N.L., & Alexandroff, R.M., et al. 2018, ApJ, 856. 4
- Greene & Ho (2005) Greene, J., & Ho, L.C., 2005, ApJ, 630, 122
- Hamann & Ferland (1993) Hamann, F., & Ferland, G., 1993. ApJ, 418, 11
- Hamann & Ferland (1999) Hamann, F., & Ferland, G., 1999, 1999, ARA&A, 37, 487
- (40) Hamann, F., Zakamska, N.L.; Ross, N., et al. 2017, MNRAS, 464, 3431 (H17)
- Harrison et al. (2016) Harrison, C.M., Alexander, D.M., Mullaney, J.R., et al. 2016, MNRAS, 456, 1195
- Humphrey et al. (2008) Humphrey, A., Villar-Martín, M., Vernet, J., et al. 2008, MNRAS, 383, 11
- Humphrey (2019) Humphrey A., 2019. MNRAS, 486, 2102
- Husemann et al. (2016) Husemann, B., Scharwächter, J., & Bennert, V.N., et al. 2016, A&A, 594, 44
- Ishibashi et al. (2018) Ishibashi, W., Fabian, A.C., & Maiolino, R., 2018, MNRAS, 476, 512
- Juárez et al. (2009) Juárez, Y., Maiolino, R., Mújica, R., et al. 2009, A&A, 494, L25
- Karouzos et al. (2016) Karouzos, M., Woo, J.H., & Bae, H.J., 2016, ApJ, 819, 148
- Kaspi et al. (2005) Kaspi, S., Maoz, D., Netzer, H., et al. 2005, ApJ, 629, 61
- King & Pounds (2015) King, A., & Pounds, K., 2015, ARA&A, 53, 115
- Korista et al. (1998) Korista, K. T., Baldwin, J. A., & Ferland, G. J., 1998, ApJ, 507, 24
- Kovac̆ević et al. (2010) Kovačević, J., Popović, Luka, Č., & Dimitrijević, M.S., 2010, ApJS, 189, 15
- Liu et al. (2013) Liu, G., Zakamska, N., Greene, J.E., Nesvadba, N.P.H., & Liu, X., 2013, MNRAS, 436, 2576
- Liu et al. (2018) Liu, T., Merloni, A., Wang, J.X., et al. 2018, MNRAS, 479, 5022
- Lusso et al. (2018) Lusso, E., Worseck, G., Hennawi, J.F., et al. 2015, MNRAS, 449, 4204
- Marziani et al. (2017) Marziani, P., Negrete, C.A., Dultzin, D., et al. 2017, Front. Astron. Space Sci., 4, 16
- Mateos et al. (2005) Mateos, S., Barcons, X., Carrera, F. J., et al. 2005, A&A, 444, 79
- Mateos et al. (2010) Mateos, S., Carrera, F.J., Page, M.J., et al. 2010, A&A, 510, 35
- Mateos et al. (2016) Mateos, S., Carrera, F.J., & Alonso-Herrero, A., et al. 2016, ApJ, 819, 166
- Matsuoka et al. (2011) Matsuoka, K., Nagao, T., Marconi, A., Maiolino, R., & Taniguchi, Y., 2011, A&A, 527, 100
- Mejiá-Restrepo et al. (2016) Mejiá-Restrepo, J.E., Trakhtenbrot, B., Lira, P., Netzer, H., & Capellupo, D.M., 2016, MNRAS, 460, 187M
- Morganti et al. (1997) Morganti, R., Oosterloo, T.A., Reynolds, J.E., Tadhunter, C.N., & Migenes, V., 1997, MNRAS, 284, 541
- Nagao et al. (2006) Nagao, T., Marconi, A., & Maiolino, R., 2006, A&A, 447, 157
- Nakajima et al. (2018) Nakajima, K., Schaerer, D., & Le Fèvre, O., et al. 2018, A&A, 612, 94
- Netzer & Davison (1979) Netzer, H., & Davidson, K., 1979, MNRAS, 187, 871
- Netzer & Laor (1993) Netzer H., & Laor A., 1993, ApJL, 404, 51
- Osterbrock (1989) Osterbrock D.E., 1989, Astrophysics of Gaseous Nebulae and Active Galactic Nuclei. University Science Books. ISBN 0-935702-22-9
- Page et al. (2012) Page, M.J., Symeonidis, M., & Vieira, J.D., et al. 2012, Nature, 485, 213
- Perna et al. (2017a) Perna, M., Lanzuisi, G., Brusa, M., Mignoli, M., & Creci, G., 2017a, A&A, 603, 99
- Perna et al. (2017b) Perna, M., Lanzuisi, G., Brusa, M., Creci, G., & Mignoli, M., 2017b, A&A, 606, 96
- Perrotta et al. (2019) Perrotta, S., Hamann, F., Zakamska, N.L., et al. 2019, MNRAS, 488, 4126
- Peterson (1993) Peterson, B.M., 1993, PASP, 105, 247
- Popović et al. (2019) Popović, L.Č., Kovačević-Dojčinović, J., & Marčeta-Mandić, S., 2019, MNRAS, 484, 3180
- Ramos Almeida et al. (2009) Ramos Almeida, C., Pérez García, & A. M., Acosta-Pulido, J., 2009, ApJ, 694, 1379
- Ramos Almeida et al. (2011) Ramos Almeida, C., Levenson, N.A., & Alonso-Herrero, A., et al. 2011, ApJ, 731, 92
- Ramos Almeida & Ricci (2017) Ramos Almeida, C., & Ricci, C., 2017, Nat. Ast., 1, 679
- Rees et al. (1989) Rees, M., Netzer, H., & Ferland, G., 1989, ApJ, 347, 640
- Richards et al. (2011) Richards, G.T., Kruczek, N.E., & Gallagher, S.C., et al. 2011, AJ, 141, 167
- Risaliti et al. (2011) Risaliti, G., Salvati, M., & Marconi, A., 2011, MNRAS, 411, 2223
- Rose et al. (2018) Rose, M., Tadhunter, C., Ramos Almeida, C., et al. 2018, MNRAS, 474, 128
- Ross et al. (2012) Ross N.P., Myers, A.D., & Sheldon, E.S., et al. 2012, ApJS, 199, 3
- (81) Ross, N.P., Hamann, F., Zakamska, N.L., et al. 2015, MNRAS, 453, 3932
- Runnoe et al. (2012) Runnoe, J.C., Brotherton, M.S., & Shang, Z., 2012, MNRAS, 422, 478
- Runnoe et al. (2014) Runnoe, J.C., Brotherton, M.S., DiPompeo, M.A., & Shang, Z., 2014, MNRAS, 438, 3263
- Schwarz (1978) Schwarz G., 1978, Ann. Stat., 6, 461
- Shemmer et al. (2004) Shemmer, O., Netzer, H., & Maiolino, R., et al. 2004, ApJ, 614, 547
- Shen et al. (2011) Shen, Y., Richards, G.T., & Strauss, M.A., et al., 2011, ApJS, 194, 45
- Shen & Liu (2012) Shen, Y., & Liu, X., 2012, ApJ, 753, 125
- Shen & Ho (2014) Shen, Y., & Ho, L.C., 2014, Nature, 513, 210
- Shen (2016) Shen, Y., 2016, ApJ, 817, 55
- Silva et al. (2020) Silva, M., Humphrey, A., Lagos, P., & Morais, S.G., 2020, MNRAS, submitted
- Stern et al. (2014) Stern, J., Laor, A., & Baskin, A., 2014, MNRAS, 438, 901
- Sulentic et al. (2007) Sulentic, J.W., Bachev, R., Marziani, P., Negrete, C.A., & Dultzin, D., 2007, ApJ, 666, 757
- Tadhunter et al. (2018) Tadhunter, C., Rodríguez Zaurín, J., Rose, M. et al. 2018, MNRAS, 478, 1558
- Telfer et al. (2002) Telfer, C.T., Zheng, W., Kriss, G.A., & Davidsen, A.F., 2002, ApJ, 565, 773
- Temple et al. (2019) Temple, M.J., Banerji, M., Hewett, P.C., et al. 2019, MNRAS, 2019, MNRAS, 487, 2594
- Urry & Padovani (1995) Urry, C.M., & Padovani, P., 1995, PASP, 107, 803
- Vacca (2003) Vacca, W.D., Cushing, M.C., & Rayner, J. T., 2003, PASP, 115, 389
- Vanden Berk (2001) Vanden Berk, D.E., Richards, G.T., & Bauer, A., 2001, AJ, 122, 549
- Varisco et al. (2018) Varisco, L., Sbarrato, T., Calderone, G., & Dotti, M., 2018, A&A, 618, 127
- Veilleux et al. (2016) Veilleux, S., Meléndez, M., Tripp, T.M., Hamann, F., & Rupke, D.S.N., 2016, ApJ, 825, 42
- Vernet et al. (2001) Vernet, J., Fosbury, R. A. E., Villar Martín, M., et al. 2001, A&A, 366, 7
- Vestergaard (2002) Vestergaard, M., 2002, ApJ, 571, 733
- Vietri et al. (2018) Vietri, G., Piconcelli, E., Bischetti, M., et al. 2018, A&A, 617, 81
- (104) Villar Martín, M., Tadhunter, & C., Clark, N., 1997, A&A, 323, 21
- Villar Martín et al. (2007) Villar Martín, M., Humphrey, A., De Breuck, C., et al. 2007, MNRAS, 375, 1299
- Villar Martín et al. (2016) Villar Martín, M., Arribas, S., Emonts, B., et al., 2016, MNRAS, 460, 130
- Warner et al. (2004) Warner, C., Hamann, F., & Dietrich, M. 2004, ApJ, 608, 136
- Wright (2006) Wright, E.L. 2006 PASP, 118, 1711
- Xu et al. (2018) Xu, F., Bian, F., Shen ,Y., et al. 2018, MNRAS, 480, 345
- Zakamska & Greene (2014) Zakamska, N.L., & Greene, J., 2014, MNRAS, 442, 784
- (111) Zakamska, N.L., Hamann, F., Pǎris, I., et al. 2016, MNRAS, 459, 3144 (Z16)
- Zheng et al. (1997) Zheng, W., Kriss, G.A., Telfer, R.C., Grimes, J.P., & Davidsen, A.F., 1997, ApJ, 475, 469
- Zhou et al. (2019) Zhou, H.S., Shi, X., & Yuan W., et al. 2019, Nature, 573, 83
Appendix A UV line ratios of core-ERQ
We show in Tables 3 and 4 the line ratios for the 16 core-ERQ not included in Table 1. For all objects, the line fluxes were measured by integrating the flux within the area defined by the line profiles. This method is more accurate than fitting Gaussian profiles when the lines are highly asymmetric due to, for instance, absorption. Gaussian fits were also applied when the line of interest was blended with a neighbouring line. This was useful, for instance, to measure CIII]1909 more precisely. This line is often blended with SiIII]1883,1892. In a minority of objects, when the lines are very broad, AlIII]1857 can also contaminate this blend. In such cases, different constraints were applied to get a range of possible CIII] fluxes. As an example, when necessary, the FWHM of CIII] was fixed in km s-1 to be the same as CIV and/or SiIV, taking into account the additional broadening because it is a doublet (1907 and 1909 Å). The error bars take into account the range of fits that are acceptable for the different constraints applied.
| Object | CIV/CIII] | CIV/HeII | CIII]/HeII | NV/CIV | NV/HeII | NIII]/CIII] | NIV]/CIV |
|---|---|---|---|---|---|---|---|
| J0006+1215 | 1.8 | 3.40.5 | 1.9 | 2.00.2 | 7.01.0 | N/A | 0.46 |
| J0209+3122 | 1.50.3 | 3.3 | 2.3 | 1.20.1 | 3.9 | 0.77 | 0.26 |
| J0805+4541 | 1.70.3 | 2.8 | 1.6 | 1.80.2 | 4.9 | 0.68 | 0.34 |
| J0826+0542 | 4.00.3 | 8.20.5 | 2.00.02 | 1.620.02 | 13.20.9 | 0.41 | 0.07 |
| J0832+1615 | 2.60.3 | 9.82.0 | 3.80.8 | 1.30.1 | 7.41.0 | 0.65 | 0.14 |
| J0913+2344 | 4.50.6 | 5.10.7 | 1.10.2 | 1.350.05 | 6.90.9 | 0.86 | 0.15 |
| J0932+4614 | 2.90.3 | 5.60.7 | 2.20.3 | 1.20.2 | 6.1 | 0.54 | 0.16 |
| J0958+5000 | 2.30.2 | 11.31.1 | 4.90.6 | 0.80.1 | 8.81.7 | 0.17 | 0.06 |
| J1013+3427 | 2.30.3 | 5.00.8 | 2.20.5 | 0.920.06 | 4.60.8 | 0.15 | 0.07 |
| J1025+2454 | 2.80.8 | 4.9 | 1.7 | 2.50.5 | 9.5 | 0.58 | 0.19 |
| J1031+2903 | 3.50.3 | 5.3 | 1.5 | 1.760.05 | 9.3 | 0.73 | 0.17 |
| J1138+4732 | 3.90.5 | 5.20.6 | 1.40.2 | 1.750.07 | 9.21.0 | 0.86 | 0.22 |
| J1217+0234 | 6.11.2 | 6.4 | 1.0 | 1.640.05 | 10.4 | 1.1 | 0.14 |
| J1356+0730 | 3.10.4 | 5.2 | 1.7 | 1.910.08 | 10.0 | 0.65 | 0.19 |
| J1604+5633 | 5.10.4 | 5.0 | 1.0 | 1.90.1 | 9.7 | 1.4 | 0.20 |
| J1652+1728 | 3.60.3 | 6.80.6 | 1.90.2 | 2.140.07 | 14.51.3 | 0.18 | 0.06 |
| Object | Ly/HeII | Ly/CIV | (SiIV+OIV])/CIV | CII/CIV | OIII]1663/CIV |
|---|---|---|---|---|---|
| J0006+1215 | 7.41.4 | 2.20.3 | 0.640.05 | 0.75 | 0.29 |
| J0209+3122 | 11.2 | 3.40.2 | 0.490.06 | 0.36 | 0.30 |
| J0805+4541 | 4.6 | 1.70.2 | 0.530.07 | 0.23 | 0.36 |
| J0826+0542 | 17.50.2 | 2.140.03 | 0.460.01 | 0.10 | 0.12 |
| J0832+1615 | 7.60.2 | 1.40.1 | 0.350.04 | 0.19 | 0.18 |
| J0913+2344 | 5.80.2 | 1.120.04 | 0.380.03 | 0.19 | 0.15 |
| J0932+4614 | 33 | 6.20.5 | 0.300.03 | 0.14 | 0.19 |
| J0958+5000 | 31.30.3 | 2.80.1 | 0.190.01 | 0.04 | 0.09 |
| J1013+3427 | 21.60.7 | 4.30.3 | 0.280.02 | 0.08 | 0.21 |
| J1025+2454 | 7.2 | 1.50.5 | 0.90.07 | 0.24 | 0.21 |
| J1031+2903 | 2.0 | 0.370.05 | 0.680.03 | 0.39 | 0.20 |
| J1138+4732 | 6.30.1 | 1.200.07 | 0.450.04 | 0.27 | 0.20 |
| J1217+0234 | 9.9 | 1.550.04 | 0.380.02 | 0.10 | 0.16 |
| J1356+0730 | 3.1 | 0.590.05 | 0.550.03 | 0.24 | 0.19 |
| J1604+5633 | 4.7 | 0.950.09 | 0.610.03 | 0.12 | 0.21 |
| J1652+1728 | 6.780.09 | 1.00.04 | 0.370.02 | 0.05 | 0.15 |
Appendix B Multicomponent simultaneous spectral fit
Obtaining accurate [OIII] kinematic parameters is challenging in luminous QSO1 (see Sect. 4.4.1). To evaluate the typical uncertainties on the derived [OIII] velocities, we have reanalysed the 14 out of 19 QSO1 in Shen (2016) sample at z (as the core-ERQs) associated with good quality NIR spectra. The remaining objects could not be fitted due to the weakness or absence of the [OIII] lines in the spectra.
We used the multicomponent simultaneous fit technique, generally adopted in the literature to reduce the degeneracies between FeII, BLR and NLR emission (e.g. Brusa et al. 2015; Perna et al. 2017a, b). We fitted simultaneously the H+[OIII]+FeII complex together with the H+[NII]+[SII] system for the sources at z , and MgII+FeII+FeIII and H+[OIII]+FeII regions for the targets at higher . The best-fit results are shown in Figs. 8, 9, 10 and in Tables 2, and 5. These figures also show the comparison of the [OIII] best-fit obtained by Shen (2016) with ours (we could not do the same for Coatman et al. 2019 best fit, because [OIII] Gaussian parameters are not tabulated in their paper). The spectrum of J2238-0821 is also shown in Fig. 9. Unlike in Shen (2016), our fits indicate that NLR emission is undetected in this source (consistent with Coatman et al. 2019).
B.1 Modelling rest-frame optical spectra
The H+[NII]+[SII] and H+[OIII]+FeII systems of J0149+1501, J1421+2241, J1431+0535, J1436+6336 and J1220+0004 are redshifted in the K- and H-band, respectively. We fitted simultaneously the continuum and all emission lines to reduce the degeneracies between BLR, NLR and FeII emission. In short, we fitted a (single) power-law continuum, an optical FeII template (Kovac̆ević et al. 2010) and a combination of Gaussian functions to model BLR and NLR emission lines.
In particular, depending on the complexity of FeII emission, we considered one or two FeII templates (see e.g. Vietri et al. 2018). These are convolved with a Gaussian; the width of this Gaussian, the amplitude normalisations and velocity offset of the FeII templates are free variables in our fit (see Perna et al. 2017a for further details). Gaussian components were used to reproduce the emission lines. Specifically, we used (1) a ‘systemic’ narrow (FWHM 700 km s-1) Gaussian component for the [OIII] doublet, H, H, [NII] and [SII] doublets associated with unperturbed NLR emission; (2) a broad (FWHM2000 km s-1) Gaussian component to fit the BLR H and H emission; (3) an ‘outflow’ (FWHM 700 km s-1) Gaussian component for all forbidden and permitted emission lines to reproduce prominent and asymmetric wings associated with outflowing gas. One or more additional sets of Gaussian components were considered to reproduce more complex profiles, for instance, asymmetric BLR emission lines (see, for instance, J1421+2241, Fig. 8) and ‘extremely broad [OIII] profiles’ (for instance, J0843+0750, Fig. 9; see also Fig. 11 in Coatman et al. 2019).
For each set of Gaussian functions, we constrained the wavelength separation between emission lines within a given set of Gaussian profiles in accordance with atomic physics. This means that we constrained the velocity offset of the outflow Gaussians from the narrow (systemic) components to be the same for all the emission lines. Moreover, each emission line within a given set have the same FWHM. Finally, the relative flux of the two [N II]6548,5583 and [O III]4959,5007 components is fixed to 2.99 and the [S II] flux ratio is required to be within the range 0.44 1.42; finally, the H/H flux ratio has been constrained to be (Osterbrock 1989).
B.2 Modelling MgII, FeII, FeIII, H and [OIII]
For the remaining targets at 2.5, the H+[NII]+[SII] complex is not covered by available spectra. We therefore fitted H+[OIII]+FeII systems together with the MgII+FeII+FeIII lines. Under the assumption that the H and MgII emission from BLR have the same kinematics (e.g. Shen & Liu 2012; Bisogni et al. 2017b), as well that the optical and UV iron emission have the same width and velocity (e.g. Bisogni et al. 2017b), the simultaneous fit technique allows us to reduce, also for these spectra, the degeneracies between NLR, BLR and iron emission. We fitted the AGN continuum with two local power laws to the wavelength regions associated with the two systems (i.e., [] Å and [] Å). In addition to the optical FeII templates, we also considered one or two FeII+FeIII templates from Popović et al. (2019) to model the iron emission underlying the MgII lines. The UV and optical iron templates are constrained to have the same widths and velocity shifts. Also in this case, we considered a combination of Gaussian sets to best reproduce the BLR and NLR emission (see above).
We note that 1) the MgII2796,2803 doublet is fitted with a single Gaussian, since the lines are unresolved in all spectra: MgII emission is generally dominated by the BLR emission, which width is much higher than the separation between the two member lines. Moreover, 2) the distinction between ’systemic’ and ‘outflow’ components in our best-fit results must be taken with caution, because of the degeneracies in the fit analysis, its dependency on the quality of the spectra (in terms of SNR and resolution), and the unknown intrinsic shape of ’systemic’ and ‘outflow’ emission line profiles (e.g. Liu et al. 2013; Bae & Woo 2016).
B.2.1 Main differences with respect to Shen (2016) and Coatman et al. (2019)
Emission from the optical continuum and iron lines in Coatman et al. (2019) and Shen (2016) are modelled with a local power-law plus a FeII template from Boroson & Green (1992), using the wavelength regions just outside the H-[OIII] complex. This model is then subtracted before fitting the BLR and NLR emission. In our analysis, all possible emitting contributions are fitted simultaneously, considering the entire wavelength range covered by FeII, H and [OIII] lines. Moreover, for the sources at z , we used a unique power-law to model the continuum in the H-[OIII] and H-[NII] regions, in order to be less affected by degeneracies between strong FeII and continuum emission. Finally, we preferred to use the FeII templates by Kovac̆ević et al. (2010), which can allow a more robust separation between [OIII] and FeII emission at Å (see also e.g. Appendix A in Perna et al. 2017a).
B.3 Best-fit analysis and results
The spectral analysis was performed with a python routine using the cap-mpfit procedure (part of pPXF package by Cappellari 2017) and performing Levenberg-Marquardt least-squares minimisation between the data and the model. The best-fit results are shown in Figs. 8, 9, 10 and reported in Tables 2 and 5.
In order to estimate errors associated with our measurements, we used Monte Carlo simulations. For each modelled spectrum, we collected the fit results of 100 mock spectra obtained from the best-fit final models (red curves in Figs. 8, 9 and 10) and adding Gaussian random noise (taking as a reference the noise spectra shown with cyan curves in the figures). The errors, reported in Table 2, have been derived by taking the range that contains 68.3% of values evaluated from the obtained distributions for each Gaussian parameter/non-parametric measurement. Finally, we note that since line profiles generally are non-Gaussian and much broader than the spectral resolution, we do not correct the observed profiles for instrumental effects and report all values as measured. We also note that our estimated errors take into account (whenever possible) all systematic effects related to the (simultaneous) modelling of continuum, FeII, BLR and NLR emission. In fact, our best-fit models are obtained, for each MC trial, starting from a random initialisation of the model parameters. This allows us to model the spectrum taking into account the possible degeneracies between the different emitting components. As a consequence, the errors reported in Table 2 and 5 are up to a few orders of magnitude larger than those reported in Coatman et al. (2019), more effectively reflecting the difficulties in such kinematic analysis.
For the sources for which we could fit both H and H, together with a single power-law from to Å for the continuum, we can be quite confident about the contribution of BLR Balmer emission and the underlying continuum; all but J1220+0004 are also associated with weak FeII emission. These sources, therefore, provide the most robust kinematic measurements for the [OIII] gas. On the other hand, the sources at higher can be associated with higher systematic effects, because of the difficulties in modelling the local continuum underlying the H and MgII lines222For a proper modelling of the MgII+FeII+FeIII complex with a ‘global’ power-law continuum, a Balmer continuum emission as well as the doublet nature of the MgII should be taken into account (e.g. Mejiá-Restrepo et al. 2016; Varisco et al. 2018)., and the presence of strong iron emission (at least in the UV part). Overall, the differences in the analysis results between our work, Shen (2016) and Coatman et al. (2019) highlight the difficulties in deriving robust [OIII] kinematic measurements for very luminous type 1 QSOs.
| Object | Comp. | Amp. | ||
|---|---|---|---|---|
| cgs | km s-1 | km s-1 | ||
| J0149+1501 | 1st | |||
| 2nd | ||||
| J1421+2241 | 1st | |||
| 2nd | ||||
| J1431+0535 | 1st | |||
| 2nd | ||||
| J1436+6336 | 1st | |||
| 2nd | ||||
| J1220+0004 | 1st | |||
| 2nd | ||||
| J0250-0757 | 1st | |||
| 2nd | ||||
| J0844+0503 | 1st | |||
| 2nd | ||||
| J0942+0422 | 1st | |||
| 2nd | ||||
| 3rd | ||||
| J0304-0008 | 1st | |||
| 2nd | ||||
| 3rd | ||||
| J0843+0750 | 1st | |||
| 2nd | ||||
| J1019+0254 | 1st | |||
| 2nd | ||||
| J0259+0011 | 1st | |||
| 2nd | ||||
| J1034+0358 | 1st | |||
| 2nd |
Below we briefly comment of the best-fit results for each target.
J0149-1501: H and H are redshifted at the edges of the H- and K-band respectively, where the filter transmission is very low. As a result, the bluest part of the line profiles cannot be modelled properly. The BLR emission is reproduced with one Gaussian component. Narrow emission can be well constrained only for the [OIII] doublet, which also present very broad line wings. A prominent ‘outflow’ component is required to reproduce the profiles of all emission lines (although the strong degeneracies do not allow us to well constrain this component for the Balmer lines). Our reconstructed [OIII] profiles present more pronounced blue and red wings with respect to those in Shen (2016) and Coatman et al. (2019) , although all non-parametric velocities are consistent within 1.
J1421+2241: the BLR is modelled with two Gaussian profiles; the NLR is fitted with a ’systemic’ and an ‘outflow’ component. Both blue and red wings of the [OIII] lines are blended with FeII and H emission. The [OIII] reconstructed profile is very similar to the ones in Shen (2016) and Coatman et al. (2019).
J1431+0535: the H line is severely affected by sky-line residuals; the broad H from the BLR is strongly asymmetric. We modelled the BLR emission with two Gaussian components. Narrow emission can be well constrained only for the [OIII] doublet, which also present very broad line wings. Our reconstructed OIII profiles present more pronounced blue and red wings with respect to those in Shen (2016) and Coatman et al. (2019), although the derived non-parametric velocities are consistent within 1 with theirs.
J1436+6336: the BLR lines are modelled with two Gaussian profiles; the NLR is fitted with a ’systemic’ and an ‘outflow’ component. Both blue and red wings of the [OIII] lines are mildly blended with FeII and H. Our reconstructed [OIII] profiles present more pronounced blue and red wings with respect to those in Shen (2016) and Coatman et al. (2019), although all non-parametric velocities are consistent within 2.
J1220+0004: the H+[NII] complex is severely affected by telluric features; a significant portion of the profile is therefore masked during the spectral fitting. The BLR line profile is reconstructed on the basis of the observed H profile, with two BLR Gaussian sets and one Lorentzian profile. The NLR emission is fitted with a ’systemic’ component plus two very broad ‘outflow’ Gaussians. Two FeII templates are also required to reproduce the H+[OIII]+FeII complex. Our reconstructed [OIII] profiles present more pronounced blue and red wings with respect to those in Shen (2016) and Coatman et al. (2019). Under the assumption that H and H have very similar profiles, the flux excess around Å cannot be associated with a H red wing, because of the absence of a similar feature in H. On the other hand, FeII templates are not capable to reproduce the broad emission close to the [OIII] doublet. These arguments allow us to prefer a best-fit with very broad [OIII] lines. We note however that strong degeneracies could be still present in our fit, and that systematic errors could be significant for this target.
J2238-0921: this target shows very complex profiles in the H+[OIII]+FeII and MgII+FeII+FeIII regions. We fit the MgII and H BLR emission with two Gaussian components. The iron emission is modelled with two templates. In the optical region, to reproduce the strong peak at Å we include in the fit the FeIII and FeIV emission lines at 5270 and 5236Å (but a strong degeneracy between these lines and FeII features is present at these wavelengths). No NLR emission associated with [OIII] is detected for this source, consistent with (Coatman et al., 2019, see the detailed discussion in their paper) and at odds with Shen (2016). This source can be considered as a ‘weak [OIII]’ QSO1, with a CIV line blue-shift of 5500 km -1 and REW 10 Å (see Vietri et al. 2018).
J0250-0757: the BLR emission can be well reproduced with a single Gaussian profile; [OIII] is modelled with two Gaussians; kinematic results are consistent with Shen (2016) and Coatman et al. (2019).
J0844-0503: the [OIII] profiles have similar characteristics to the core-ERQs. We modelled the H and MgII BLR emission with a single Gaussian; the NRL emission is fitted with two very broad ‘outflow’ Gaussians. Our reconstructed [OIII] profiles present more pronounced blue and red wings with respect to those in Shen (2016) and Coatman et al. (2019).
J0942-0422: the BLR emission can be well reproduced with a single Gaussian profile; the [OIII] is modelled with three Gaussians. Our reconstructed [OIII] profiles present more pronounced red wings with respect to those in Shen (2016) and Coatman et al. (2019).
J0304-0008: the BLR emission can be well reproduced with a single Gaussian profile; the [OIII] is modelled with three Gaussians. Our reconstructed [OIII] profiles present more pronounced wings with respect to those in Shen (2016), consistent with Coatman et al. (2019).
J0843+0750: the BLR emission can be well reproduced with a single Gaussian profile; the [OIII] is modelled with two Gaussians. Our reconstructed [OIII] profiles present more pronounced red wings with respect to those in Shen (2016), consistent with Coatman et al. (2019).
J1019+0254: the BLR emission can be well reproduced with a single Gaussian profile; the [OIII] is modelled with two Gaussians. Our reconstructed [OIII] profiles present more pronounced wings with respect to those in Shen (2016), consistent with Coatman et al. (2019)
J0259+0011: the BLR emission can be well reproduced with a single Gaussian profile; the [OIII] is modelled with two Gaussians. Our reconstructed [OIII] profiles present more pronounced wings with respect to those in Shen (2016), consistent with Coatman et al. (2019)
J1034+0358: the BLR emission can be well reproduced with a single Gaussian profile; the [OIII] is modelled with two Gaussians. Our reconstructed [OIII] profiles present more pronounced wings with respect to those in Shen (2016) and Coatman et al. (2019).