Polysiloxane-based scintillators for shashlik calorimeters
Abstract
We present the first application of polysiloxane-based scintillators as active medium in a shashlik sampling calorimeter. These results were obtained from a testbeam campaign of a cm3 (13 depth) prototype. A Wavelength Shifting fiber array of 36 elements runs perpendicularly to the stack of iron (15 mm) and polysiloxane scintillator (15 mm) tiles with a density of about one over cm2. Unlike shashlik calorimeters based on plastic organic scintillators, here fibers are optically matched with the scintillator without any intermediate air gap. The prototype features a compact light readout based on Silicon Photo-Multipliers embedded in the bulk of the detector. The detector was tested with electrons, pions and muons with energies ranging from 1 to 7 GeV at the CERN-PS. This solution offers a highly radiation hard detector to instrument the decay region of a neutrino beam, providing an event-by-event measurement of high-angle decay products associated with neutrino production (ENUBET, Enhanced NeUtrino BEams from kaon Tagging, ERC project). The results in terms of light yield, uniformity and energy resolution, are compared to a similar calorimeter built with ordinary plastic scintillators.
keywords:
Polysiloxane , Scintillator , Shashlik calorimeter , Silicon PhotoMultipliers1 Introduction
Shashlik calorimeters [1, 2] have been used since more than 20 years in particle physics [3, 4, 5, 6, 7, 8]. These devices are sampling calorimeters in which the scintillation light is readout by WaveLength Shifting (WLS) fibers running perpendicularly to the stack of absorber and scintillator and hosted in holes through these elements.
These calorimeters have been considered in the context of the ENUBET [9, 10, 11, 12] project, where they could be employed to monitor positron production in the decay tunnel of conventional neutrino beams. Thanks to their robustness and good performance/cost ratio they could be effectively used over large surfaces to perform a precise measurement of the flux originating from kaon decays () [9]. For this application, a longitudinal segmentation of about 4 is needed to separate positrons from charged pions with a misidentification probability below 3% [13]. The most cost-effective solution exploits a transverse modularity of 33 cm2 tiles. Since 2016, the ENUBET Collaboration has carried on an extensive experimental campaign of tests at the CERN-PS beamlines employing prototypes with standard plastic organic scintillators. In this context, the possibility of employing polysiloxane based scintillators instead of plastic scintillators is extremely appealing. This choice would ease the fabrication of the scintillators, allow a perfect optical match between the fibers and the scintillators, and ensure enhanced radiation hardness for the ENUBET application, where doses up to fractions of kGy are expected.
After a brief overview on the state of the art on polysiloxane scintillators (Sec.2) and compact shashlik calorimeters with standard plastic scintillator (Sec.3), we make a comparison between the light yield of polysiloxane and plastic scintillator using an Am source (Sec. 4). In Sec. 5 we present the results of a simulation on light collection efficiency for polysiloxane or plastic shashlik configurations. In Sec. 6 we describe the construction of the polysiloxane-based shashlik calorimeter (6.1) and of a reference traditional shashlik calorimeter based on plastic scintillators (6.2). The results of the particle exposure at the CERN-PS T9 beamline are described in Secs. 6.3 and 7. Conclusions and future opportunities are summarized in Sec. 8.
2 Polysiloxane scintillators
Polysiloxane polymers (also known as silicones) are composed by a main backbone, formed by Si and O atoms, regularly alternated, and by organic substituents, attached to the silicon atoms of the main chain. Polysiloxane mechanical properties are typical of elastomeric materials and arise from the high degree of flexibility of the Si-O-Si bridge, thus siloxanes have enhanced deformability and elongation at rupture [14].
On the other hand, this bond has enhanced strength with respect to C-O and C-C bond and this partially accounts for remarkably high radiation resistance [15, 16] as compared to common organic polymers traditionally used for plastic scintillators (i.e. PolyVinylToluene, PolyStyrene). In standard plastic scintillators, transparency losses (yellowing) are due to the production of free radicals from the breaking of C-H or C-C bonds by irradiation and further recombination to produce double bonds, acting as absorbing centers. The stronger Si-O bond preserves transparency up to much higher doses. Radiation hardness is further increased by the presence of phenyl side groups absorbing part of the radiation energy thanks to the electrons in the aromatic ring, thus reducing the damages along the polymeric chain [15, 17, 18].
Suitable dyes to achieve scintillation light from incoming particles are dissolved in the precursor siloxane resin, then the cross-linking reaction is carried out using Pt-based catalyst [19]. Thanks to their viscous nature polysiloxane scintillators can be simply poured in liquid tight containers and allowed to cross-link at moderate temperatures finally leading to a solid, though soft and rubbery, material.
2.1 Previous R&D on polysiloxane scintillators
The development of polysiloxane scintillators began by Bowen et al. [15, 20]. They report no yellowing with doses up to 100 kGy and light outputs ranging from less than 5% to 90% of a commercial reference sample (BC-408). The same group performed an extensive series of studies on the radiation hardness of polysiloxane scintillators doped with different types of primary dye, [21, 23], secondary dyes [22] and different phenyl concentrations [24]. More than ten years later, Bell et al. exploited polysiloxane scintillators for thermal neutron detection, through the loading with B or Gd [25, 26]. More recently a detailed analysis was performed focusing on the optimization of the scintillation performances, by varying the composition and concentration of the mixture and matrix [17, 18, 27]; on the performances for thermal neutron detection with the addition of o-carboranes at different concentrations [28] and 6LiF nanoparticles [35] and for fast neutron detection with the Time-Of-Flight technique [19]. Very recently, the possibility to discriminate fast neutrons from s on the basis of different light pulse shapes has been demonstrated [30].
3 Shashlik calorimeters with embedded light readout
Recent developments in the technology of silicon-based photosensors have allowed new solutions for light collection and readout [36, 37, 38, 39] and a broader range of applications is at hand for shashlik detectors [11, 40]. The INFN SCENTT Collaboration has developed an ultra-compact module (UCM) where every single fiber segment is directly connected to a Silicon PhotoMultiplier (SiPM) thus avoiding dead regions due to fiber bundling with a net improvement in the homogeneity of the longitudinal sampling. An extensive experimental campaign ([42, 43, 44, 45]) at the CERN-PS has followed within the ENUBET Collaboration. The UCM concept has also been adopted for the polysiloxane based shashlik calorimeter described in this work.
4 Light yield of polysiloxane with radioactive sources
The relative light yields of polysiloxane and standard plastic scintillators have been characterized in the past [19] using emitters. The measured light yield was found to be typically lower in Polysiloxane scintillators by a factor of about two with respect to Eljen plastic scintillators EJ-212 or EJ-200 (Eljen [29]).
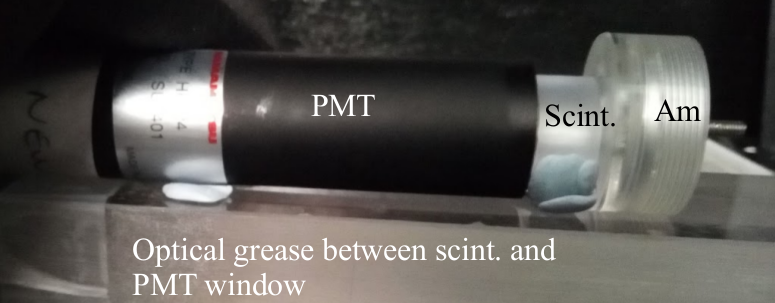

The light yield of our samples of polysiloxane-based scintillators has been compared to that of a classic plastic scintillator by exposing them to an Am source111Am decays mainly by emission - 5.486 MeV - and a - 54 keV.. The source (Fig. 1 left) was put in contact with cylindrical samples of 1 cm thickness and 2.35 cm diameter made with polysiloxane or plastic scintillator (surface polished EJ-200). The other side of the cylinder, i.e. the flatter surface corresponding to the base of the container were the polysiloxane cylinder was poured, was put in contact with a Hamamatsu 2.35 cm diameter photomultiplier (mod. H6524) with a thin optical grease layer in between to improve the light transmission. The samples were wrapped to maximize the light output in two ways: 1) with a reflective thin Mylar foil on the source side and Teflon tape for the cylinder side or 2) using the same Mylar layer for all surfaces. The PMT signals were amplified and shaped before being acquired by a multi-channel analyzer. The measured spectra are shown in Fig. 1 (right) for the polysiloxane (thick red) and the Eljen plastic scintillator (thin black) with the two scintillator wrapping options (1) - dashed - and (2) - dotted. Mylar (2) gives a better light yield in both cases with a relative increase of about 20% with respect to the other wrapping option. The ratio of the light yields of Eljen and polysiloxane, estimated from the ratio of the peaks positions in ADC counts (Fig. 1 right), is between 2.2 and 2.4 thus roughly confirming results from the literature.
5 Optical simulation
The polysiloxane reticulates around the fibers leaving no air gap between them. This causes a significant difference in the collection and transmission of photons. We consider here the setup of Sec. 6 in which the polysiloxane is coupled to Kuraray [46] Y11 WLS fibers while the standard option employs the EJ-204 [29] plastic scintillator and Saint-Gobain [47] BCF92 WLS fiber. The conclusions are anyway not critically dependent on the choice of the WLS fiber or the scintillator but rather driven by the presence or absence of the air gap. The absence of the air layer allows a better collection of photons since the critical angle for a total reflection of photons exiting the plastic scintillator ( for EJ-204) towards the air gap () is about 39∘ while it is about 70∘ degrees when passing directly from the Polysiloxane () to the outer cladding of the Y11 fibers (). In terms of solid angles () this corresponds to a gain of about a factor three. On the other hand the fiber itself loses trapping efficiency since all the rays reaching the outer cladding layer pass to the scintillator that has a higher refraction index.

The interplay of the two effects was estimated using a GEANT4 [32, 33, 34] simulation of the multi-clad Y11 fibers with an isotropic source of optical photons. The source was moved radially from the center of the fiber and the number of collected photons was measured in a configuration with a 0.05 mm air gap or no gap. Figure 2 (left) shows the collection efficiency as a function of the distance of the source from the fiber in the presence of an air gap (dashed black) and without an air gap (solid red). The ratio of the two curves (Y11+Polysiloxane / BCF92 + air gap + EJ204) is shown in the plot on the right. It is clear that photons generated inside the fiber are more likely to return to the scintillator (-60%) in the absence of an air gap and that, on the contrary, when emitted in the scintillator they have a larger chance of making their way up to the WLS fiber end (about +40% when averaging over a distance of 5 mm i.e. half the fiber spacing). An overall enhancement of 40% in the light yield is expected in the polysiloxane configuration after normalizing for other effects (i.e. the intrinsic scintillation light yields). This result is compatible with considering a rough factor three in collection according to the considerations described above and the 60% reduction in trapping efficiency of the WLS fiber given by the simulation.
6 Layout and construction of the calorimeter prototypes
Before building the 13 thick calorimeter used for this work, several smaller prototypes were tested in 2016-17 at the CERN-PS, on the scale of a single UCM (33 cm2 with a 4.3 depth). The results of these pilot tests allowed tuning the scintillator thickness and the production techniques. This prototype will be henceforth denoted as “POLY” (Sec. 6.1) while we will denote with “PLAS” the reference calorimeter composed of plastic scintillators (Sec. 6.2).
6.1 Preparation of the polysiloxane prototype
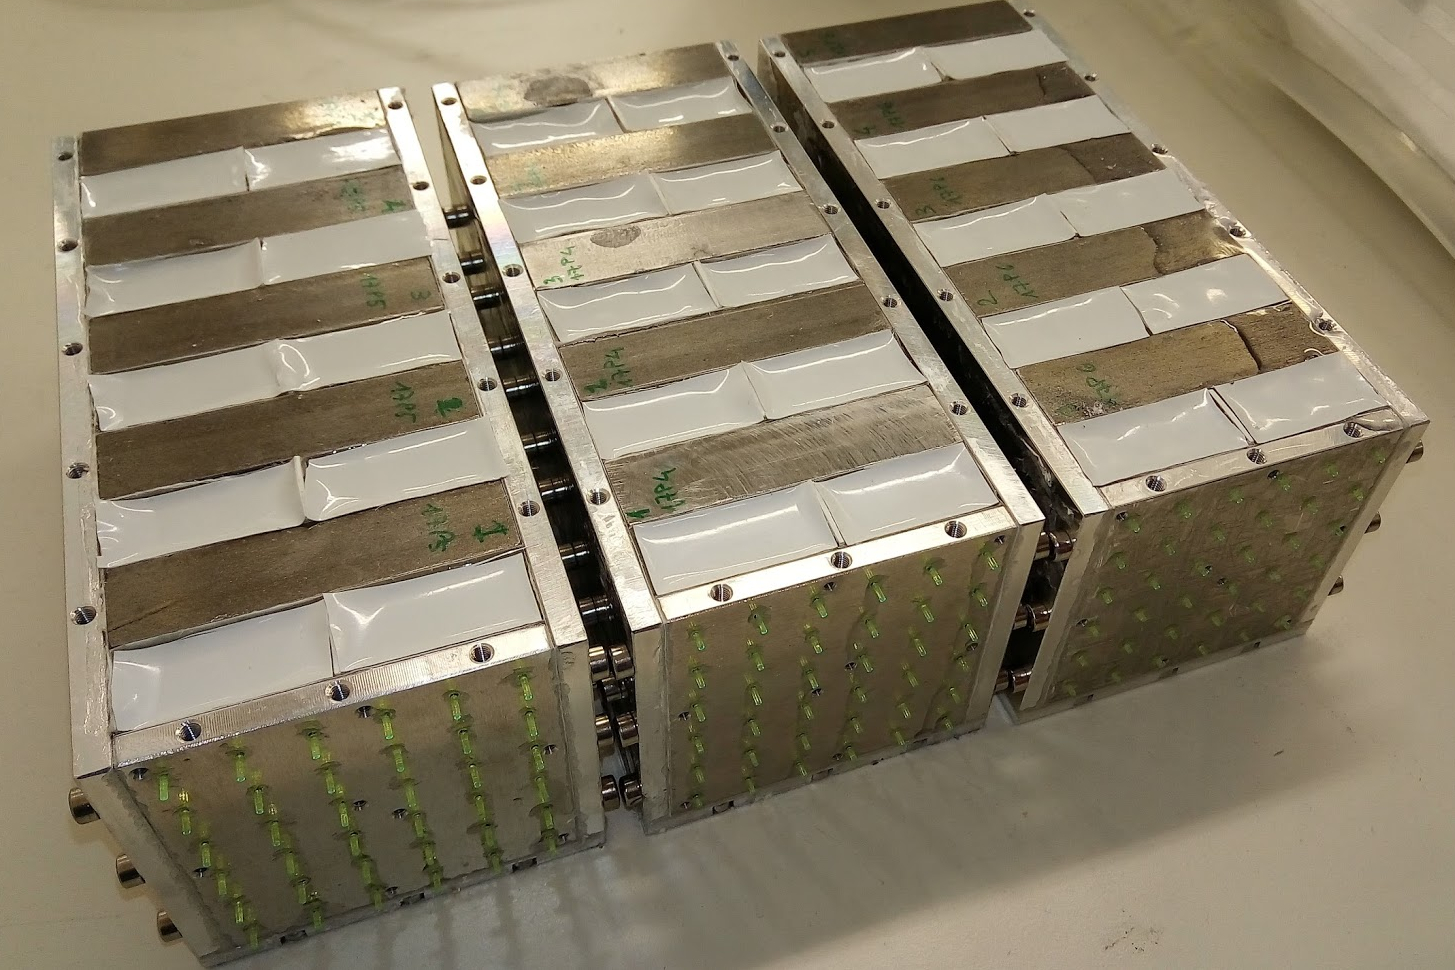
Each of the three modules composing the POLY calorimeter (Fig. 3 left) consists of 4 UCMs: 22 in the plane perpendicular to the beam, with a transverse size of 33 cm2 each. The calorimeter is then composed by 12 UCM (223) with iron and scintillator layers 1.5 cm thick. The light produced in the scintillator is read out by 9 WLS fibers/UCM (diameter: 1 mm, length: 15 cm) and each UCM is composed by five tiles: it thus samples 4.3 along the development of the shower and 1.7 Molière radii in the transverse plane. Transversally the iron slabs are 66 cm2 wide. The slabs were drilled with a CNC machine: the distance between holes is 1 cm and the diameter of the holes is 1.2 0.2 mm. The absorbers were hosted inside a liquid-tight 5 mm thick aluminum structure to which they were fixed with bolts. A Tyvek® foil was glued to the absorber sides facing the scintillator and the inner sides of the Al container, using a cyanoacrylate resin. Holes in Tyvek were made with a hot needle by using the pattern of holes in the absorber as a guide, after they had been fixed on the absorbers’ surfaces.
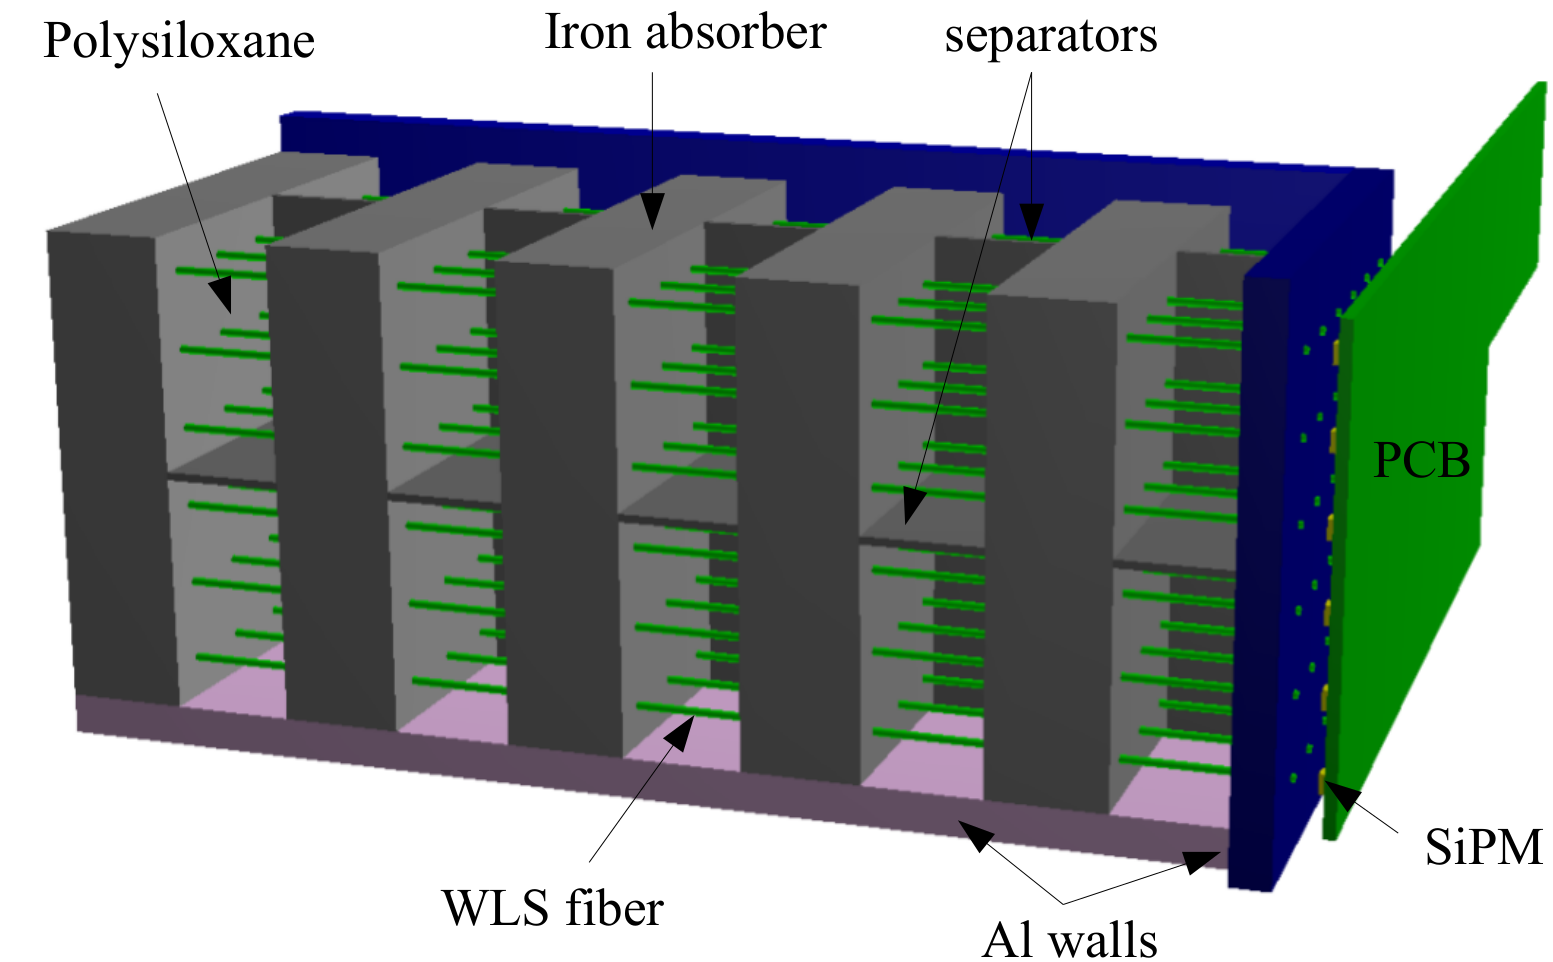
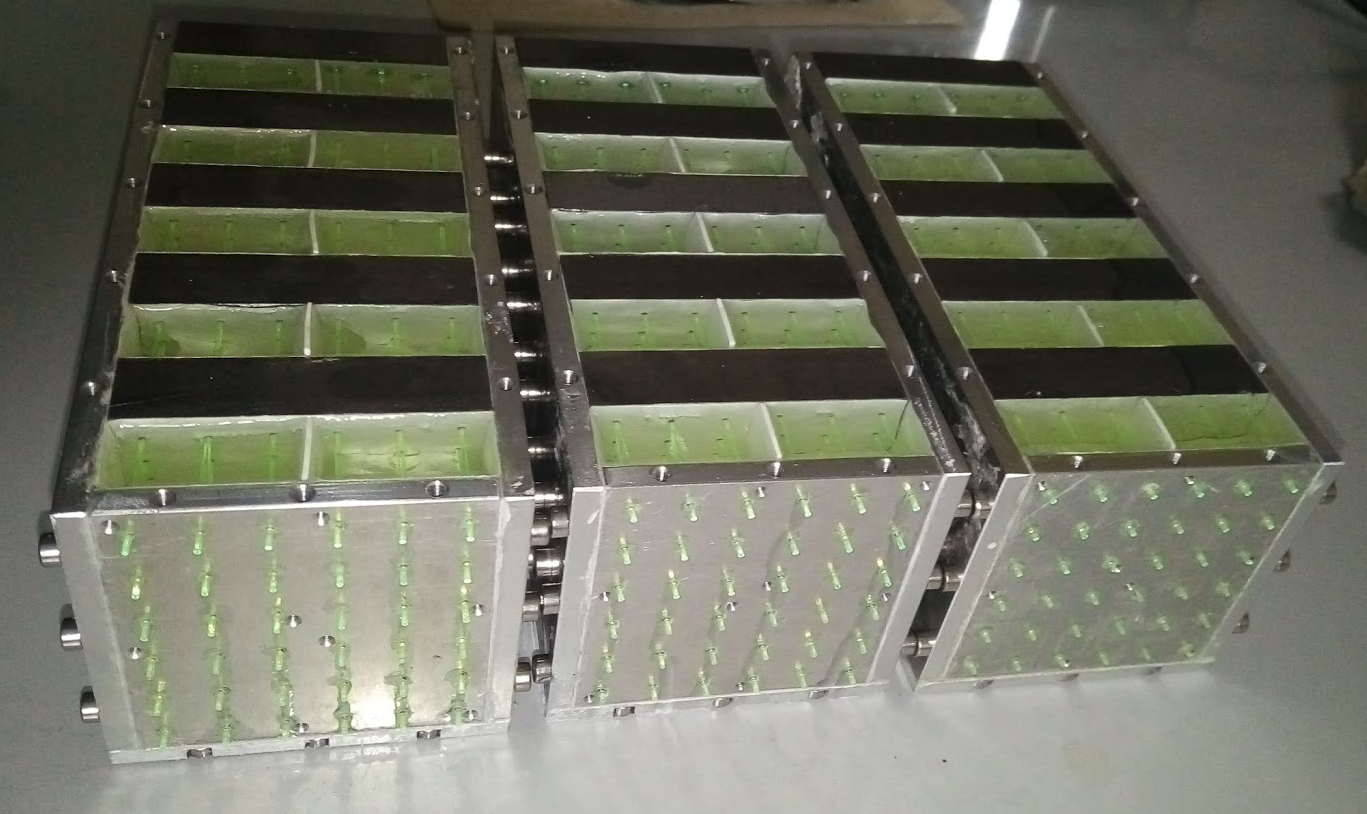
The optical separation between the 4 UCM in each module was achieved by inserting a cross-shaped white polystyrene septum with 1.5 cm depth and 1 mm thickness. No Tyvek or TiO painting was hence applied to the separator. A pair of 1 mm diameter holes was cast in the separator in the middle of each UCM to allow the flow of liquid polysiloxane from the top to the bottom pair during the pouring phase.
The fibers used are Kuraray Y11 multi-clad with a 1 mm diameter. The WLS fibers were polished with fine sand paper foils on a rotating polisher and an Al mirror was placed on the side opposite to the SiPM and attached to the WLS polystyrene using a cyanoacrylate resin (visible in Fig. 4 left).
Since the WLS fibers could move longitudinally before the reticulation of polysiloxane, particular care had to be put into equalizing the WLS longitudinal position at the SiPM side to keep them as planar as possible.
The polysiloxane mixture we used contains vinyl terminated polymethyl-phenyl siloxane as precursor, which is cross-linked with a Si-H containing resin and a suitable amount of Pt-based catalyst. Additives to achieve good light output, meanwhile preserving transparency, are 2.5-diphenyl oxazole (PPO, Sigma Adrich) and Lumoen Violet (LV, Basf), added in 1% and 0.02% respectively. This composition allows to obtain the best performance as for light output, as shown in Refs. [31, 27]. The viscous resin was degassed in vacuum (0.1 mbar) and then poured with a syringe. The prototype was put into an oven at a temperature of 60∘C for 24 hours.
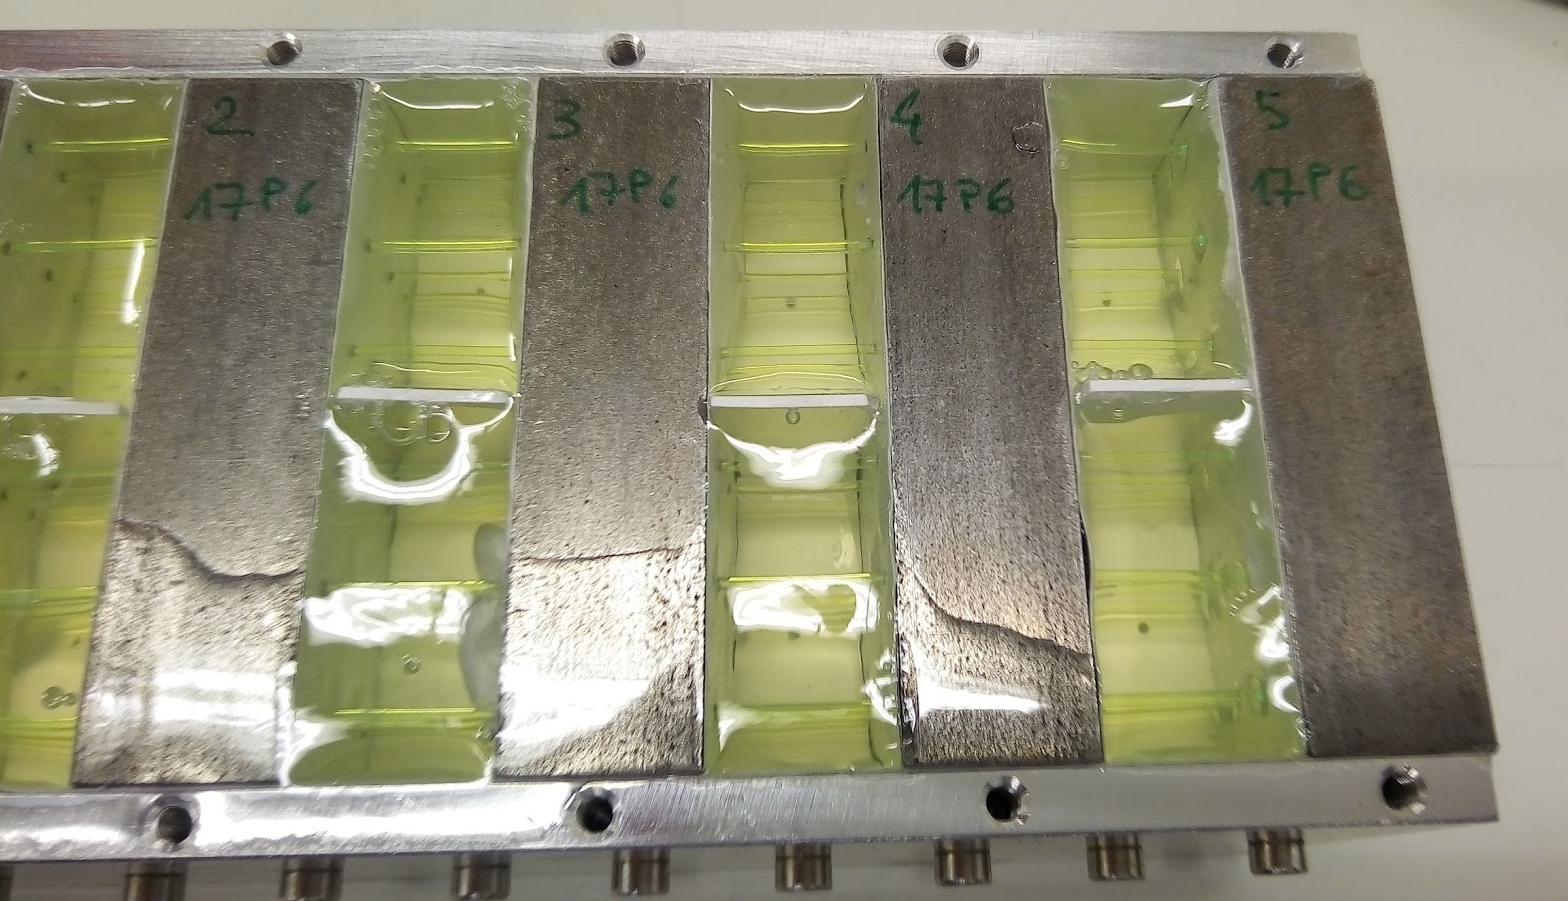
In spite of outgassing, the occurrence of bubbles could not be fully avoided, since the pouring procedure through the syringe causes air trapping. During reticulation, bubbles migrate towards the top of the polysiloxane layer and remain trapped therein, as visible in Fig. 4 left. Moreover, the formation of discontinuity planes inside the scintillator where light gets totally reflected was also observed, probably resulting from mechanical stresses in the cooling phase. An example is visible again in Fig. 4, left, in the second scintillator from left, bottom row. Since the top surface of the polysiloxane is not perfectly planar after reticulation (Fig. 4 left), it was covered with a white diffusive tape which followed the curvature of the surface and minimizes light losses (Fig. 4 right).
The array of SiPMs reading the UCM is hosted on a PCB (Printed Circuit Board) holder that integrates both the passive components and the signal routing toward the front-end electronics. This scheme combines the compactness of SiPM-based calorimeters [41] with the flexibility offered by the shashlik technology in choosing the longitudinal sampling (length of the fiber crossing the scintillator/absorber tiles) and transverse granularity (tile size, number of fibers per unit surface and number of summed SiPM channels).
The coupling of the WLS fibers to the SiPM matrix embedded in the PCB is shown in Fig. 5. In a first version of the calorimeter the WLS fibers were cut 7 mm above the downstream aluminum face. In this way it was possible to check the good contact between the WLS and the SiPM by visual inspection. The alignment of the fibers and SiPM was ensured by 7 screws connecting the PCB and the aluminum layer. Due to mechanical stresses though we noted a slight bending of the WLS fibers. The bending introduces a visible lateral displacement between the SiPM and the fibers. In a later version of the prototype the most upstream module was improved and the fibers brought to the same level of the aluminum (Sec. 7.4).
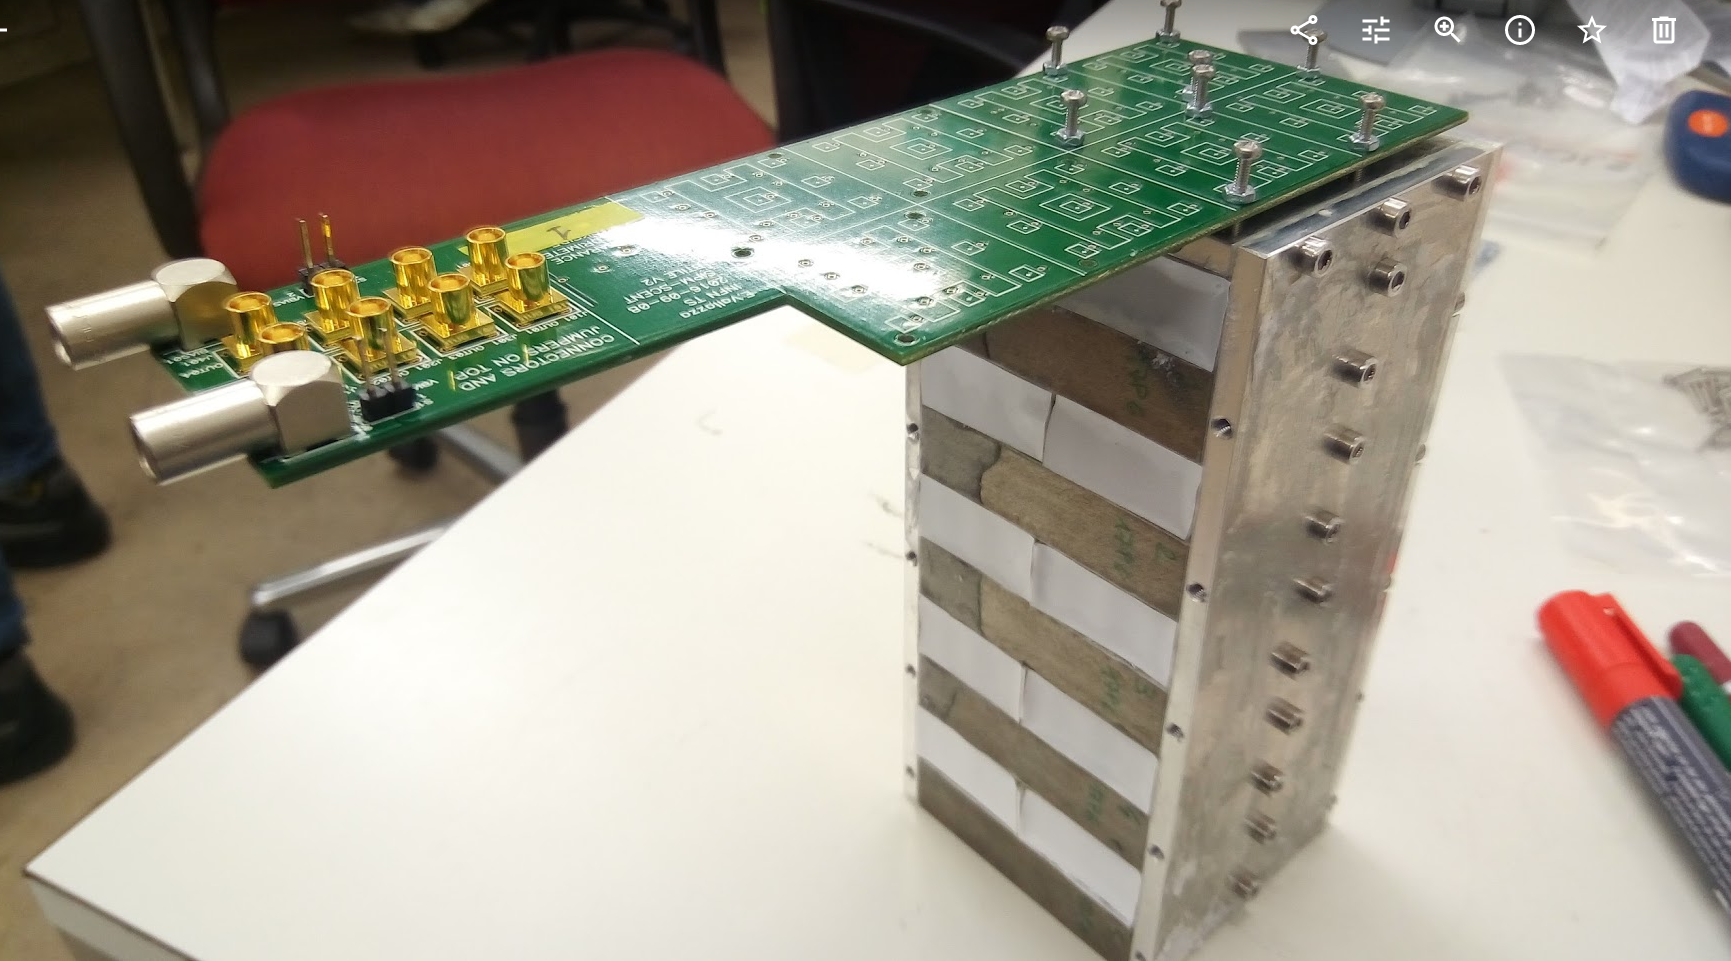
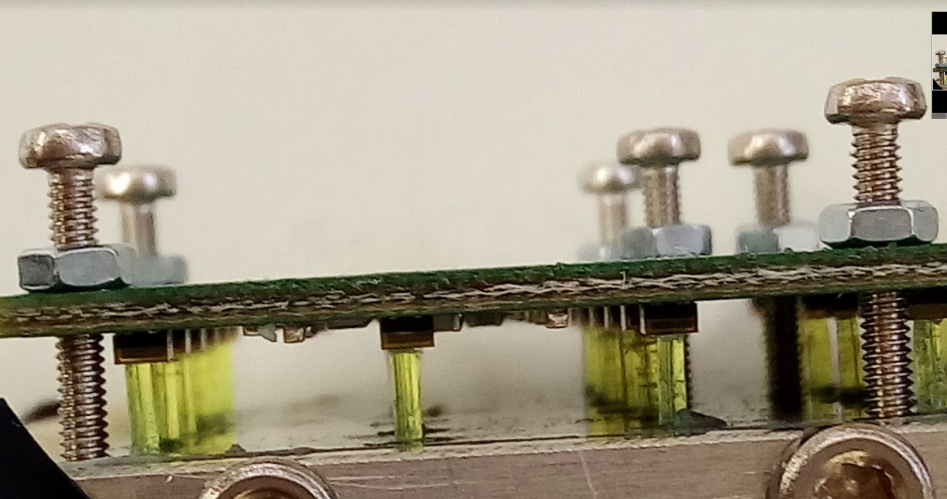
The light transmitted by the fibers is read by 1 mm2 SiPMs with 20 m cell size. The sensors are developed by FBK [48] and are based on the -on- RGB-HD technology. Each SiPM hosts 2500 cells in a 1 mm2 square with a fill factor of 66% [49]. Each module, corresponding to 4 UCMs, requires 94 = 36 SiPMs. The calorimeter (3 modules) hence hosts 108 SiPMs. These SiPMs were produced by FBK from a single wafer and encapsulated in a chip-scale epoxy package (SMD package) by Advansid s.r.l. [50]. The epoxy layer between the silicon layer and the WLS has a thickness of 200 m. The - response was characterized at the production site. Since all SiPMs of the calorimeter were produced starting from the same silicon wafer and in a single lot, the breakdown voltage is very uniform among the sensors: 28.2 0.1 V. The SiPMs are mounted as standard SMD components on a custom 6-layer PCB hosting all the sensors belonging to the same module.
The SiPMs belonging to the same UCM are connected in parallel and read out without amplification through a 47 pF decoupling capacitor. The PCB is equipped with a flap hosting 8 MCX connectors to read the signal of the UCMs. In the PCBs used for the calorimeter the bias is the same for all SiPMs and it is distributed by a coaxial cable. Each PCB hosts 72 SiPM so only half were biased and used for this measurement.
6.2 The reference calorimeter with standard scintillators
The shashlik calorimeter with plastic scintillators used for benchmarking (PLAS) is shown in Fig. 6. The scintillator tiles (33 cm2, thickness 0.5 cm) were machined and polished using EJ-204 plastic scintillator sheets. Each layer is composed of a pair of such tiles for a total thickness of 1 cm. Holes were drilled (up to 4 tiles per stack) with a 1 cm pace and a mm diameter using a CNC machine with controlled rotation speed to prevent distortions caused by heating. Tyvek foils were used in between the scintillator and the absorber layers while all lateral sides were covered with a Mylar reflective foil before wrapping the stack with black tape.

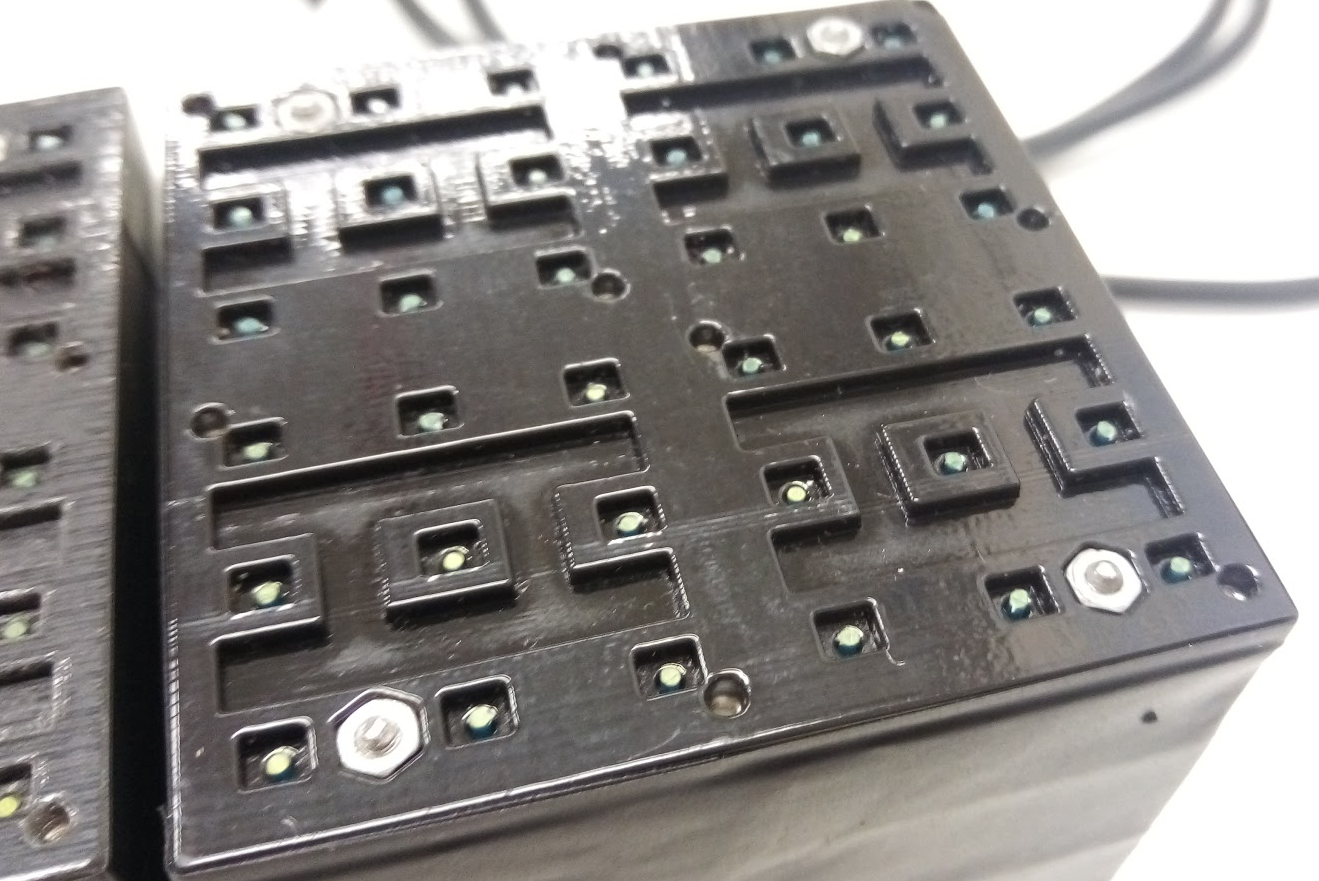
The 1 mm diameter WLS fibers (Saint Gobain BCF92 multi-clad) cross the modules through the holes up to the last scintillator plane and are connected to a 3D printed plastic mask located downstream of the module, as shown in Fig. 6, right. The plastic mask is grooved in order to fix the fibers in the back of the module and couple them with the PCB hosting the same SiPMs used for the POLY calorimeter. Four threaded bolts (2 mm diameter) cross the module and are fixed to the plastic mask by nuts positioned into the mask itself. BCF-92 fibers offer a fast response (2.7 ns) compared with Y11 (10 ns). The SiPMs are aligned to the fibers in the transverse plane with a precision of 0.1 mm via the mechanical coupling of the PCB with the plastic mask.
This calorimeter too is composed by 12 UCM (223) for a total thickness of about 13 . A summary of the parameters of POLY and PLAS is given in Tab. 1.
| prototype | scint. thick. (mm) | abs. thick (mm) | scint. | WLS |
|---|---|---|---|---|
| POLY | 15 | 15 | polysiloxane | Y11 |
| PLAS | 10 | 15 | EJ204 | BCF92 |
We have evaluated the integral of the product of the scintillation light spectrum and the spectral absorption profile of the fibers for the two setups, and they do not differ by more than 5% (see Fig. 7).

6.3 Test setup in the PS-T9 beamline
The calorimeters were exposed to electrons, muons and pions at the CERN PS East Area facility for two weeks in October 2017 and May 2018. The momentum of the particles was varied between 0.5 and 7 GeV. The detector was positioned inside an aluminum box to ensure light tightness and mounted on a platform in the T9 experimental area in front of two silicon strip detectors. The silicon detectors [52, 53] provide track reconstruction with a spatial resolution of 30 m. A pair of threshold Cherenkov counters filled with CO2 are located upstream of the silicon detectors. The maximum operation pressure of the counters is 2.5 bar: they were thus used to separate electrons from heavier particles ( or ) below 3 GeV and the muon/pion separation was obtained using a muon catcher located downstream of the calorimeter. Between 3 and 5 GeV the two counters were operated at different pressures to identify electrons, muons and pions. A 1010 cm2 plastic scintillator located between the silicon and Cherenkov detectors is employed as trigger for the DAQ. Particles in the beamline are produced from the interaction of the primary 24 GeV/c protons of the CERN-PS accelerator with a fixed target. During the test, we employed the T9 “electron enriched” target. It consists of an aluminum tungsten target (3 5100 cm2) followed by a tungsten cylinder (diameter: 10 cm, length: 3 cm). We set the collimators in order to provide a momentum bite of 1%. At 3 GeV the beam composition as measured by the Cherenkov counters is 9% electrons, 14% muons and 77% hadrons. We only selected negative particles in the beamline and the contamination of protons and kaons is thus negligible. During the testbeam all the SiPMs were biased with different voltages ranging from 32 to 38 V. The response of different UCMs was equalized offline using minimum ionizing particle signals as a reference. The signals from the UCM are recorded by a set of 8 channel v1720 CAEN [51] digitizers (12 bit, 250 MS/s, 2 V range). Additional details on the setup and the DAQ can be found in [44].
7 Results from the CERN beam exposure and with cosmic rays
We present results in terms of particle identification (Sec. 7.1), energy resolution, linearity (Sec. 7.2) and spatial uniformity (efficiency maps, Sec. 7.3). We have also measured the light yield in terms of photo-electrons per minimum ionizing particle (mip) with an improved optical matching between the WLS and SiPMs (Sec. 7.4).
7.1 Particle identification
Figure 8 shows the distribution of the pulse heights for POLY (solid) and PLAS (dashed) at a SiPM voltage bias of 36 V for different particle populations (thicker red line for , medium thick blue for and thinner green for ) as selected using the Cherenkov counters and the muon catcher. All distributions are unit normalized. For this result and the following, only events with a single cluster in both silicon chambers were selected.


Left and right distributions refer to a beam energy of 2 and 3 GeV respectively. Only particles hitting the calorimeter in a squared fiducial volume of 33 cm2 centered in the calorimeter were selected to avoid lateral leakage.
For this comparison the pulse heights of PLAS have been scaled down by a constant factor of 0.40 and 0.39 for 2 and 3 GeV data respectively. In spite of a 2.5 smaller signal, the polysiloxane separation performance is very similar to the one obtained with the standard calorimeter.
The signal pulse height results from the number of scintillation photons (proportional to the scintillator thickness, , and the intrinsic light yield, ), the efficiency of the WLS-scintillator collection () and the quality of the coupling between the WLS and the SiPM ().
| (1) |
In the prototypes under test (15 vs 10 mm) and (Sec. 5). The source measurements provide (Sec. 4). Hence:
| (2) |
We ascribe the difference mostly to the SiPM-fiber coupling (Fig.5 and 6), which was significantly poorer in POLY than PLAS and has been improved at a later time (see Sec. 7.4).
7.2 Energy resolution and linearity
The plot of Fig. 9 (left) shows the dependence of the position of the electron peak in ADC counts222An ADC count corresponds to a value of 0.488 mV. (red histograms of Fig. 8) as a function of the beam energy for different bias voltages. Linear fits are superimposed showing a good linearity with an indication for a deviation at energies above 4 GeV.


In Fig. 9 (right) the energy resolution, , with being the standard deviation and E the mean value of the Gaussian fits of the pulse height distributions, is shown as a function of beam energy for different choices of the bias voltage. The results show no significant dependence on the bias voltage. Data are well described by a parametrization of the form as expected from the sampling fraction and geometry of the calorimeter. The same parametrization also describes the energy resolution obtained with PLAS (Fig. 9 right, hollow round markers). Hence, the energy resolution of both POLY and PLAS are dominated by the sampling term [54] more than the collected photon statistics.
7.3 Efficiency maps
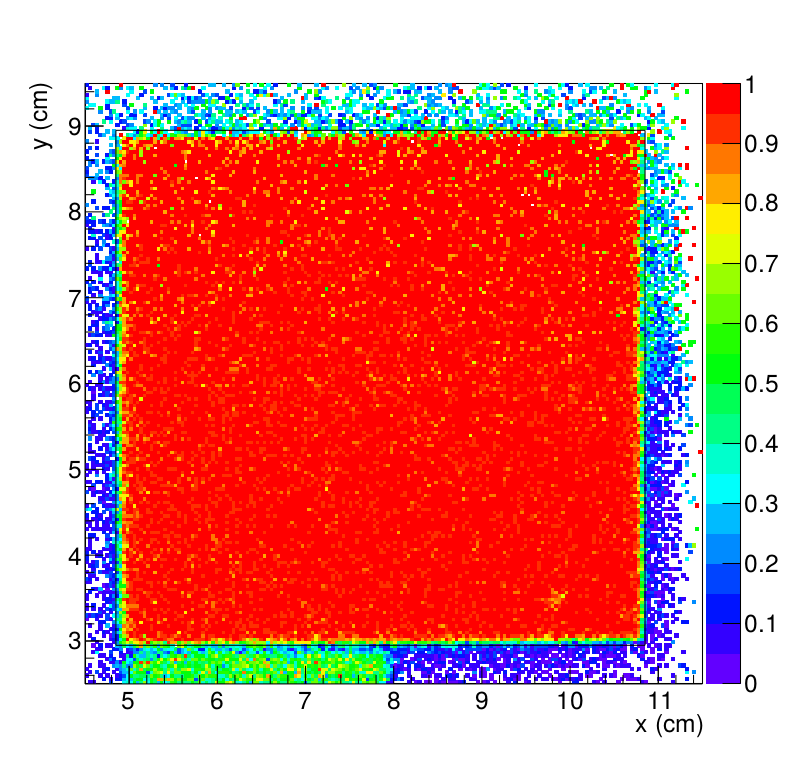
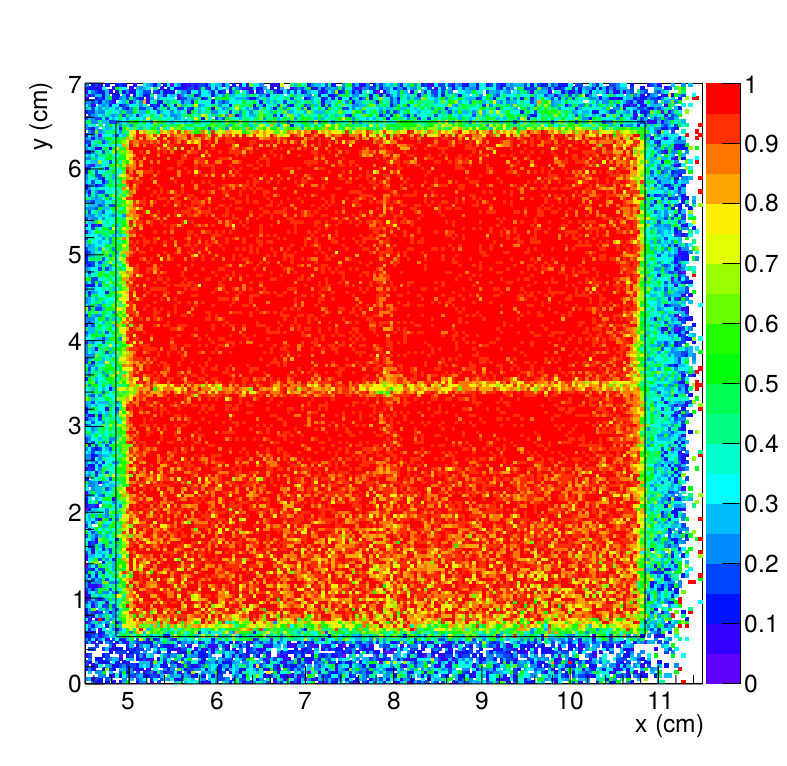
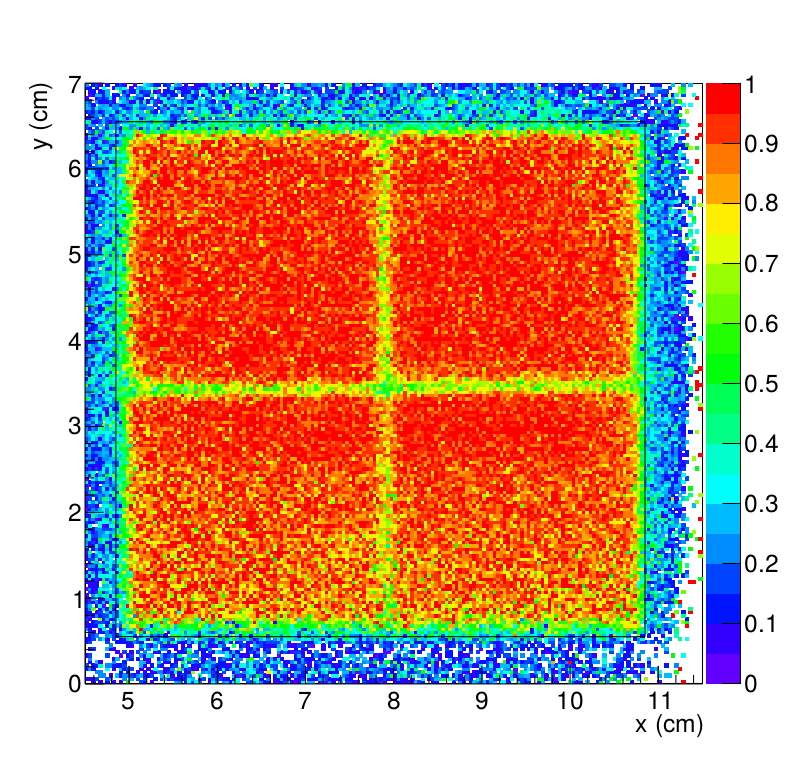
Efficiency maps are obtained by taking the ratio between the - 2D distribution of the impact point on the upstream face of the calorimeter for events with a pulse height333Taken as the sum over the four upstream UCMs. above a certain threshold (“efficient response”) and the same distribution for all events. No particle identification information was used. The SiPM were biased at 36 V for both calorimeters. Results are shown in Fig. 10 for a threshold of 20 ADC counts444Corresponding to and to of the mip signal in POLY and in PLAS respectively (see Fig. 8). for PLAS (left) and POLY (right). The pattern of the cm2 front face of the calorimeters is clearly visible. Points with lower efficiency located outside of the calorimeter face (black square) originate from events occurring in the dead material and contributing with some energy release in the calorimeter. For POLY the effect is larger due to the presence of the aluminum container while PLAS was just wrapped in black tape. The pattern at low and low for PLAS is given by the presence of another smaller calorimeter which was positioned in contact with PLAS. The central white plastic cross used to create the four optically independent compartments in the polysiloxane of POLY is clearly visible given its thickness of about 1 mm. In the case of PLAS the four tiles were divided by a smaller gap of reflective Mylar of about 100 m only.
The maps were also calculated for increasing values of the threshold to seek for smaller dead zones, as shown in Fig. 11. Thresholds are 40, 60, 80, 90, 120 and 80, 120, 160, 180, 240 ADC counts for POLY and PLAS respectively. For PLAS the small gap between the tiles is visible for threshold values above 80. A drop of efficiency is also visible for thresholds 80 and 120 (above these values particle statistics is too low) in the positions where the WLS fibers are located ( per tile with a 1 cm spacing). Four larger areas with lower efficiency are also visible due to the presence of the long bolts spanning the full module length (visible in Fig. 6 right), which were used to tighten the absorber–scintillator stack.
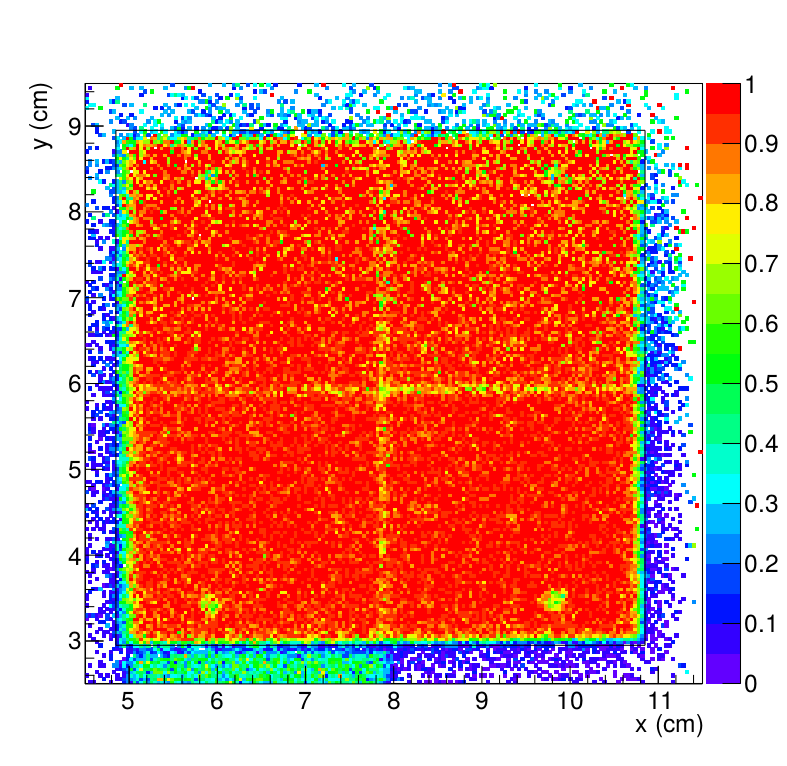
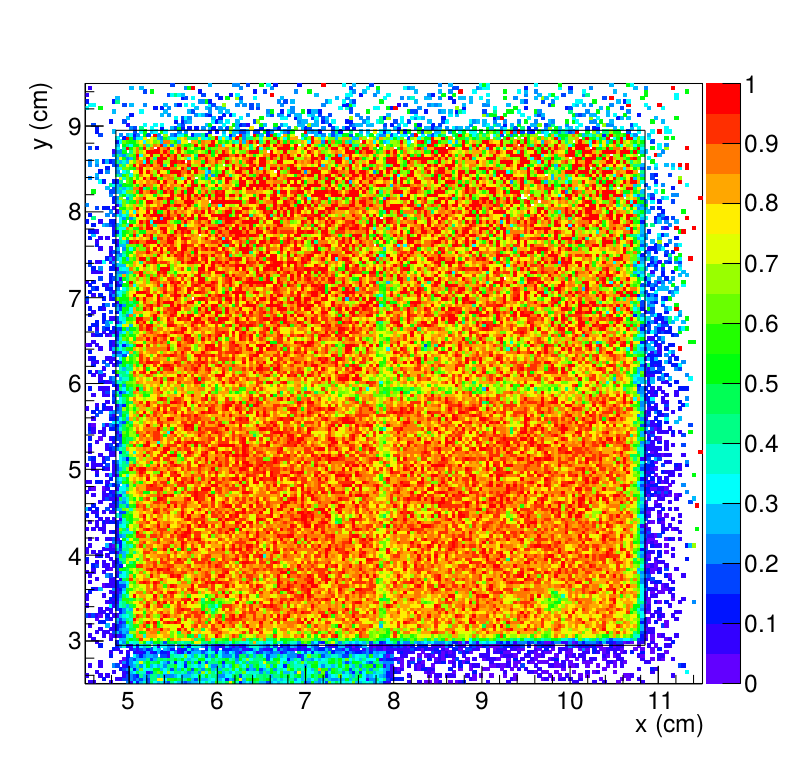
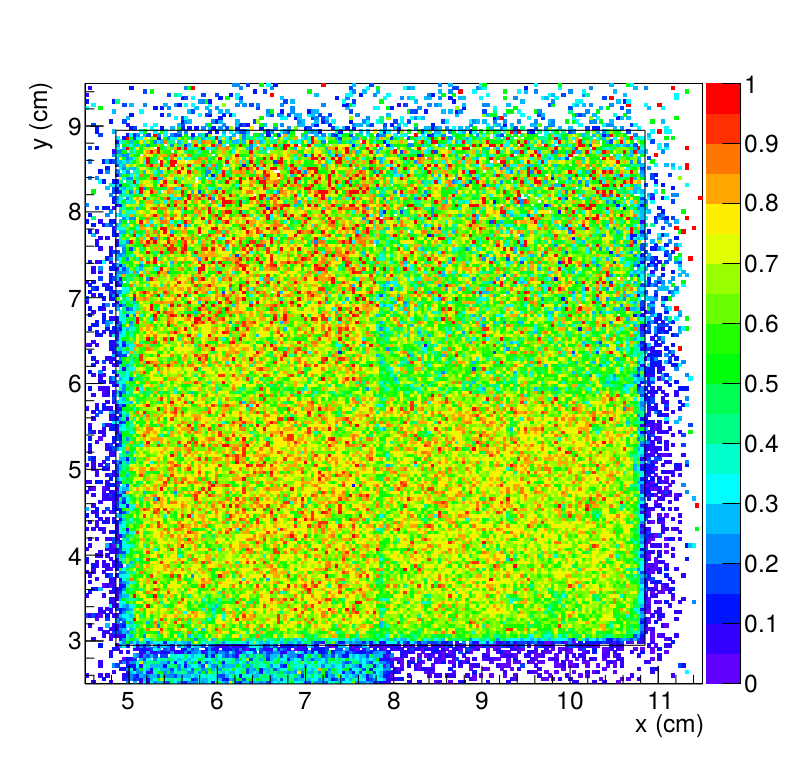
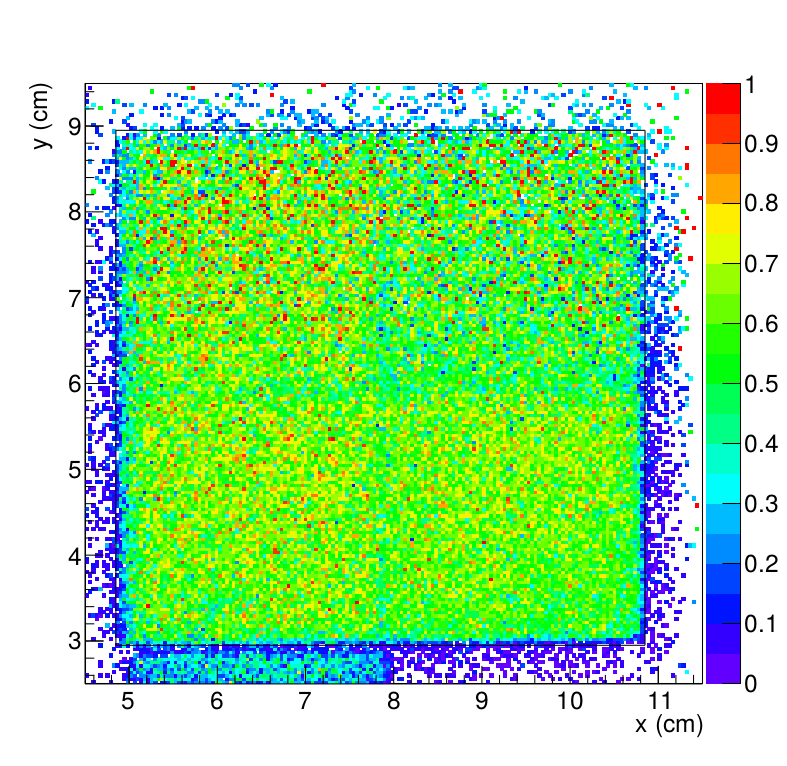
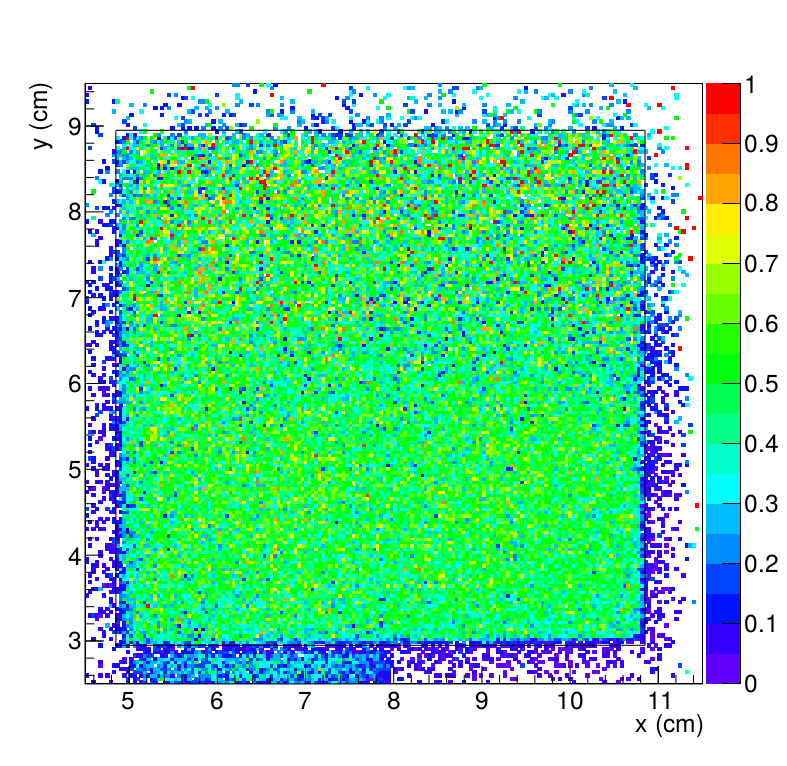
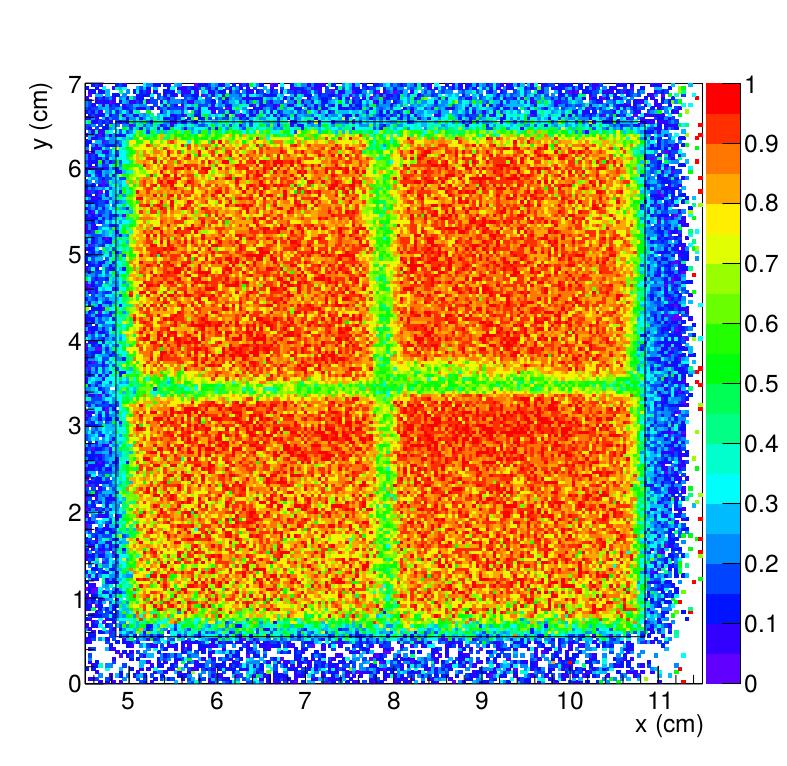
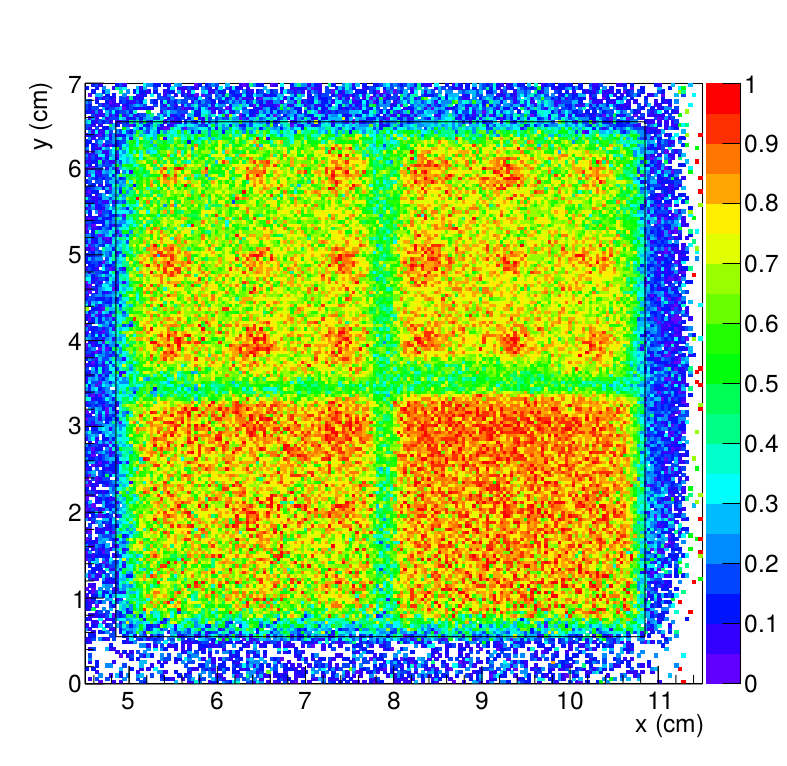
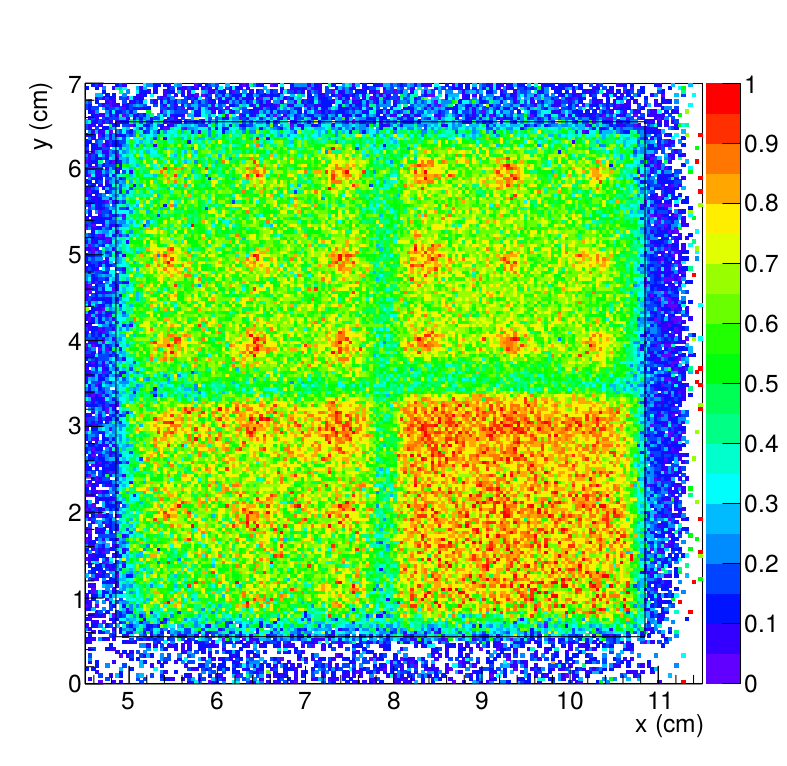
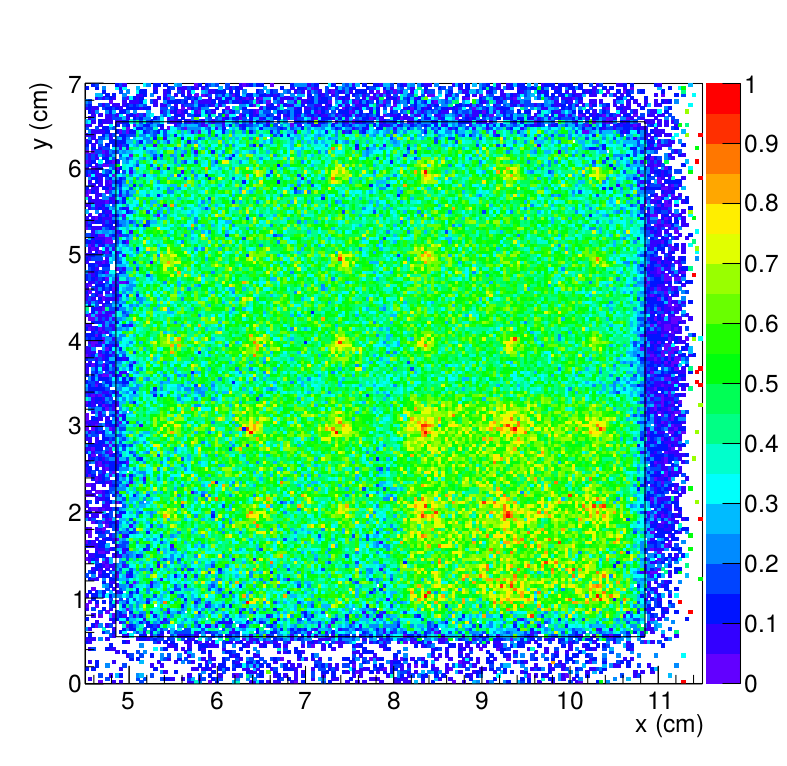
In general the decrease in efficiency has a similar trend for POLY and PLAS but it can be noticed that POLY retains high efficiency if the particle passes close to the fiber (pattern of red regions for thresholds 80, 90, 120) while the decrease is more uniform in space for PLAS. This effect is consistent with the results of the optical simulation (see right plot of Fig. 2), which indicates larger photon collection efficiency for POLY especially in that region.
For POLY in the map corresponding to threshold 80 (third plot from left in the bottom row) a region with reduced efficiency is observed that could be due to the presence of bubbles or to the discontinuities in the polysiloxane creating total internal reflection that were observed visually (see Fig. 4 left).
It can also be observed that for POLY the UCM in the right-bottom position is on average more efficient, most likely due to the better fiber-SiPM mechanical match in that area.
The polysiloxane calorimeter was also exposed with a 90∘ tilt to study the light yield of individual tiles with mip tracks. We extracted the most probable value parameter of a Landau function model used to fit the signal distribution on each of the 60 (543) tiles. Results are shown in Fig. 12. Tiles are ordered from 1 to 5 according to their position along the beam direction. The mean of the most probable values for each tile position is given by the marker while their spread (ranging from 12 to 15 % of the central value) is shown by the error bar.

The efficiency maps of the three modules are shown in Fig. 13 for a 10 ADC counts threshold. The meniscus effect bending the free surface of the liquid during preparation is visible especially on the left bottom.

Figure 14 shows the efficiency of the upstream module with higher thresholds of 30 (left) and 35 (right) ADC counts to enhance the visibility of non-uniformities. The other two modules show similar patterns. Again the higher efficiency close to the WLS fibers is confirmed. In general, the pouring process does not induce any efficiency gradient in the horizontal or vertical direction. Still non-uniformity along the cells are visible and have been traced to the presence of bubbles and on areas where the Tyvek was detached by stresses during the cool down in the production phase.

7.4 Measurement of light collection efficiency
In May 2018 one of the polysiloxane UCM555The bottom right one in Fig. 11 (bottom row) which is also the most efficient. NB: the comparison between POLY and PLAS of Fig. 8 is an average on four UCM (fiducial volume across the four UCM). was tested after having polished the WLS fibers at the same level of the aluminum backplane of the calorimeter module. From now on we will refer to this improved module as POLY′. The signal from the central SiPM was amplified with a trans-impedance amplifier (model ASD-EP-EB-N from Advandsid [55]). The amplifier was connected directly on an Advansid SiPM with 15 m cell size mounted on a PCB (as shown in Fig. 15 left). The low-gain output providing a 5 amplification was digitized with a v1751 CAEN digitizer (10 bit, 1 V range, 1 GS/s).
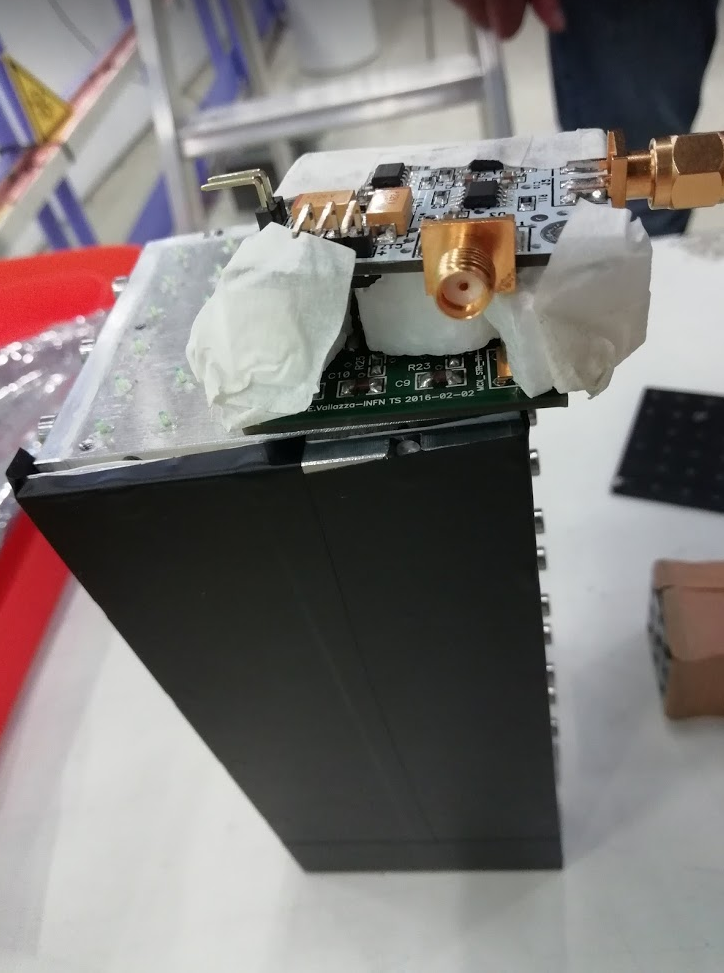

The number of collected photoelectrons for a mip was estimated by comparing the signal distribution with the distribution from single photo-electrons (P.E.) produced by noise. The crosstalk effect for the SiPM used was 20%, as estimated from the ratio of the counts in the second and in the first P.E. peaks. In the right-most plot of Fig. 15 we show the spectra of the maximum digitized signal amplitude of the UCM in the acquisition time window at a bias voltage of 38 V. The black histogram shows the distribution for all acquired waveforms while the blue filled one (with a Landau function fit superimposed) is for the subsample of single-cluster events in which the particle enters the fiducial volume (22 cm2) of the UCM.
The dependence of the position of 1, 2, 3 P.E. signals (black) and of the mip peak (blue) in ADC counts with the applied SiPM bias is shown in Fig. 16 left. The number of P.E./mip is obtained as the ratio between the mip peak and the single P.E peak after pedestal subtraction. The same quantity was also estimated using 2 and 3 P.E. peaks when properly visible (higher bias voltage). As expected this ratio has some dependence on the bias voltage since the photon detection efficiency varies with the applied over-voltage. This is shown in Fig. 16 right. At a voltage bias of 36 V we observe about 8.5 P.E./mip corresponding to about 70-80 P.E./mip when reading all the 9 SiPM. The correction is obtained with a Monte Carlo simulation since the light is not exactly equally shared among the nine fibers.

The test was repeated using a cosmic muon sample and a bias voltage of 32 V for both calorimeters (POLY′ and PLAS) giving P.E./mip for POLY′ and P.E./mip for PLAS. The result for POLY′ is consistent with the measurement done at CERN though slightly smaller (magenta point at 32 V in Fig. 16 right). After normalizing to the same scintillator thickness (10 mm for POLY vs 15 mm for PLAS), the 40% better collection efficiency () expected for POLY and the reduced light yield (measurement with sources) we obtain that POLY P.E./mip. This can be then compared to the P.E./mip found for PLAS. The light yield of POLY′ is therefore 30% smaller than expected. The reduction in the discrepancy (from a factor 2, as estimated in Sec. 7.1 for the first version of POLY, to 1.3) can be attributed to the improvements in the optical match between the WLS fibers and the SiPM, after the aforementioned fiber polishing procedure (i.e. reduced lateral and longitudinal displacements and improved polishing of the WLS).
8 Conclusions
We have developed a 13 shashlik calorimeter using for the first time a polysiloxane-based scintillator with 1.5 cm thick iron absorbers and 1.5 cm thick scintillator tiles read out by Y11 multi-clad WLS fibers. The detector was tested with particle beams in October 2017 and May 2018 and compared to a similar calorimeter composed of standard plastic scintillator (EJ-204, 1 cm thick, with BCF92 WLS fibers).
The calorimeter provides particle identification capabilities and energy resolution for electrons at the same level of those obtained with standard plastic scintillators.
The prototype demonstrates that the concept of using polysiloxane for shashlik calorimeters is a viable option with the advantage of reduced efforts for machining a large number of holes and a much higher radiation hardness. The fact that the WLS fibers have no air interface with the scintillator does not compromise the light trapping mechanism and transport to SiPM. This prototype also proved that is possible to pour the scintillator through optically separated compartments without significant deterioration of the light yield due to formation of bubbles or empty volumes near the surfaces. Further improvements in the uniformity of the tiles (presently at the 15 % level) and in the coupling between the SiPM and fibers can be envisaged ameliorating the gluing of the Tyvek and the mechanics of the SiPM holder.
Acknowledgements
The project leading to this application has received funding from the European Research Council (ERC) under the European Union’s Horizon 2020 research and innovation programme (grant agreement N. 681647). We thank L. Gatignon, M. Jeckel and H. Wilkens for help and suggestions during the data taking on the PS-T9 beamline. We are grateful to the INFN workshops of Milano Bicocca and Padova for the construction of the detector and, in particular, to L. Ramina.
References
- [1] H. Fessler, P. Freund, J. Gebauer, K. M. Glas, K. Pretzl, P. Seyboth, J. Seyerlein and J. C. Thevenin, A tower structured scintillator lead photon calorimeter using a novel fiber optics readout system, Nucl.10 Instrum. Meth. A 228 (1985) 303.
- [2] G. S. Atoyan et al., Lead-scintillator electromagnetic calorimeter with wavelength shifting fiber readout, Nucl. Instrum. Meth. A 320 (1992) 144.
- [3] J. Badier et al., Shashlik calorimeter: beam test results, Nucl. Instrum. Meth. A 348 (1994) 74.
- [4] S. J. Alvsvaag et al. [DELPHI STIC Collaboration], The small angle tile calorimeter in the DELPHI experiment, Nucl. Instrum. Meth. A 425 (1999) 106.
- [5] L. Aphecetche et al. [PHENIX Collaboration], PHENIX calorimeter, Nucl. Instrum. Meth. A 499 (2003) 521.
- [6] A. Zoccoli et al. [HERA-B Collaboration], The electromagnetic calorimeter of the HERA-B experiment, Nucl. Instrum. Meth. A 446 (2000) 246.
- [7] F. Goebel [ZEUS Collaboration], Performance of the ZEUS forward plug calorimeter, Nucl. Instrum. Meth. A 453 (2000) 230.
- [8] R. Dzhelyadin [LHCb Collaboration], The LHCb calorimeter detectors, Nucl. Instrum. Meth. A 581 (2007) 384.
- [9] A. Longhin, L. Ludovici and F. Terranova, A novel technique for the measurement of the electron neutrino cross section, Eur. Phys. J. C 75 (2015) 155.
-
[10]
http://enubet.pd.infn.it - [11] A. Berra et al. [ENUBET Collaboration], Enabling precise measurements of flux in accelerator neutrino beams: the ENUBET project, CERN-SPSC-2016-036, SPSC-EOI-014, Geneva, 2016.
- [12] F. Acerbi et al. [ENUBET Collaboration], The ENUBET project, CERN-SPSC-2018-034, SPSC-I-248, Geneva, 2018.
- [13] A. Meregaglia, ENUBET: Enhanced NeUtrino BEams from kaon Tagging, JINST 11 (2016) C12040.
- [14] A. Tiwari, M. D. Soucek, Concise Encyclopedia of High Performance Silicones, 2014, Hoboken, New Jersey: J. Wiley and Sons, p. 1990.
- [15] M. Bowen, S. Majewski, D. Pettey, J. Walker, R. Wojcik, C. Zorn. A new radiation-resistant plastic scintillator. IEEE Trans. Nucl. Sci. 36 (1989) 562.
- [16] A. Quaranta, S. Carturan, T. Marchi, A. Antonaci, C. Scian, V. L. Kravchuk, M. Degerlier, F. Gramegna, G. Maggioni, Radiation hardness of polysiloxane scintillators analyzed by ion beam induced luminescence, Nucl. Instrum. Methods Phys. Res. B, 268 (2010) 3155.
- [17] A. Quaranta, S. Carturan, M. Cinausero, T. Marchi, F. Gramegna, M. Degerlier, A. Cemmi, S. Baccaro, Characterization of polysiloxane organic scintillators produced with different phenyl containing blends, Mater. Chem. Phys. 137 (2013) 951.
- [18] A. Quaranta, S. M. Carturan, T. Marchi, V. L. Kravchuk, F. Gramegna, G. Maggioni, M. Degerlier. Optical and scintillation properties of polydimethyl-diphenylsiloxane based organic scintillators, IEEE Trans. Nucl. Sci. 57 (2010) 891.
- [19] S. Carturan, A.Quaranta, T. Marchi, F. Gramegna, M. Degerlier, M. Cinausero, V. L. Kravchuk, M. Poggi, Novel polysiloxane-based scintillators for neutron detection, Rad. Prot. Dosim. 143 (2011) 471.
- [20] M. Bowen, S. Majewski, D. Pettey, J. Walker, R. Wojcik, C. Zorn. A new radiation-hard plastic scintillator, Nucl. Instrum. Meth. 276 (1989) 391.
- [21] V. M. Feygelman, J. K. Walker, J. P. Harmon, Polysiloxane-based scintillators doped with oligophenylenes: Effect of color centers on radiation stability, Nucl. Instrum. Meth. A 290 (1990) 131.
- [22] V. M. Feygelman, J. K. Walker, J. P. Harmon, Polysiloxane-based scintillators: 1,1,4,4-tetraphenylbutadiene as a secondary fluor, Nucl. Instrum. Meth. A 295 (1990) 94.
- [23] J. K. Walker, A. R. Katritzky, Z. Degaszfaran, Radiation resistance of polysiloxane based scintillators doped with oxadiazole fluors, Chem. Scripta, 29 (1989) 245.
- [24] J. Harmon, J. Gaynor, V. Feygelman, J. Walker, Linear polydiorganosiloxanes as plastic bases for radiation hard scintillators, Nucl. Instrum. Methods B 53 (1991) 309.
- [25] Z. W. Bell, G. M. Brown, C. H. Ho, F. V. Sloop Jr., Organic scintillators for neutron detection, in X-Ray and Gamma Ray Detectors and Applications IV (Proc. SPIE), R. B. James, L. A. Franks, A. Burger, E. M. Westbrook, R. D. Hurst editors. Norfolk, U.K.: Bertrams, 2002, 4784: p. 150-163.
- [26] Z.W. Bell, M.A. Miller, L. Maya, G.M. Brown, F.V. Sloop Jr., Boron-Loaded Silicone Rubber Scintillators, IEEE Trans. Nucl. Sci. 51 (1004) 1773.
- [27] A. Quaranta, S. Carturan, T. Marchi, M. Cinausero, C. Scian, V.L. Kravchuk, M. Degerlier, F. Gramegna, M. Poggi, G. Maggioni, Doping of polysiloxane rubbers for the production of organic scintillators, Opt. Mater. 32 (2010) 1317.
- [28] A. Quaranta, S. Carturan, T. Marchi, M. Buffa, M. Degerelier, M. Cinausero, G. Guastalla, F. Gramegna, G. Valotto, G. Maggioni, V. L. Kravchuk, Doped polysiloxane scintillators for thermal neutrons detection, J. Non-Cryst. Solids, 357 (2011) 1921.
- [29] ELJEN Technology, 1300 W. Broadway, Sweetwater, TX 79556, USA.
- [30] T. Marchi et al., Optical properties and pulse shape discrimination in siloxane-based scintillation detectors, Sci.Rep. 9, 2019, no.1, 9154.
- [31] Degerlier M. et al. (2014) Novel Scintillating Materials Based on Phenyl-Polysiloxane for Neutron Detection and Monitoring. In: Polychroniadis E., Oral A., Ozer M. (eds) International Multidisciplinary Microscopy Congress. Springer Proceedings in Physics, vol 154. Springer.
- [32] S. Agostinelli et al. [GEANT4 Collaboration], GEANT4: A Simulation toolkit, Nucl. Instrum. Meth. A 506 (2003) 250.
- [33] J. Allison et al. [GEANT4 Collaboration], Geant4 developments and applications, IEEE Trans. Nucl. Sci. 53 (2006) 270.
- [34] J. Allison et al., Recent developments in GEANT4, Nucl. Instrum. Meth. A 835 (2016) 186.
- [35] S. Carturan et al., Flexible scintillation sensors for the detection of thermal neutrons based on siloxane 6LiF containing composites: Role of 6LiF crystals size and dispersion, Nucl. Instrum. Meth. A 925 (2019) 109.
- [36] G. S. Atoyan et al., An improved shashlik calorimeter, Nucl. Instrum. Meth. A 584 (2008) 291.
- [37] A. Berra et al., Silicon photomultipliers as a readout system for a scintillator-lead Shashlik calorimeter, IEEE Trans. Nucl. Sci. 58 (2011) 1297.
- [38] A. Berra et al., A shashlik calorimeter readout with silicon photomultipliers with no amplification of the output signal, JINST 6 (2011) P10004.
- [39] A. Berra et al., Characterization of a DAQ system for the readout of a SiPM based shashlik calorimeter, Nucl. Instrum. Meth. A 735 (2014) 422.
- [40] M. Anelli et al. [SHiP Collaboration], A facility to Search for Hidden Particles (SHiP) at the CERN SPS, CERN-SPSC-2015-016, SPSC-P-350, arXiv:1504.04956 [physics.ins-det].
- [41] C. Adloff et al. [CALICE Collaboration], Construction and Commissioning of the CALICE Analog Hadron Calorimeter Prototype, JINST 5 (2010) P05004.
- [42] A. Berra et al., A compact light readout system for longitudinally segmented shashlik calorimeters, Nucl. Instrum. Meth. A 830 (2016) 345.
- [43] A. Berra et al. [SCENTT Collaboration], Shashlik calorimeters with embedded SiPMs for longitudinal segmentation, IEEE Trans. Nucl. Sci. 64 (2017) 1056.
- [44] G. Ballerini et al. [ENUBET Collaboration], Testbeam performance of a shashlik calorimeter with fine-grained longitudinal segmentation, JINST 13 (2018) P01028.
- [45] F. Acerbi et al. [ENUBET Collaboration], Irradiation and performance of RGB-HD Silicon Photomultipliers for calorimetric applications, JINST 14 (2019) P02029.
- [46] KURARAY CO., LTD., Ote Center Building,1-1-3, Otemachi, Chiyoda-ku, Tokyo 100-8115, Japan
- [47] Saint-Gobain Group, Les Miroirs 18, avenue d’Alsace, 92400 Courbevoie, France.
- [48] Fondazione Bruno Kessler, via Santa Croce 77, I-38100, Trento, Italy.
- [49] F. Acerbi, High-density cell and high-efficiency Silicon Photomultipliers, Talk at the 2015 Single Photon Workshop (SPW2015), Geneva, July 13-17 2017.
- [50] Advansid s.r.l., Via Sommarive 18, I-38123 Povo, Trento, Italy.
- [51] CAEN S.p.A. Via Vetraia, 11, 55049, Viareggio (LU), Italy.
- [52] M. Prest, G. Barbiellini, G. Bordignon, G. Fedel, F. Liello, F. Longo, C. Pontoni and E. Vallazza, The AGILE silicon tracker: An innovative gamma-ray instrument for space, Nucl. Instrum. Meth. A 501 (2003) 280.
- [53] G. Balbi et al., Test and simulation of plastic scintillator strips readout by silicon photomultipliers, JINST 9 (2014) T04004.
- [54] R. Wigmans, Calorimetry, Energy Measurement in Particle Physics, International Series of Monographs on Physics, Oxford University Press (2017).
-
[55]
Advansid Trans-Impedance Amplifier
ASD-EP-EB-N.
http://advansid.com/attachment/get/up_26_1386248853.pdf