Evolution of MAXI J1631479 during the January 2019 outburst observed by INTEGRAL/IBIS
Abstract
We report on a recent bright outburst from the new X-ray binary transient MAXI J1631479, observed in January 2019. In particular, we present the 30-200 keV analysis of spectral transitions observed with INTEGRAL/IBIS during its Galactic Plane monitoring program. In the MAXI and BAT monitoring period, we observed two different spectral transitions between the high/soft and low/hard states. The INTEGRAL spectrum from data taken soon before the second transition, is best described by a Comptonised thermal component with a temperature of 30 keV and a high luminosity value of L3 erg s-1 (assuming a distance of 8 kpc). During the second transition, the source shows a hard, power-law spectrum. The lack of high energy cut-off indicates that the hard X-ray spectrum from MAXI J1631479 is due to a non-thermal emission. Inverse Compton scattering of soft X-ray photons from a non-thermal or hybrid thermal/non-thermal electron distribution can explain the observed X-ray spectrum although a contribution to the hard X-ray emission from a jet cannot be determined at this stage. The outburst evolution in the hardness-intensity diagram, the spectral characteristics and the rise and decay times of the outburst are suggesting this system is a black hole candidate.
keywords:
gamma rays: observations — radiation mechanisms: non-thermal — stars: individual: MAXI J1631479— stars: black hole, neutron star — X-rays: binaries.1 Introduction
In recent years, with the advent of new space and ground-based facilities, numerous efforts have been made to understand the X-ray emission in transient X-ray Binaries, containing either a neutron star (NS) or a black hole (BH). These systems are characterized by transitions between two main spectral states: the high/soft state, with the dominant soft X-ray emission originating from the accretion disc, and the low/hard state, where the dominant hard X-ray emission arises from the Inverse Compton scattering of soft thermal photons by hot electrons in the corona (Done et al. (2007)). The evolution of the spectral and timing properties are crucial to understand the accretion-ejection connection during an outburst for both BH and NS systems. The evolution of an outburst is well described in the hardness-intensity diagram, which represents a useful tool to investigate on the phenomenological connections between the spectral-timing states and the outflows modes (Gardenier & Uttley (2018); Belloni (2018); Belloni & Motta (2016); Fender (2016); Fender & Belloni (2012); Done et al. (2007); Fender (2004); Fender et al. (2004), and references therein). Although the geometry of these systems is fairly well established, the jet contribution to the high energy emission in the hard state is still unclear.
A new outburst from MAXI J1631479 was reported on 2018 December 21 by the MAXI/GSC nova alert system reporting a bright hard X-ray outburst in the Norma region Kobayashi et al. (2018). The X-ray flux was F=20927 mCrab at the inferred position of R.A. (J2000)= 247.770 deg., DEC (J2000) = -47.920 deg., with a 90% confidence error radius of 10.2′. Confirmation of MAXI J1631479 as a new X-ray transient source was provided by NuSTAR observations performed on 2018 December 28 at the refined position is R.A. (J2000) = 16:31:13.4, DEC (J2000) = -47:48:18 with an uncertainty of 15″.
On 2019 January 13 a radio counterpart for MAXI J1631479 was detected by the Australia Telescope Compact Array (ATCA) observations at central frequencies of 5.5 and 9 GHz Russell et al. (2019). A clear identification of an optical counterpart is missing, consistently with the high column density found in the NuSTAR observation. Indeed, the position of MAXI J1631479 was observed with KMTNet telescopes Kim et al. (2016), with the iTelescope.Net T17 and with the 1m telescope of the CHILESCOPE observatory Kong (2019) and no new optical source was clear found at the position of the radio detection Shin et al. (2019).
INTEGRAL started Norma region observations as part of the Galactic Plane Scan in revolution 2048 (2019 January 21- 23) and MAXI J1631479 was clearly detected by IBIS/ISGRI Onori et al. (2019). The position of the source in the 22–60 keV energy band was R.A. (J2000)=247.814 deg, DEC(J2000)=-47.800 deg with an error radius of 0.5′ and a flux F= 265.23.7 mCrab. Here, we report the results from our analysis of the IBIS/ISGRI data up to 200 keV.
2 Observations and Data analysis
MAXI J1631479 has been monitored at high energies by INTEGRAL during three revolutions: 2048, 2049 and 2050, starting from 2019-01-21T13:30 UTC (58504.563 MJD), 2019-01-24T02:47 UTC (58507.117 MJD) and 2019-01-26T19:12 UTC (58509.801 MJD), respectively.
The INTEGRAL/IBIS Ubertini
et al. (2003) consolidated data for these observations were processed using the standard Off-line Scientific Analysis (osa v11.0) software, released by the INTEGRAL Science Data Centre Courvoisier
et al. (2003).
This software was used to obtain both spectra and light curves of the source in different common time intervals and
a systematic error of 2% was included.
MAXI J1631479 was out of the JEM-X field of view and this precludes INTEGRAL detection at
lower energies (¡30 keV).
The Neil Gehrels Swift observatory Gehrels et al. (2004) collected data from this source in January 2019. We used the results from BATKrimm et al. (2013) observations, while the XRT Burrows et al. (2004) data are not simultaneous with the INTEGRAL ones. In view of the strong variability of the source, a common INTEGRAL-Swift spectral study in a broad energy band is not possible.
MAXI J1631479 was also observed by the Monitor of All-sky X–ray Image Matsuoka et al. (2009), and their data have been used in our analysis.
We use xspec v12.10.1 Arnaud (1996) in order to fit each spectral state in the 30-200 keV energy range.
3 Spectral Analysis Results
In order to study the hard X-ray spectral properties of MAXI J1631479, we analyze the INTEGRAL/IBIS data taken during the three INTEGRAL revolutions, over the energy range 30-200 keV.
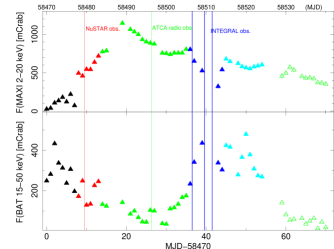
The time evolution and the respective behavior of the different spectral states are shown in Figure 1, where the 1-day binned light curves from MAXI111http://MAXI/GSC.riken.jp/top/slist.html and Swift/BAT222https://swift.gsfc.nasa.gov/results/transients are reported. The variation of the source along the outburts is clearly visible from these lightcurves. The epochs of the NuSTAR (red line), ATCA (green line) and INTEGRAL (blue line) observations are shown for comparison. The flux conversion into mCrab was obtained with the following factors: 1mCrab0.00022 ct cm-2 s-1 and 1Crab3.8 ph cm-2 s-1 for Swift/BAT 1 and MAXI/GSC 2, respectively.
Although the source is within the BAT confusion radius of another X-ray transient, namely AX J1631.94752, the MAXI/GSC light curve is not contaminated significantly. Indeed, during the monitoring period, while MAXI J1631479 is detected at high flux levels, AX J1631.94752 is continuously detected at low level by Swift/BAT. The lack of contamination is confirmed by the INTEGRAL/IBIS map, where the emission from AX J1631.94752 is lower than 10 mCrab (3 upper limit) in the 30-50 keV energy range.
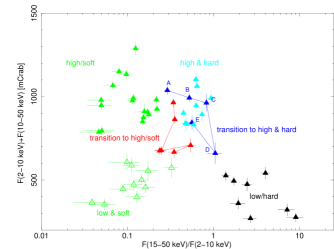
We performed an analysis for spectral variability by plotting the hardness versus total emission in two energy bands. Figure 1 (right panel) shows the hardness-intensity diagram for the MAXI/GSC and Swift/BAT observations. The hardness is derived using the ratio between the fluxes in these two X-ray bands F/F and is plotted versus the total flux F+F. Each point corresponds to 1 day of time integration and only epochs for which both soft and hard X-ray data are available have been used.
The different colored points in the right panel of Figure 1 represent six regions we have selected from the temporal intervals. These regions correspond to the different spectral states identified in the MAXI/GSC and Swift/BAT light curves, as shown in the left panel of Figure 1:
-
•
: from MJD 58470 to 58478, the source shows a low flux level at soft energy and a high flux level in the hard X-ray band. This is typical behavior for the low/hard state (black points).
-
•
: from MJD 58479 to 58485, the source shows an increasing soft flux and a decline in hard X-ray, indicating a transition from the low/hard state to a high/soft state (red points).
-
•
: from MJD 58486 to 58506, the source shows a high soft flux level and is low in hard X-rays, indicative of a standard high/soft state (green points).
-
•
: from MJD 58507 to 58514, the source shows unusual variability during this period. A decline in the soft X-ray emission is observed for three days followed by a sudden increase lasting for two–three days. Unfortunately, no soft X-ray data are available for the two days in between this change in the emission. In the same period, the source experienced an increase in hard X-rays corresponding to a soft X-ray decline, followed by a slight drop in hard flux with a corresponding enhancement in soft X-rays. This behaviour suggests that during the first three days the source started a transition from the high/soft state to a low/hard state. Afterwards it suddenly reversed this trend towards a new state (blue points).
-
•
: from MJD 58515 to 58522, the source shows a high flux level in both soft and hard bands. This suggests that in this epoch MAXI J1631479 can be considered being in a intermediate state (light blue points), where the X-ray emission can be explained with hybrid (thermal and non-thermal) Comptonization models.
-
•
: from MJD 58529 to 58540, the source transits towards a soft state at low luminosity level (green empty points).

The IBIS/INTEGRAL observations occurred during the epoch and fall in the region of the blue points in the right panel of Figure 1 and marked as blue vertical lines in the left panel, for comparison. The IBIS observations carried out during revolution 2048 fall close in time to the first MAXI/GSC blue point (point A in figure 1, right panel). No MAXI/GSC and BAT simultaneous data are available for the second and third IBIS/INTEGRAL observations.
The left panel of Figure 2 shows the 2–4 keV and 4–10 keV MAXI light curves (bin time 6h), together with the 30–60 keV IBIS light curve (bin time 2000 s). The variation in the source spectral state during the INTEGRAL observation is clearly visible. In particular, during the first INTEGRAL/IBIS observation (revolution 2048) the source is in a high/soft state, however during the subsequent observations (revolutions 2049 and 2050) the source flux increased by a factor 2 in the 30–60 keV energy range, indicating the occurrence of the transition to a low/hard state.
We performed spectral analysis for the three INTEGRAL revolutions separately.
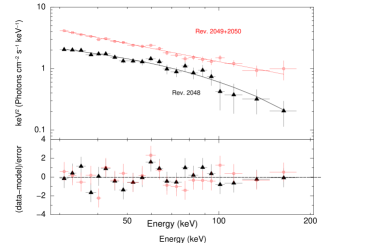
First, we attempted to fit the spectra using a simple power law model. For the spectrum of revolution 2048 we obtain a spectral index of and a d.o.f. of 34/20, with residuals at high energies. Then we modelled these data with a cut-off power-law, which resulted in a best-fit with d.o.f.=25/19. In this case, we obtain a spectral index , E keV and a high energy flux of F=(2.80.1)10-9 erg cm-2 s-1 . However we remark that by using the latter model the fit improvement is only marginal. Indeed, applying the appropriate F-test statistics for model comparison (Press et al. 2007; see also Orlandini et al. 2012), we obtain an improvement probability of only about 28%.
In order to obtain the physical parameters of the source, we also fit this dataset using a model describing the Comptonization of soft photons in a hot plasma (comptt in xspec, Titarchuk, 1994). The resulting Comptonized plasma has a temperature of 29 keV and optical depth 0.7, with the input soft photon Wien temperature fixed at the default value (0.1 keV), not affecting the high energy spectrum. The best fit parameters are listed in Table 1. In the right panel of Figure 2 the spectrum of revolution 2048, together with residuals with respect to the cut-off power-law model are shown (black filled triangles).
When fitting the IBIS data of revolutions 2049 and 2050 separately, we obtain similar results, both in flux and in spectral shape. This is also evident from Figure 1 (right panel), where IBIS observations fall in the same hardness region (between points C and D). Using a simple power law model, we obtain a spectral index of , a flux of F=(5.90.2)10-9 erg cm-2 s-1 and a d.o.f. of 20/20 for revolution 2049 and for revolution 2050 (, a flux of F=(5.90.2)10-9 erg cm-2 s-1 and a d.o.f. of 20/20). No high energy cutoff is required for these data. Taking into account the spectral similarity, similar flux levels and hardness, data from revolutions 2049 and 2050 have been combined to improve the statistical quality of the spectra and to better constrain the physical parameters, as reported in Table 1. The resulting spectrum together with the residuals with respect to the power law model are shown in Figure 2 with red squares (right panel).
| Model | Parameter | Rev. 2048 | Rev. 2049+2050 |
| IBIS Exposure | |||
| 13 ks | 36 ks | ||
| Power Law | 3.10.1 | 2.980.04 | |
| F | 3.00.1 | 5.90.1 | |
| d.o.f. | 34/20 | 20/20 | |
| Cutoff | 2.1 | … | |
| Power law | Ecutoff (keV) | 62 | … |
| F | 2.80.1 | … | |
| d.o.f. | 25/19 | … | |
| Comptt | (keV) | 29 | … |
| 0.7 | … | ||
| F | 2.90.1 | … | |
| d.o.f. | 25/19 | … | |
a Flux in units of 10-9 erg cm-2 s-1
4 Discussion
MAXI J1631479 belongs to a class of transient systems showing spectral state transitions.
When it starts to transit towards a hard state Negoro et al. (2019) the INTEGRAL/IBIS observation shows that the source had a high X-ray flux F3 erg cm-2 s-1and a hard spectrum (blue lines of Figure 1, at 58506 MJD) and it is dominated by a hard X-ray Comptonized component, arising from inverse Compton scattering of soft thermal photons in a hot corona with 29 keV and 0.7.
This intermediate value of the electron temperature confirms that the source is not in a standard high/soft or low/hard state. Joinet et al. (2008) found a similar corona temperature ( 30 keV) when the microquasar GRO J1655–40 transits from low/hard to hard/intermediate state. This temperature of the thermal population was also previously observed in GX 339-4 (Motta et al. (2009)) before the source transits from low/hard to hard/intermediate state. In this case the high energy cutoff disappears near the hard/intermediate-soft/intermediate transition. This behavior is similar to the MAXI J1631479 evolution: the high energy cutoff was not detected by INTEGRAL/IBIS when it moved towards a soft state at low luminosity. Indeed it is detected up to about 200 keV though the best fit is a simple power law () suggesting a non-thermal origin for this X-ray emission. This behavior continued in later observations, as noted in Figure 1, where the light blue points show that the source moved towards an intermediate state at a high flux in both soft and hard bands.
Transitions from low/hard state to high/soft state and then towards an intermediate state with high flux at these energies has previously been observed in black hole systems Done et al. (2007); Belloni (2018). The no-detection of a high energy cutoff using X-ray data up to 200 keV suggests that the hard X-ray emission may not be produced by thermal Comptonization. The observed spectrum in the intermediate state can be produced by Compton scattering on a non-thermal electron population Gilfanov (2010) or by a mixture of thermal and non-thermal features Coppi (1999); Del Santo et al. (2008). The shape of the hysteresis diagram of MAXI J1631479 appears similar to the one of the black hole X-ray binary XTE J1550564 Russell et al. (2010). Moreover, MAXI J1631479 showed radio emission at 5.5 and 9 GHz when it was in the high/soft state Russell et al. (2019) and a similar behaviour was reported for XTE J1550564. For that system, the authors were able to isolate the non-thermal emission from the jet and demonstrated that the synchrotron jet may dominate in hard X-ray when the source fades in the low/hard state, at very low luminosity level. In this case, the jet produces 100% of the emission when the soft (3-10 keV) and hard (100-250 keV) fluxes are comparable.
In the case of MAXI J1631479, Figure 2 shows that X-ray power-law component is observed when the soft and hard fluxes are comparable, although the energy ranges are slightly different from those used for XTE J1550564.
Unfortunately, for this source neither the distance nor the mass of the central object are known. In order to estimate the possible luminosity range of MAXI J1631479 , we used the extreme values of distances and masses known so far for X-ray binaries. In particular, the distances span from 1 kpc McClintock & Remillard (1986) to 27 kpc Casares et al. (2004), while the black hole masses can assume values from 4 M Özel et al. (2010) to 15.65 M McClintock & Remillard (1986); Orosz et al. (2007). Using realistic values for a LMXB, the luminosity of MAXI J1631479 during the intermediate state can vary from 5 LEdd (distance=20 kpc and mass=4 M) to 3.5 LEdd (distance=2 kpc and mass=15.65 M). Thus, as the emission of the jet in X-ray band can be dominant when the luminosity is between L2 LEdd and L2 LEdd Russell et al. (2010), the wide range of possible values derived for the luminosity of MAXI J1631479 do not allow us to exclude a contribute of the jet to the X-ray emission in MAXI J1631479.
The lack of a high energy cut-off indicates that the X-ray emission from MAXI J1631479 has a non-thermal origin that can be produced either by Comptonization of non-thermal electron population or by a hybrid thermal/non-thermal electron distribution.
The source outburst evolution and the typical times of the outburst suggest the BH nature of this source. Indeed, assuming the time spent to reach from 10% to 90% of the flux peak as the rise time and the reverse for the decay time, we obtained 15 days and 50 days though it seems the outburst has not yet ended (see Fig 1, left panel). These values are compatible with decay and rise times for BH and incompatible with much faster evolution times for NS, reported in the statistical study of Yan and Yu (2015). This result is in agreement with previous studies performed at different energy bands during the same outburst. When MAXI J1631479 transits from a low/hard to high/soft state (red line of Figure 1, 58480 MJD) the NuSTAR 3–79 keV spectrum is well modelled by a disk-blackbody with a temperature of 1.12 keV, a power-law with a photon index of 2.39 and iron K emission line with an equivalent width of 90 eV Miyasaka et al. (2018). Based on these spectral characteristics the authors suggested the system as a black hole binary in the high/soft state with most of the flux in the soft X-ray band (F=1.710-8 erg cm-2 s-1 and F=1.810-8 erg cm-2 s-1 ). Russell et al. (2019) also report a similar conclusion on the source nature by using the radio observation performed on 2019 January 13 (green line of Figure 1, 58496 MJD). A radio counterpart of MAXI J1631479 was detected by Australia Telescope Compact Array (ATCA) with a flux density of F=(630 50) Jy and a radio luminosity L=(9.5 0.8)1028 (d/5 kpc)2 erg s-1.
This radio emission could indicates the presence of a compact jet, as it was detected during the transition from high/soft to low/hard state, i.e. when synchroton jet emission could became dominant at X-ray wavelengths and at low luminosities.
Acknowledgements
We acknowledge the ASI financial/programmatic support via ASI-INAF agreement number 2013-025.R1 and ASI/INAF n.2017-14-H.0.
F.O. acknowledge the support of the H2020 European Hemera program, grant agreement No 730970.
This research has made use of the MAXI/GSC data provided by RIKEN, JAXA and the MAXI/GSC team.
Swift/BATtransient monitor results provided by the Swift/BATteam.
P.A.C. is grateful to the Leverhulme Trust for the award of an Emeritus Fellowship.
Finally, the authors thank the anonymous referee for the valuable comments which helped to improve the manuscript.
References
- Arnaud (1996) Arnaud K. A., 1996, in Jacoby G. H., Barnes J., eds, Astronomical Society of the Pacific Conference Series Vol. 101, Astronomical Data Analysis Software and Systems V. p. 17
- Belloni (2018) Belloni T. M., 2018, arXiv e-prints, p. arXiv:1803.03641
- Belloni & Motta (2016) Belloni T. M., Motta S. E., 2016, in Bambi C., ed., Astrophysics and Space Science Library Vol. 440, Astrophysics of Black Holes: From Fundamental Aspects to Latest Developments. p. 61 (arXiv:1603.07872), doi:10.1007/978-3-662-52859-4˙2
- Burrows et al. (2004) Burrows D. N., et al., 2004, in Flanagan K. A., Siegmund O. H. W., eds, Proc. SPIEVol. 5165, X-Ray and Gamma-Ray Instrumentation for Astronomy XIII. pp 201–216, doi:10.1117/12.504868
- Casares et al. (2004) Casares J., Zurita C., Shahbaz T., Charles P. A., Fender R. P., 2004, ApJ, 613, L133
- Coppi (1999) Coppi P. S., 1999, in Poutanen J., Svensson R., eds, Astronomical Society of the Pacific Conference Series Vol. 161, High Energy Processes in Accreting Black Holes. p. 375 (arXiv:astro-ph/9903158)
- Courvoisier et al. (2003) Courvoisier T. J.-L., et al., 2003, A&A, 411, L53
- Del Santo et al. (2008) Del Santo M., Malzac J., Jourdain E., Belloni T., Ubertini P., 2008, MNRAS, 390, 227
- Done et al. (2007) Done C., Gierliński M., Kubota A., 2007, A&ARv, 15, 1
- Fender (2004) Fender R., 2004, New Astron. Rev., 48, 1399
- Fender (2016) Fender R., 2016, Astronomische Nachrichten, 337, 381
- Fender & Belloni (2012) Fender R., Belloni T., 2012, Science, 337, 540
- Fender et al. (2004) Fender R. P., Belloni T. M., Gallo E., 2004, MNRAS, 355, 1105
- Gardenier & Uttley (2018) Gardenier D. W., Uttley P., 2018, MNRAS, 481, 3761
- Gehrels et al. (2004) Gehrels N., et al., 2004, ApJ, 611, 1005
- Gilfanov (2010) Gilfanov M., 2010, X-Ray Emission from Black-Hole Binaries. p. 17, doi:10.1007/978-3-540-76937-8˙2
- Joinet et al. (2008) Joinet A., Kalemci E., Senziani F., 2008, ApJ, 679, 655
- Kim et al. (2016) Kim S.-L., et al., 2016, Journal of Korean Astronomical Society, 49, 37
- Kobayashi et al. (2018) Kobayashi K., et al., 2018, The Astronomer’s Telegram, 12320
- Kong (2019) Kong A. K. H., 2019, The Astronomer’s Telegram, 12504
- Krimm et al. (2013) Krimm H. A., et al., 2013, ApJS, 209, 14
- Matsuoka et al. (2009) Matsuoka M., et al., 2009, PASJ, 61, 999
- McClintock & Remillard (1986) McClintock J. E., Remillard R. A., 1986, ApJ, 308, 110
- Miyasaka et al. (2018) Miyasaka H., Tomsick J. A., Xu Y., Harrison F. A., 2018, The Astronomer’s Telegram, 12340
- Motta et al. (2009) Motta S., Belloni T., Homan J., 2009, MNRAS, 400, 1603
- Negoro et al. (2019) Negoro H., et al., 2019, The Astronomer’s Telegram, 12421
- Onori et al. (2019) Onori F., et al., 2019, The Astronomer’s Telegram, 12418
- Orosz et al. (2007) Orosz J. A., et al., 2007, Nature, 449, 872
- Özel et al. (2010) Özel F., Psaltis D., Narayan R., McClintock J. E., 2010, ApJ, 725, 1918
- Russell et al. (2010) Russell D. M., Maitra D., Dunn R. J. H., Markoff S., 2010, MNRAS, 405, 1759
- Russell et al. (2019) Russell T. D., van den Eijnden J., Degenaar N., 2019, The Astronomer’s Telegram, 12396
- Shin et al. (2019) Shin M.-S., Kim J.-W., Chang S.-W., Lee C.-U., Kim S.-L., 2019, The Astronomer’s Telegram, 12438
- Titarchuk (1994) Titarchuk L., 1994, ApJ, 434, 570
- Ubertini et al. (2003) Ubertini P., et al., 2003, A&A, 411, L131