Utilizing Opportunistic Social Networks for Remote Patient Monitoring in Rural Areas
Abstract.
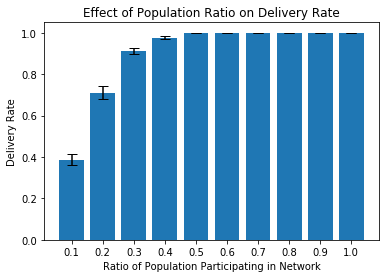
The use of Internet connectivity for remote patient monitoring is often unsuitable for rural communities where Internet infrastructure is lacking, and power outages are frequent. This paper explores the rural connectivity problem in the context of remote patient monitoring and analyzes the feasibility of utilizing a delay tolerant network (DTN) architecture that leverages the social behaviors of rural community members to enable out-of-range monitoring of patients in rural communities without local transportation systems. The feasibility is characterized using delivery latency and delivery rate with the number of participants and the number of sources as variables. The architecture is evaluated for Owingsville, KY using U.S. Census Bureau, the National Cancer Institute’s, and IPUMS ATUS sample data. The findings show that within a 24 hour window, there is an exponential relationship between the number of participants in the network and the delivery rate with a minimal delivery of 38.7%, a maximal delivery rate of a 100% and an overall average delivery rate of 89.8%.
1. Introduction
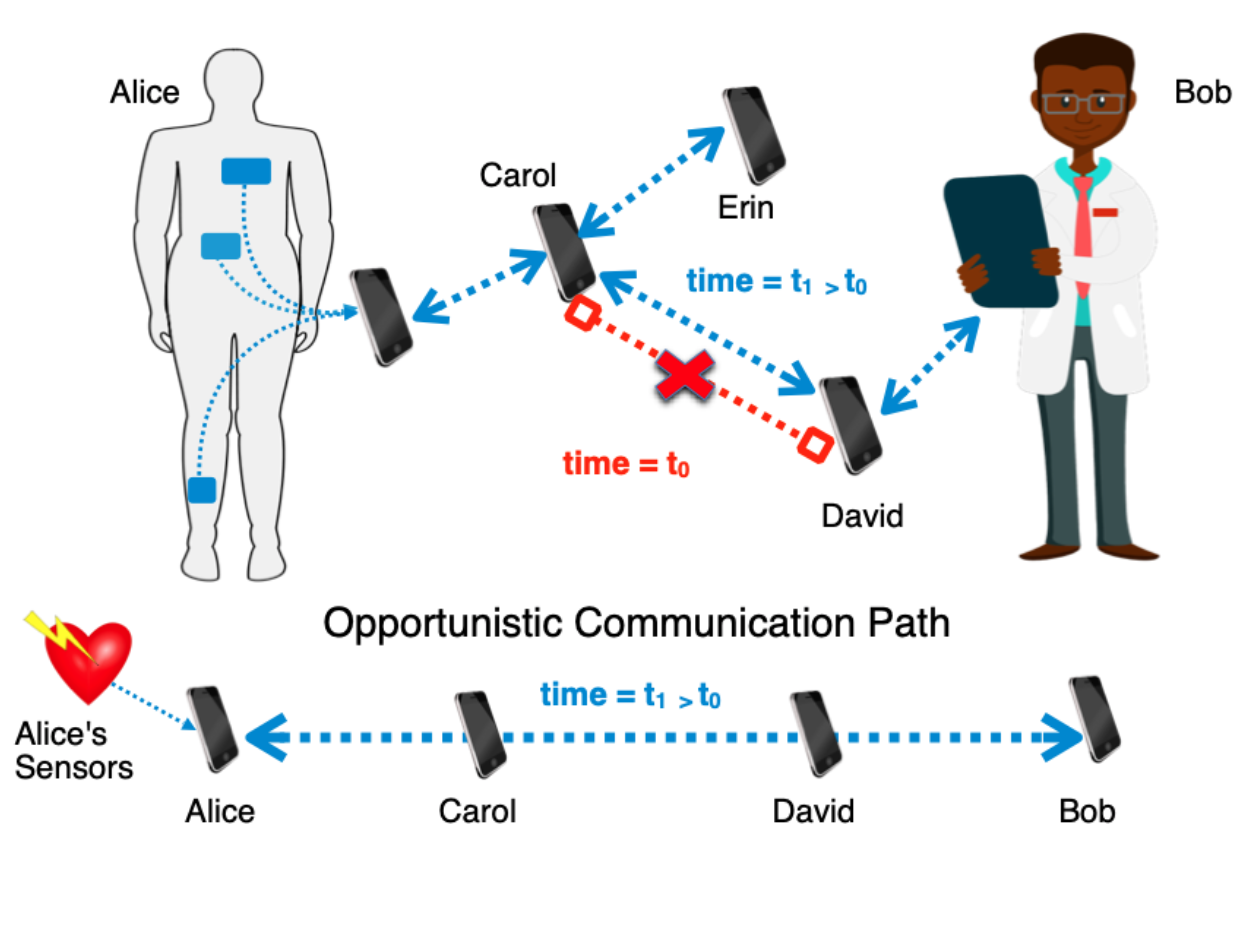
The ubiquity of mobile devices and rapid improvement in wireless body sensors has revolutionized the field of healthcare. Through mHealth solutions, practitioners can remotely monitor and assist with patients’ disease management in real time or asynchronously. This has improved the timeliness of clinical decision making, decreased the length of hospital stays, and reduced mortality rates (Niksch et al., 2014; Moy et al., 2017). Although many patients have benefited from mHealth solutions, and national efforts are underway to accelerate broadband deployment in under-served areas of the US (USDA, 2019), rural patients may not benefit to the same extent as their non-rural counterparts due to geographical and financial barriers that result in limited or nonexistent access to broadband connectivity (Henley et al., 2017). Unfortunately, rural patients have both a higher prevalence of chronic disease and lower access to medical care (CDC, 2017). A promising solution lies in the use of a delay tolerant network (DTN) architecture that leverages human mobility for disseminating patient health information (PHI) to care entities (Figure 1).
Though there has been some important research conducted to connect rural areas using DTNs (Pentland et al., 2004; Doria et al., 2002; Whitbeck and Conan, 2010; Raffelsberger and Hellwagner, 2013), the network characteristics such as node mobility and density differ vastly resulting in the need for a better understanding of how DTNs will operate in rural remote patient monitoring (RRPM) scenarios. A survey conducted in (Syed-Abdul et al., 2012) that consisted of clinical and non-clinical staff showed that DTNs are believed to be a promising solution for remote patient monitoring in low-resource settings for number of application domains including EHRs, notifications, new & blogs, etc. Additionally, Syed et. al. reports that there has been limited work on evaluating how DTNs will perform in RRPM environments (Syed-Abdul et al., 2012). Understanding how the use of human mobility influences data dissemination in RRPM environments is essential, but can be cumbersome due to its inherent characteristics.
Unlike other networks, such as social networks, in which most of the population is able to actively participate, patient monitoring networks typically consist of a small percentage of the population: patients, caregivers, and healthcare providers. In areas without public transportation, DTNs for the RRPM case will have to solely depend on opportunistic encounters between people. Hence, this work (1) derives a simple and novel mathematical description for delay tolerant remote monitoring in rural communities; and (2) provides insights on how the intrinsic characteristics of a real rural city, Owingsville, KY, influences network performance of delay tolerant rural patient data when the dissemination of information depends solely on inherent community participation.
2. Related Work
Previous work have explored various means of reducing the disparity in rural connectivity compared to their urban counterparts (Doria et al., 2002; Pentland et al., 2004; Whitbeck and Conan, 2010; Raffelsberger and Hellwagner, 2013). In the area of RRPM, some mobile ad-hoc network schemes have been proposed for transmitting PHI between patients and medical staff within a hospital (Rashid et al., 2005; Cho et al., 2008). Other researchers have investigated propagating voicemails or other emergency data via DTNs in amongst communities (Scholl et al., 2009; Jang et al., 2009). More closely related work proposes using vehicular ad hoc networks to disseminate PHI in rural communities (Barua et al., 2014; Murillo and Aukin, 2011).
The primary limitation of the aforementioned work is the lack of evidence that evaluations adequately reflect real rural environments, particularly when it comes to mobility and density; which are all required to properly assess solutions in rural environments. Additionally, the aforementioned work solely utilize vehicular communications in transmitting messages to medical entities. In regions where periodic vehicular networks (such as bus systems, etc) do not exist, the DTN would have to depend on other forms of node mobility (Madamori et al., 2019). This work is unique because it utilizes data from a real rural city, Owingsville, KY to obtain the natural mobility and density of nodes, and does not rely on local transportation systems.
3. Modeling Rural Remote Patient Monitoring
In order to understand the viability and feasibility of the network, a simple mathematical model is introduced that depicts some real-world characteristics of the RRPM problem, including the low-density of source-nodes(patients) and limited number of points of interests (POIs).
3.1. Model description
Consider a network in which represents a set of nodes that are randomly distributed in a square grid divided into cells, where an individual node is represented by . Let , where subsets are defined as: - patients, - relay nodes, - points of interest and - destinations, such that:
| (1) |
Let the set represent employed and unemployed intermediary nodes respectively. Let an individual patient be represented by and the set of messages for an individual patient be:
| (2) |
where message number is generated at time and is transmitted to at a time , where, is , and is the time to live of the message. For each message , there exists a set of nodes, , that have a copy of message and a set of nodes that do not have the message. At each distinct time, = [], encounters occur between nodes and through those encounters, messages in are transmitted. Once a node in encounters a node, , in , the corresponding message, , is transmitted and becomes a member of set .
After obtains the message and is added to the node set, if , then nothing else happens. However, if , the message is considered to be delivered and the difference between the start time and the time, , at which it occurs is the delivery latency for that message, . At each consecutive time step, more encounters occur. Finally, when all messages are either delivered, all message ’s expire, or the simulation ends; the delivery probability can be calculated as the number of messages in transmitted to .
| (3) |
Additionally, the upper-bound delivery latency for all delivered messages is defined as the message with the largest or:
| (4) |
| Time (Period) | Initial Probability Vector and Transition Matrices (, , ) | |
|---|---|---|
| Node Classification: {} | Node Classification: {} | |
| 19:00 - 06:30 (1) | (0.85, 0, 0.015) | (0.70, 0.079, 0.22) |
| 06:30 - 09:30 (2) | (0.93, 0, 0.070) | (0.71, 0.16, 0.13) |
| 09:30-16:30 (3) | (0.76, 0, 0.24) | (0.50, 0.33, 0.13) |
| 16:30-19:00 (4) | (0.77, 0, 0.23) | (0.48, 0.20, 0.32) |
3.2. Mobility and transmission
The mobility of nodes in the network is described by discrete time Markov chains (DTMCs) with a finite number of states (Picu et al., 2012). When DTMCs are used with heterogeneous contact rates, they have been shown to approximate realistic mobility for DTN scenarios and scales well with network size (Picu et al., 2012). For simplicity, the following states are used: home, work, and POI. Individual home and work locations are assigned to each node and POIs can be randomly selected from the set, , of POIs during each transition.
The subset {D,P} are considered stationary nodes and do not have a transition matrix associated with them. Each mobile node in the subset has a unique transition matrix for each time period, . Where, each period starts at and consists of consecutive time steps. For example, employed nodes such as are preferentially attached to and are stationary at work locations, which consists of POIs in the grid during the work period (e.g. 9:30am - 4:30pm). The model assumes that contact occurs when two nodes with the same radio are within transmission range of each other where, the transmission range is assumed to be circular. Messages are also assumed to be small enough to be successfully transmitted within each encounter and uniformly sized.
4. Numerical Evaluation
In evaluating the feasibility and viability of the model, data was obtained from the Federal Communications Commission and the US Census Bureau regarding Owingsville, KY (Bath County) (Bureau, 2018). Distress monitoring for cancer patients was used as a domain example of RRPM due to its delay tolerant nature (messages are valid for over 24 hours) and the prevalence of cancer and distress within eastern Kentucky (CDC, 2017; Max-Onakpoya et al., 2019).
| Parameter | Value | Source |
| Simulation seeds | 0:1:99 | – |
| Simulation duration | 24 hours | – |
| Adult Population of Owingsville | 400 | (Bureau, 2018) |
| Area of Owingsville | 2.409 sqmi | (Bureau, 2018) |
| Number of Cells | (Bureau, 2018) | |
| Cell size | 10 ft 10ft | (Bureau, 2018) |
| Number of patients () | 2:2:10 | (NIH-NCI and CDC, 2019) |
| Number of caregivers () | 2:2:10 | (Berry et al., 2016) |
| Number of destinations () | 1 | (Berry et al., 2016) |
| Ratio of population involved in intermediary network () | 0.1:0.1:1 | – |
| Number of POIs () | 25 | Owingsville Map |
| Number of Clinical Staff () | (Government, 2014) | |
| Periods | 1 to 4 | (Hofferth et al., 2018) |
| Data generation rate | 1 message per 24 hours | Markey Cancer Center |
| Ratio of employed nodes | 0.935 | (U.S. Bureau of Labor Statistics retrieved from FRED, 2018) |
| Transmission range (based on Bluetooth 5) | (Woolley, 2019) | |
| Time to live () of a message | – |
4.1. Rural Node Mobility
Contact rates in this work are based on a 2017 IPUMS ATUS sample of non-metropolitan households in the US, 303 routine activities were obtained, along with corresponding start and stop times, and classified into three states: Home, Work and POI (Hofferth et al., 2018). In addition, information from IPUMS ATUS was obtained for the number of individuals in each state for 30 minute intervals, and four (4) periods were defined based on the number of people in each state. The four (4) periods defined can be found in the ”Time (Period)” column in Table 1. Consequently, the transition matrix was estimated for each period by obtaining the transition matrix for each individual, and aggregating it over each period.
4.2. Simulation setup
To understand how a DTN could be used for RRPM, distress information from cancer patients (source nodes) to their respective healthcare providers (destination nodes) was used and a simulation environment was created in Python111Code available at https://github.com/netreconlab/TESCA19. Table 2 describes the parameters used in the simulation along with the sources for their values where applicable.
4.3. Results
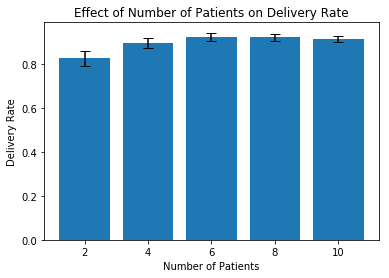
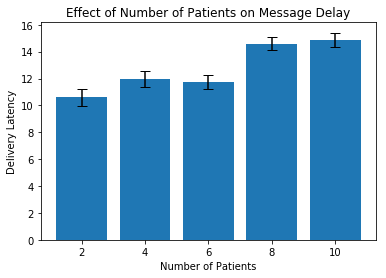
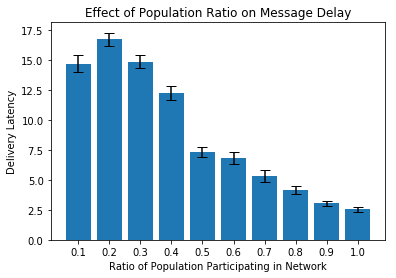
Figures 2a and 2b, give insight on the scalability of each network configuration when 30% of the population participates in an intermediary network. The results show that an optimal delivery rates of 38.7% – 100% can be achieved within message delivery latencies of 4 and 17 hours. Further, one sees that increasing the number of intermediary nodes exponentially reduces the delay while increasing the number of patients linearly increases the message delivery latency.
5. Discussion
The authors evaluate an architecture that transmits patients’ health data opportunistically until it reaches healthcare providers. The simulation results, using real-world data from Owingsville, KY, a small rural Appalachian city, have demonstrated that the proposed model is feasible and can provide a timely and reliable communication to remotely link rural patients with their providers; resulting in better quality of care. The findings show that with only 0.30 rural adult population participation, the architecture can deliver 0.91 of non-emergency medical information with an average delivery latency of 13 hours. This indicates that the architecture can work for domains in which monitoring is done on daily basis such as remotely acquired Patient Reported Outcome Measures. The network design analyzed in this study can only be used for non-time critical data.
References
- (1)
- Barua et al. (2014) Mrinmoy Barua, Xiaohui Liang, Rongxing Lu, and Xuemin Sheman Shen. 2014. RCare: Extending secure health care to rural area using VANETs. Mobile Networks and Applications 19, 3 (2014), 318–330.
- Berry et al. (2016) Leonard L Berry, Shraddha Mahesh Dalwadi, and Joseph O Jacobson. 2016. Supporting the supporters: What family caregivers need to care for a loved one with cancer. Journal of oncology practice 13, 1 (2016), 35–41.
- Bureau (2018) U.S. Census Bureau. 2018. U.S. Census Bureau QuickFacts: Bath County, Kentucky. https://www.census.gov/quickfacts/bathcountykentucky
- CDC (2017) CDC. 2017. New CDC Report shows deaths from cancer higher in rural America. Technical Report. https://www.cdc.gov/media/releases/2017/p0706-rural-cancer-deaths.html
- Cho et al. (2008) Dae-Ki Cho, Seung-Hoon Lee, Alexander Chang, Tammara Massey, Chia-Wei Chang, Min-Hsieh Tsai, Majid Sarrafzadeh, and Mario Gerla. 2008. Opportunistic medical monitoring using bluetooth P2P networks. In 2008 International Symposium on a World of Wireless, Mobile and Multimedia Networks. IEEE, 1–6.
- Doria et al. (2002) Avri Doria, Maria Uden, and Durga Prasad Pandey. 2002. Providing connectivity to the saami nomadic community. In International Conference on Open Collaborative Design for Sustainable Innovation: 01/12/2002-02/12/2002.
- Government (2014) U.S. Government. 2014. Discover U.S. Government Information: Title 42 - Public Health. https://www.govinfo.gov/content/pkg/CFR-2017-title42-vol5/xml/CFR-2017-title42-vol5-sec491-8.xml
- Henley et al. (2017) S Jane Henley, Robert N Anderson, Cheryll C Thomas, Greta M Massetti, Brandy Peaker, and Lisa C Richardson. 2017. Invasive cancer incidence, 2004–2013, and deaths, 2006–2015, in nonmetropolitan and metropolitan counties—United States. MMWR Surveillance Summaries 66, 14 (2017), 1.
- Hofferth et al. (2018) Sandra L Hofferth, Flood M Flood, and Mattthew M Sobek. 2018. American Time Use Survey Data Extract Builder: Version 2.7 [dataset]. https://doi.org/10.18128/D060.V2.7
- Jang et al. (2009) Hung-Chin Jang, Yao-Nan Lien, and Tzu-Chieh Tsai. 2009. Rescue information system for earthquake disasters based on MANET emergency communication platform. In Proceedings of the 2009 International Conference on Wireless Communications and Mobile Computing: Connecting the World Wirelessly. ACM, 623–627.
- Madamori et al. (2019) O. Madamori, E. Max-Onakpoya, C. Grant, and C. Baker. 2019. Using Delay Tolerant Networks as a Backbone for Low-Cost Smart Cities. In 2019 IEEE International Conference on Smart Computing (SMARTCOMP). IEEE, 468–471. https://doi.org/10.1109/SMARTCOMP.2019.00090
- Max-Onakpoya et al. (2019) Esther Max-Onakpoya, Aggrey Jacobs, and Corey E Baker. 2019. An Opportunistic mHealth Architecture for Remote Patient Monitoring. In Proceedings of the 20th Hotmobile. ACM, 169–169.
- Moy et al. (2017) Ernest Moy, Macarena C Garcia, Brigham Bastian, Lauren M Rossen, Deborah D Ingram, Mark Faul, Greta M Massetti, Cheryll C Thomas, Yuling Hong, Paula W Yoon, et al. 2017. Leading causes of death in nonmetropolitan and metropolitan areas–United States, 1999–2014. MMWR Surveillance Summaries 66, 1 (2017), 1.
- Murillo and Aukin (2011) Martin J Murillo and Mozafar Aukin. 2011. Application of wireless sensor nodes to a delay-tolerant health and environmental data communication system in remote communities. In 2011 IEEE Global Humanitarian Technology Conference. IEEE, 383–392.
- NIH-NCI and CDC (2019) NIH-NCI and CDC. 2019. Incidence Rate Report for Kentucky by County. https://www.statecancerprofiles.cancer.gov/incidencerates/index.php?stateFIPS=21&cancer=001&race=00&sex=0&age=001&type=incd&sortVariableName=rate&sortOrder=default#results
- Niksch et al. (2014) Alisa Niksch, Brian Rothman, Natalie Hodge, and Megan Ranney. 2014. The value of remote patient monitoring (RPM) physicians’ perspectives. Healthcare Information and Management Systems Society (HIMSS) (2014).
- Pentland et al. (2004) Alex Pentland, Richard Fletcher, and Amir Hasson. 2004. Daknet: Rethinking connectivity in developing nations. Computer 37, 1 (2004), 78–83.
- Picu et al. (2012) Andreea Picu, Thrasyvoulos Spyropoulos, and Theus Hossmann. 2012. An analysis of the information spreading delay in heterogeneous mobility DTNs. In 2012 IEEE International Symposium on a World of Wireless, Mobile and Multimedia Networks (WoWMoM). IEEE, 1–10.
- Raffelsberger and Hellwagner (2013) Christian Raffelsberger and Hermann Hellwagner. 2013. A hybrid MANET-DTN routing scheme for emergency response scenarios. In 2013 IEEE international conference on pervasive computing and communications workshops (PERCOM workshops). IEEE, 505–510.
- Rashid et al. (2005) Rb A Rashid, HS Ch’ng, MA Alias, and N Fisal. 2005. Real time medical data acquisition over wireless ad-hoc network. In 2005 Asia-Pacific Conference on Applied Electromagnetics. IEEE, 5–pp.
- Scholl et al. (2009) J Scholl, L Lambrinos, and A Lindgren. 2009. Rural telemedicine networks using store-and-forward Voice-over-IP. Studies in health technology and informatics 150 (2009), 448.
- Syed-Abdul et al. (2012) Shabbir Syed-Abdul, Jeremiah Scholl, Peisan Lee, Wen-Shan Jian, Der-Ming Liou, and Yu-Chuan Li. 2012. Study on the potential for delay tolerant networks by health workers in low resource settings. Computer methods and programs in biomedicine 107, 3 (2012), 557–564.
- U.S. Bureau of Labor Statistics retrieved from FRED (2018) Federal Reserve Bank of St. Louis U.S. Bureau of Labor Statistics retrieved from FRED. 2018. Unemployment Rate in Bath County, KY [KYBATH1URN]. https://fred.stlouisfed.org/series/KYBATH1URN
- USDA (2019) USDA. 2019. A case for rural broadband. Technical Report. United States Department of Agriculture. https://www.usda.gov/sites/default/files/documents/case-for-rural-broadband.pdf
- Whitbeck and Conan (2010) John Whitbeck and Vania Conan. 2010. HYMAD: Hybrid DTN-MANET routing for dense and highly dynamic wireless networks. Computer communications 33, 13 (2010), 1483–1492.
- Woolley (2019) Martin Woolley. 2019. Bluetooth 5: Go Faster, Go Further. Technical Report. Bluetooth SIG. https://www.bluetooth.com/bluetooth-resources/bluetooth-5-go-faster-go-further/