Defiducialization: Providing Experimental Measurements for Accurate Fixed-Order Predictions
Abstract
An experimental procedure is proposed to perform measurements of differential cross sections for vector boson production which can be compared to fixed-order QCD predictions with improved accuracy. The procedure relies on applying theoretical acceptance corrections computed as a function of the transverse momentum of the boson, , to the experimental measurement, rather than comparing data directly against fiducial fixed-order predictions. It is demonstrated that, contrary to standard fiducial computations, these acceptance factors vary little at low , so they can be reliably computed using fixed-order perturbation theory. An example analysis is performed using the ATLAS measurement of the -boson production cross section at center-of-mass energy of TeV. The resulting full phase space measurement of the cross section differential in the boson rapidity is compared to theoretical predictions computed with next-to-next-to leading-order accuracy in QCD. Further extensions of the approach which include different types of measurements and improved theoretical predictions are discussed.
I Introduction
Accurate knowledge of parton distribution functions of the proton (PDFs) is essential for the physics program at the LHC. PDF uncertainties are the leading source of systematics for precision measurements of the -boson mass and effective weak mixing angle, Aaboud:2017svj ; Sirunyan:2018swq . Reduction of the PDF uncertainties is important in particular for the interpretation of high statistics measurements for the future LHC data.
PDFs can be constrained using - and -boson production in the charged and neutral current Drell-Yan processes. These processes can be measured with sub-percent experimental accuracy and thus provide a valuable input for the PDF determination. An example of an accurate measurement is the ATLAS result on - and -boson production at the center-of-mass energy of TeV Aaboud:2016btc . For the boson, the measurement is performed in bins of the invariant mass of the lepton pair, , and of the lepton pair rapidity, . For the boson, the results are reported as a function of the lepton pseudorapidity, . Excluding the global normalisation uncertainty, the measurement reaches better than experimental uncertainty.
The cross sections differential in , and are known at next-to-next-to leading-order (NNLO) accuracy in perturbative QCD Anastasiou:2003yy ; Anastasiou:2003ds ; Melnikov:2006di ; Catani:2009sm ; Catani:2010en . For these observables, the corresponding computations are inclusive in the boson transverse momentum and thus insensitive to divergences, providing a robust input for determination of collinear PDFs. However the ATLAS measurement is performed in a fiducial volume with experimental cuts on the lepton transverse momentum and lepton pseudorapidity which are required due to the detector acceptance. These selection criteria introduce dependence on modelling thereby spoiling accuracy of the fixed-order predictions. The study performed in Ref. Aaboud:2016btc shows that predictions become unstable with respect to small variations of the cuts. In addition, calculations obtained using various public NNLO codes differ as much as which is significant compared to the experimental accuracy.
The impact of the fiducial cuts on fixed-order predictions is under investigation since some time. It is known to be large when transverse momentum of individual leptons (or jets) approaches half of the invariant mass of the lepton pair (or jet pair). It has been proposed in Ref. Frixione:1997ks to introduce an asymmetry for the cut values for the leading and sub-leading objects. This procedure seems to stabilize the computation of the fixed-order predictions with respect to small variation of experimental cuts, however a closer analysis shows that it does not eliminate the uncertainty arising from the logarithmic corrections which remains similar to the symmetric cuts cases Salam? . Computation of higher order corrections and/or inclusion of the resummation should reduce the uncertainty arising from the fiducial cuts. However the full next-to-next-to-next-to leading-order (N3LO) corrections for Drell-Yan processes are not available yet, while resummation corrections may bring additional uncertainties from the recoil prescription Catani:2015vma .
Experimentally, it is sometimes possible to isolate regions in the phase space which are not affected by fiducial cuts. For example, in Ref. Aaboud:2017ffb the fiducial acceptance for the triple differential measurement of , where is the lepton polar angular variable, is above for , and GeV Walker:2019bjd . This region can be safely compared to fixed-order predictions. Other experimental methods include explicit correction to the full phase space during the data analysis, as in e.g. Ref. Aaltonen:2011nr .
In this paper, another approach is proposed. It is based on an observation that an acceptance correction from the fiducial to full phase space has moderate dependence on , including low region, as discussed in section II, so that it can be determined using fixed-order calculations. This is demonstrated in section III using the ATLAS measurement of -boson production differential in and performed using data collected at TeV Aad:2015auj . The acceptance correction is computed at NLO for the plus jet process (, where is the strong coupling constant), using the MCFM v6.8 program Campbell:1999ah , interfaced to APPLGRID Carli:2010rw . In section IV, the correction is used to determine the full phase space measurement differential in and . The result is integrated in and the inclusive differential cross-section measurement is compared to the NNLO () computation for inclusive -boson production obtained using the MCFM v9 program Boughezal:2016wmq ; Campbell:2019dru . To illustrate the importance of the acceptance effects, another comparison is performed in which the fiducial data are integrated in directly and compared to the fiducial predictions computed to the same order. While these two comparisons are performed at the same accuracy of the fixed order predictions in , a visible difference is observed with the approach advocated in this paper giving a better overall description of the data. The paper concludes with a discussion of the results, possible applications of the method to other measurements, and possible further studies of theoretical predictions.
II Formalism
Recent experimental measurements are usually reported in a fiducial phase space, as determined by the acceptance of the experimental apparatus. This phase space is defined by selection criteria applied to the final state objects, such as lepton transverse momenta and pseudorapidities. The presence of experimental cuts must be addressed by the theory predictions. In the currently adopted procedure, the theoretical predictions are extended to be fully differential, to match the data, so that they can be also computed in the fiducial phase space. This procedure is also adapted for predictions computed using fixed-order calculations. Schematically, the theory to data comparison for integrated observables can be written in this case as
| (1) |
Here a vector boson transverse meomentum dependent fiducial acceptance is introduced as .
Fixed-order predictions for the cross sections become unreliable at low , varying rapidly as . On the other hand, is expected to have only a moderate dependence on , driven by the changes of the boost and polarisation. In general, is not expected to be constant and deviations in distribution at low may lead to a bias in .
For experimental measurements which are performed differentially in , the comparison between data and theory can be re-arranged such that the data are corrected to the full phase space first, which is the central proposal of this paper:
| (2) |
The main advantage of this approach is that the fully integrated in can be computed safely using fixed-order predictions. As it will be illustrated in the following, for -boson production, can be also estimated using fixed-order plus jet calculations, including the low region. The success of this approach relies on smallness of variation at low , which is caused mainly by kinematic effects, while polarisation effects are suppressed at low as , where is the -boson mass.
To motivate why this would be the case, it is instructive to decompose the differential cross section in terms of harmonic polynomials, as discussed, for example, in Ref. Gauld:2017tww . The fully differential -boson production cross section can be expressed as
| (3) |
Here is the lepton azimuthal angular variable, are the nine harmonic polynomials, and is the unpolarised cross section. The harmonic polynomials depend on eight angular coefficients which define fractions of helicity cross sections with respect to the unpolarised case. Equation 3 relies on factorization of the boson production and decay processes. In essence, it represents production of a spin one particle and its following decay. It is violated by electroweak corrections which contain interaction of the initial quarks and final state leptons. It is also modified for the scattering process. These corrections are small at the -pole region and neglected in the following, however it is possible to extend the proposed procedure and include them.
For the measurements insensitive to the azimuthal angle and forward-backward asymmetry in , the most important coefficient is . This is the case for all fiducial measurements of -boson production at the LHC, which use charge-symmetric cuts on lepton rapidities. The coefficient vanishes for and saturates at for GeV.
To understand better the dependence of the angular coefficients , and of the most important coefficient in particular, it is useful to follow the geometrical approach of Refs. Peng:2015spa ; Chang:2017kuv . For the coordinate system in which the -axis is aligned with the momentum direction of the pair producing the boson, , as follows from helicity conservation arguments. The direction of the -axis in this coordinate system depends on radiation and in general does not agree with the -axis of the fixed physical rest frame, such as given by the direction of the incoming hadrons (laboratory frame). Defining as the angle between the two axes, it can be shown based on simple geometrical arguments that can be calculated as where the average is taken over all event configurations. Given that for small , the coefficient is expected to vanish as for .
The coefficients can be calculated using fixed-order predictions. It is possible that the coefficient is sensitive to non-perturbative effects at low Chiappetta:1986yg , however this should have a small impact on the acceptance. It was demonstrated in Ref. Gauld:2017tww which compared predictions for the coefficients to the data obtained by the ATLAS and CMS collaborations Khachatryan:2015paa ; Aad:2016izn . The calculations were performed at LO (), NLO () and NNLO () order for the -boson plus jet process, as provided by the NNLOJET program Ridder:2015dxa . For the coefficient , good perturbative convergence is observed with already LO predictions being in excellent agreement with the data as shown in Ref. Aad:2016izn for down to GeV 111Note that Aad:2016izn counts order of the predictions based on inclusive production, with NLO corresponding to correction.
Given the values and the coefficients, the kinematics of the final state leptons and thereby the fraction of events passing fiducial cuts is fully determined. Any fixed-order prediction for the boson plus jet process must obey decomposition of equation 3. Therefore, the fiducial acceptance for each bin can be determined at fixed order, provided it is narrow enough to neglect the dependence inside the bin. The residual theoretical uncertainties arising in this procedure can be estimated the usual way, by PDF and scale variations.
An estimate of the uncertainty based on the scale variation may not be perfect, especially for the quantities computed as ratios of cross sections. An attempt to improve it by a partial decorrelation is used in the current analysis, however it may be still incomplete. It is also possible that coefficients may be affected significantly by the resummation effects, but study of these is beyond the scope of the current paper. Further studies may bring additional insights on this issue. It should be noted, however, that fixed order analyses usually ignore uncertainties from fiducial acceptance effects altogether.
III Validation
The correction procedure is tested using the ATLAS data at TeV Aad:2015auj . The cross sections in this analysis are measured differentially in and for the GeV invariant mass range. There are variable-size bins in , starting with narrow GeV bins for low and ending with a wide GeV bin from to GeV. The bins in are equidistant spanning from to with a step of . The measurement is performed in the fiducial space defined by the lepton transverse momentum GeV and requirements. All data tables are taken from the HEPDATA record of the ATLAS publication. Following Refs. Aaboud:2016hhf ; Aaboud:2016zpd , the measurement is re-scaled by the original and updated luminosity ratio: . The total normalization uncertainty of the measurement is .
III.1 Estimation of at LO and NLO
The fiducial acceptance is estimated using the MCFM v6.8 program interfaced to APPLGRID, for fast evaluation of theoretical uncertainties. The plus jet process is computed at LO and NLO yielding acceptance estimates and , respectively. It is also possible to use NNLO calculations for the plus jet process which became available recently Ridder:2016rzm , however they are not used in the present analysis. Note that in order of , the NLO calculations for the plus jet process match NNLO calculations for inclusive -boson production.
The renormalization and factorization scales are set to and the CT14NNLO PDF set Dulat:2015mca is used for the calculations. The jet transverse momentum is required to be above GeV. The APPLGRID is binned in the -boson transverse momentum and rapidity, following the binning used in the ATLAS measurement. Note that while at NLO jet and -boson transverse momenta do not agree, the GeV jet transvserse momentum cut has no impact for the bins with the -boson GeV.
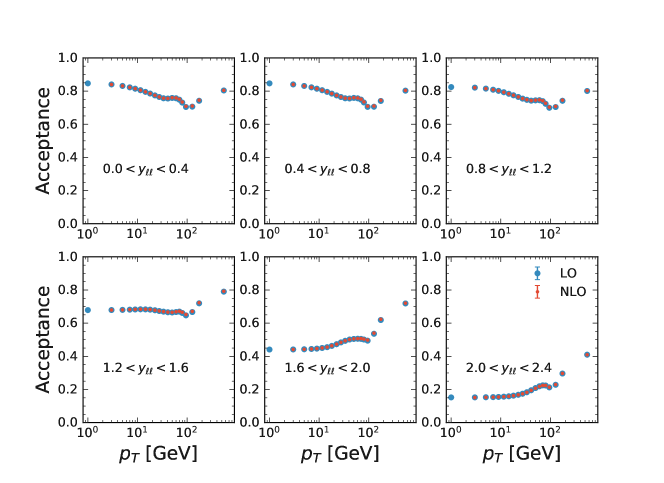
The resulting fiducial acceptance is shown in Figure 1. The statistical uncertainties for the LO calculations are negligible and for NLO they are below for the majority of the bins. To achieve this accuracy, computational resources of about CPU hours are required.
The fiducial acceptance is very similar for the three central rapidity bins with and it is always above 70%. For the forward rapidity, the acceptance starts to decrease and drops below for the bin at low . The dependence of the acceptance is also different for forward compared to central rapidities. The first bin in spans between and GeV and NLO calculations of the acceptance become unstable, thus only the LO result is presented. For all other bins, LO and NLO calculations agree very well.
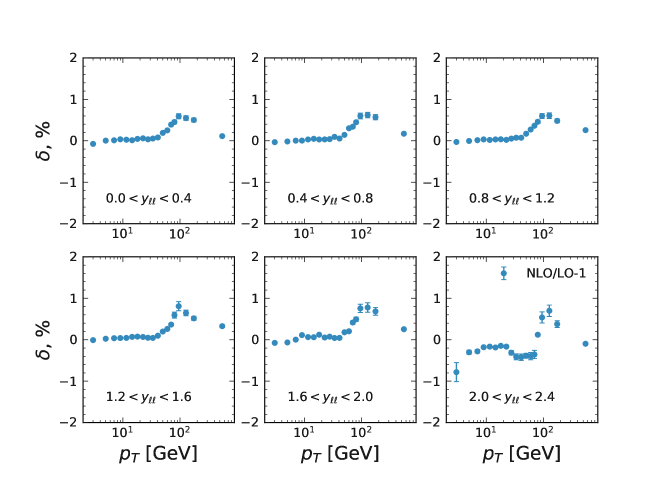
Figure 2 presents quantitative comparison of the acceptances computed at different orders in terms of . The NLO correction is below for for all rapidity bins with . For all bins the correction does not exceed , indicating good convergence of the perturbative series. Based on this good agreement and moderate dependence of the correction on , the correction for the bin GeV is estimated using LO calculation, re-scaled by the ratio of NLO to LO for the bin GeV.
Moderate variation of the estimated fiducial acceptance as a function of and very good agreement of predictions computed at LO and NLO provide good confidence that fixed-order predictions can be safely used. Additional support comes from the studies of the angular coefficient at NNLO Ridder:2015dxa , mentioned above, which indicate good perturbative convergence. Note, however, that good perturbative convergence does not necessarily lead to small theoretical uncertainties and furhter in-depth theoretical studies are required to fully validate this proposal. With these observations, the analysis proceeds to an estimate of the uncertainties for the NLO-based predictions.
III.2 Estimation of uncertainties
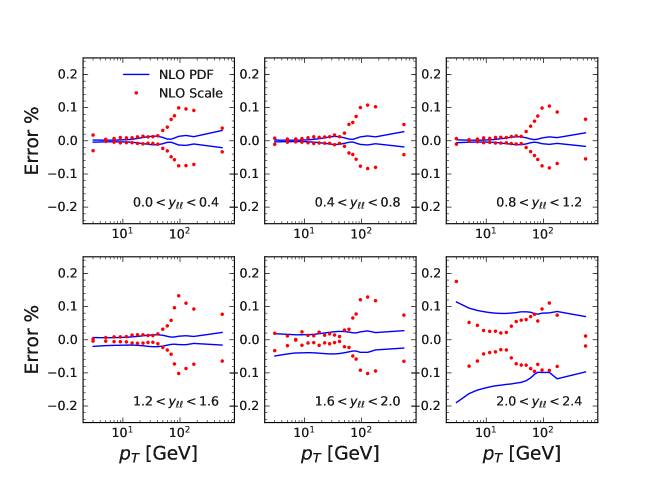
PDF and scale uncertainties of the acceptance computed at NLO are shown in Figure 3. The PDF uncertainties are evaluated using the CT18ANNLO set Hou:2019qau ; Hou:2019efy scaled to c.l. The scale uncertainties are estimated by varying factorization and renormalization scale by factor of two and taking the envelope of resulting acceptance factors. Both PDF and scale uncertainties evaluated this way are typically below . The PDF uncertainties increase to about for the highest rapidity bin. As an additional check of the PDF dependence, the acceptance is calculated using CT14NNLO, MMHT14NNLO Harland-Lang:2014zoa , NNPDF31 Ball:2017nwa , ABMP16 Alekhin:2017kpj and ATLASepWZ16 Aaboud:2016btc PDF sets. For all sets except ATLASepWZ16, the calculated acceptance is found to be within the the PDF error bands of the CT18ANNLO set. The ATLASepWZ16 based acceptance agrees with the other sets for . For the highest rapidity bin, the acceptance based on ATLASepwz16 deviates by as much as for low and up to for around . No additional uncertainty is introduced due to this deviation.
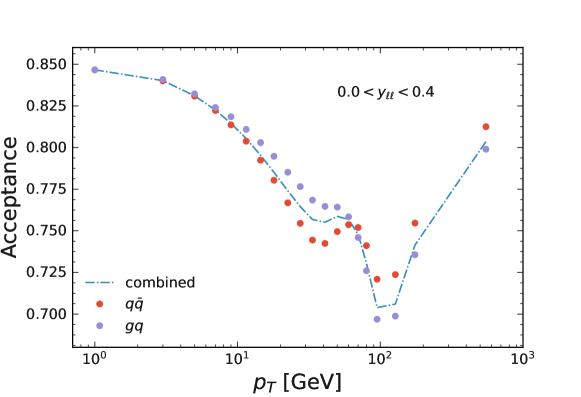
The smallness of the uncertainties is related to the fact that the main effect is purely kinematic variation of the fiducial acceptance as a function of and theoretical uncertainties arise only from modeling of the polarisation. To gain some insight on polarisation uncertainties, one can again follow the intuitive geometrical approach of Refs. Peng:2015spa ; Chang:2017kuv . For the predictions at LO, the contributions from and subprocesses lead to different average mis-alignment angle yielding in different . It is shown in Refs. Peng:2015spa ; Chang:2017kuv that the polarisation coefficients observed in data do indeed lie between the two predictions. APPLGRID based calculations allow to separate contributions of and subprocesses, fiducial acceptances for which can be compared to the full result. The resulting comparison is shown in Figure 4 for . Scale variations yield only to small changes of the acceptances of the individual contributions, and a common scale variation for both of them yields to a moderate change in their relative size. This may explain the smallness of the acceptance uncertainty due to the scale variation seen in Figure 3. It is possible that higher order corrections may have different impact on and subprocesses, and to be conservative the scale variations are considered as independent for them with the total scale uncertainty evaluated as a sum in quadrature. The resulting uncertainty is shown in Figure 5 is always larger compared to the standard approach shown in Figure 3.
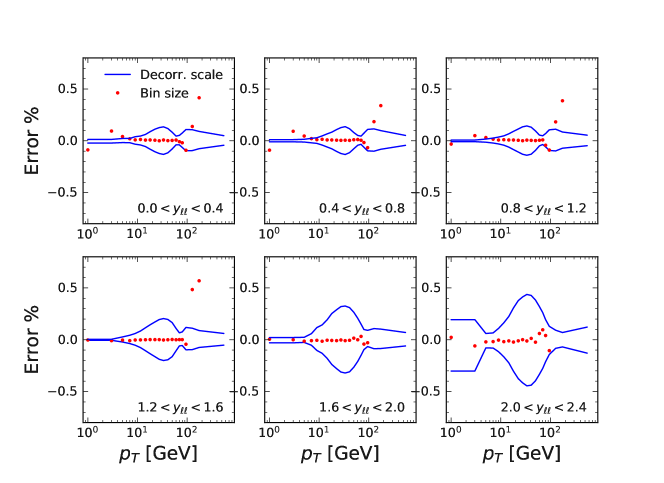
As it is mentioned above, the difference in distribution between the data and predictions should not matter for fiducial acceptance estimation, as long as bin sizes are small enough such that variation of the acceptance within the bin can be neglected. The bins are however rather large in this analysis compared to variations of the acceptance at low , see Figure 1. There is also a large difference between data and fixed order predictions at low . The effect of acceptance variation within the bin is studied at LO. Predictions are generated from GeV, GeV, and GeV with GeV, GeV, and GeV bin size, respectively. For these bin sizes the variation of the fiducial acceptance can be neglected since it is much smaller compared to the data statistical uncertainty for the corresponding enclosing analysis bins. The full phase-space distribution is then reweighted to follow one estimated in the data. The latter is approximated by first correcting the measured result to the full phase space using acceptance as in Figure 1 and then fitting by a phenomenological function with and treated as free parameters. The fits are performed in each bin independently. The function describes the data well for the whole range. Its shape is very different from the fixed order predictions for GeV with . The reweighted full-phase space distribution is corrected for the fiducial acceptance in GeV bins. The resulting fiducial and full phase-space distributions are integrated following the analysis binning and the binned fiducial acceptance is determined from their ratio. For the lowest GeV bin, the fixed order distributions are integrated starting form GeV, to emulate the analysis procedure, while the reweighted distributions are integrated from GeV with fiducial acceptance for GeV estimated using a linear extrapolation.
The difference between acceptances determined using reweighted and original LO distribution is taken as systematic uncertainty which is shown in Figure 5. The uncertainty reaches about for the two lowest bins for , where variation of the acceptance is significant. The uncertainty for the lowest bin is reduced by using GeV for the fixed order predictions. For GeV, the uncertainty starts to increase and reaches few percent level, however it remains smaller than the statistical uncertainty of the data.
To summarise the study of uncertainties, the largest effect arises from the decorrelated scale variation (up to for ) followed by PDFs (up to for ). The bin-size effects remain below for the bulk of the distribution. It should be noted, however, as it was already discussed, that the current analysis ignores the effect of electroweak corrections and potential resummation effects.
IV Application and Results
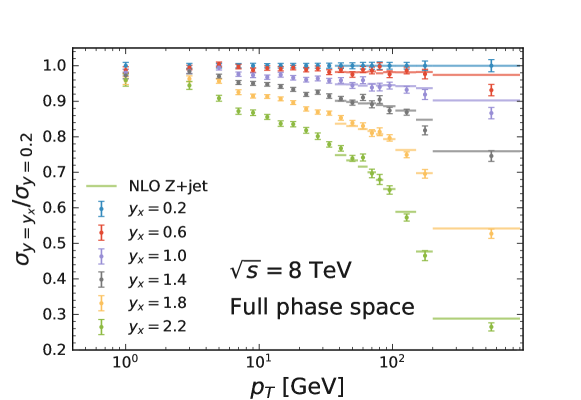
With the caveat discussed above that the estimate may be not complete, the size of the theoretical uncertainties on the acceptance corrections suggests that it is possible to proceed with applying them to the data. Figure 6 shows the ratio of the distributions corrected to the full phase space for a given bin to the most central bin. The ratio is close to one for small decreasing almost linearly for large and large . For GeV, the data are compared to fixed-order predictions at NLO for the -boson plus jet process computed using the same APPLGRID as for the acceptance correction which is convoluted with the CT14NNLO PDF set. The data and predictions are found to be in reasonable agreement.
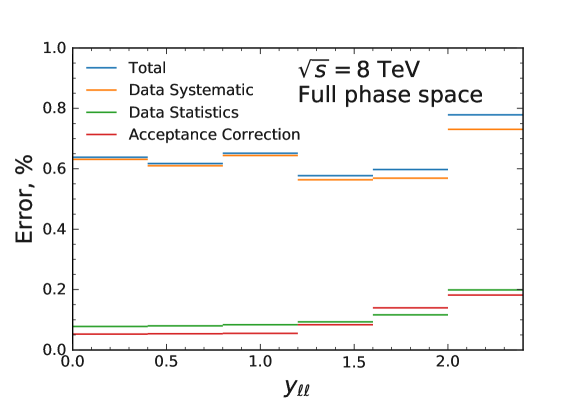
As the next step the data are integrated in . The correlated uncertainties are propagated linearly while the statistical uncertainties are combined in quadrature. The uncertainty decomposition is shown in figure 7. The uncertainties are dominated by the correlated experimental errors. The statistical uncertainties are at around except the highest rapidity bin. The acceptance correction uncertainties are comparable to the statistical uncertainties.
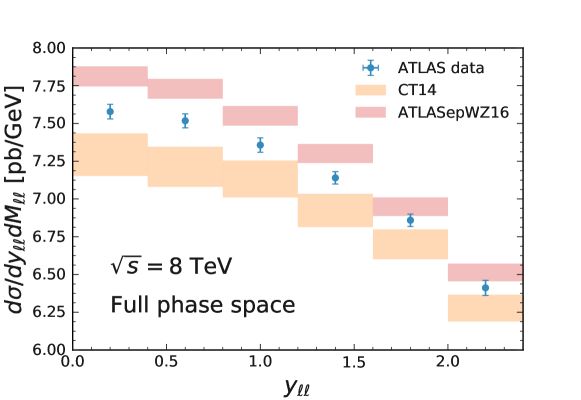
The measurements are compared to NNLO predictions obtained using the MCFM v9 program. Two PDF sets are used for the comparison: CT14NNLO and ATLASepWZ16. CT14NNLO is representative of other global PDF sets with reduced compared to and strange-quark distribution. ATLASepWZ16, on the other hand, is obtained by fitting the ATLAS fiducial data at TeV from Ref. Aaboud:2016btc and has enhanced strangeness. The MCFM program is used with nominal settings, electroweak corrections disabled, and scales set to . The central value of the total cross section for TeV and GeV obtained for the CT14NNLO PDF set is pb, which is larger than the value of pb obtained in Ref. Aaboud:2016zpd using the DYTURBO program Camarda:2019zyx .
The comparison between the full phase space measurement of at TeV and predictions is shown in figure 8. The global normalization uncertainty of is omitted from the figure and the predictions are shown with PDF uncertainties only. The uncertainties are larger for the CT14NNLO compared to ATLASepWZ16-EIG PDF set due to usage of increased tolerance factors compared to the criterion adapted for the ATLASepWZ16-EIG set. The predictions based on CT14NNLO (ATLASepWZ16) underestimate (overestimate) the data. Given the significant global normalization uncertainty the difference is however not significant.
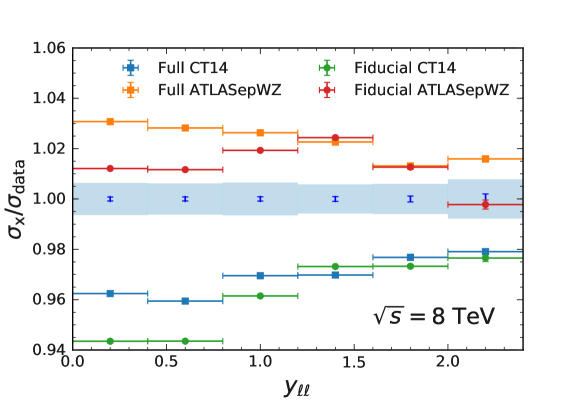
More quantitatively, the comparison can be performed by taking ratios of the predictions to the data. It is also interesting to compare the ratios of the full cross sections to the ratios of the fiducial cross sections, to see the impact of the -dependent acceptance corrections. The fiducial cross section in data is computed by simple integration over the differential cross section. It is verified that the total fiducial cross section agrees with the one reported in the ATLAS publication. The NNLO predictions are obtained using the MCFM v9 program with fiducial cuts enabled. The resulting full and fiducial cross-section ratios for the two PDF sets are shown in figure 9. For the CT14NNLO based prediction, the ratio of the full phase space cross sections is closer to the unity compared to the ratio of the fiducial cross sections. The dependence of the ratio on is also reduced significantly. For the ATLASepWZ16 based prediction, the fiducial ratio is closer to unity, which is not too surprising since the set is fitted to the fiducial ATLAS measurement at TeV. The difference between full and fiducial ratios is similar for both predictions for the five bins. For the first three bins the fiducial ratio is lower than the full one, by as much as , for the two lowest bins. For bins with , they roughly agree. For the highest rapidity bin, the behavior is different depending on the PDF set. For the CT14NNLO based prediction the two ratios agree while for the ATLASepWZ16 based prediction the fiducial ratio is below the full one by almost .
For the full phase space comparison based on the CT14NNLO and ATLASepWZ16 sets, the ratios of show opposite trend as a function of . Given that the strange-quark distribution affects low rapidity region more, based on this observation, it is possible to make a conjecture that the ATLAS data may prefer somewhat larger strangeness content than in the CT14NNLO set and somewhat smaller than in the ATLASepWZ16 set. The overshoot of the predictions based on the ATLASepWZ16 set is likely to be caused by the bias in the fiducial NNLO prediction which was used in the analysis of the ATLAS data at TeV.
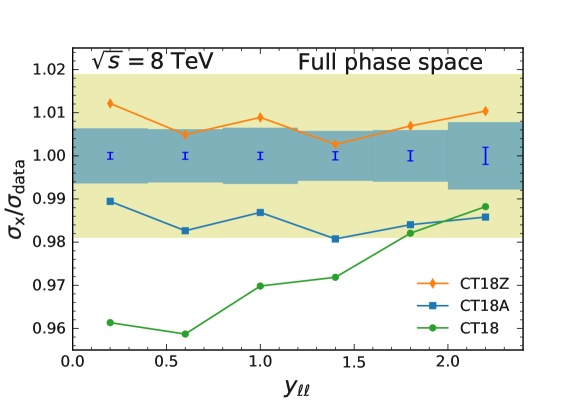
To check this, predictions based on CT18NNLO, CT18ANNLO and CT18ZNNLO PDF sets Hou:2019qau ; Hou:2019efy are compared to the data in the full phase space. The results are shown in figure 10. Compared to the CT18NNLO set, both CT18ANNLO and CT18ZNNLO sets include the ATLAS data at TeV. As a result, the CT18ANNLO and CT18ZNNLO sets have an enhanced strange-quark distribution, with no suppression compared to other light quarks for Bjorken . The enhancement is however smaller compared to the ATLASepWZ16 set since the CT18 sets use other data which favor smaller strangeness. The strange-quark distribution in CT18NNLO is similar to CT14NNLO. The CT18ANNLO set in addition uses a charm-quark mass that is increased compared to other PDF sets. This leads to suppression of the charm-quark contribution, compensated by an increase of the light-quark sea, yielding in turn an increase of the Drell-Yan cross sections at the LHC, as it was demonstrated in Ref. Abramowicz:1900rp . The predictions based on the CT18ANNLO and CT18ZNNLO sets show better agreement with the ATLAS data compared to those based on the CT18NNLO set: the ratio shows no dependence on and the overall normalisation of the ratio is closer to unity.
V Discussion
In the discussion above, it is argued that for comparison of fixed-order predictions with data, it is better to use full (equation 2) instead of fiducial (equation 1) cross sections. Both formula require accurate prediction for the acceptance , however equation 2 does not require accurate modeling of the distribution by the prediction.
The accuracy of the fixed order predictions for may be improved further by using existing higher order calculations. Furthermore, electroweak corrections should be included as well. Comparison of computed using pure fixed order predictions and ones which include resummation effects can be used to quantify importance of the latter for the data analysis. If needed, the PDF uncertainty can be reduced further, by using the same PDF in the calculation of and . This could be relevant for PDF fits in particular and can be arranged without difficulty since the PDF-dependent acceptance can be computed using exact and fast methods such as APPLGRID.
The method is applicable to the measurements differential in the boson transverse momentum . It is natural for -boson production, but can be extended for the boson too. Given that has only mild variation at low (see figure 1), it is probably possible to use coarser binning, which is required by the experimental resolution. Since the rapidity of the boson can not be reconstructed, this may lead to increased PDF dependence of the acceptance correction factor, requiring its update when performing comparisons for predictions based on different PDFs. Studies of the defiducialization method for -boson production are however beyond the scope of the current analysis and they await for experimental measurements, such as of the lepton pseudorapidity distribution, reported in bins of the -boson transverse momentum.
VI Summary
In summary, a method is proposed to perform comparisons of experimental data on Drell-Yan production, performed in fiducial phase space, and fixed-order QCD predictions with improved accuracy. The method requires the data to be measured differentially in the boson transverse momentum in addition to other variables of interest such as and . It relies on the ability to calculate the fiducial acceptance correction for a given value at fixed order. The method should be extended in future by inclusion of electroweak corrections and estimation of resummation effects.
The method is applied to the ATLAS -boson production data at a center-of-mass energy of TeV. The data are integrated in and compared to the NNLO predictions. To check impact of the new approach, the comparison is also performed using fiducial cross sections. A significant, compared to experimental uncertainties, improvement in the data description by the predictions based on CT14NNLO set is observed when performing comparison in the full phase space.
VII Acknowledgements
The author would like to thank Simone Amoroso, Ludovica Aperio Bella, Maarten Boonenkamp, Stefano Camarda, and Jan Kretzschmar for discussions and comments to the paper draft.
References
References
- (1) ATLAS Collaboration, M. Aaboud et al., Measurement of the -boson mass in pp collisions at TeV with the ATLAS detector, Eur. Phys. J. C78 (2018) no. 2, 110, arXiv:1701.07240 [hep-ex]. [Erratum: Eur. Phys. J.C78,no.11,898(2018)].
- (2) CMS Collaboration, A. M. Sirunyan et al., Measurement of the weak mixing angle using the forward-backward asymmetry of Drell-Yan events in pp collisions at 8 TeV, Eur. Phys. J. C78 (2018) no. 9, 701, arXiv:1806.00863 [hep-ex].
- (3) ATLAS Collaboration, M. Aaboud et al., Precision measurement and interpretation of inclusive , and production cross sections with the ATLAS detector, Eur. Phys. J. C77 (2017) no. 6, 367, arXiv:1612.03016 [hep-ex].
- (4) C. Anastasiou, L. J. Dixon, K. Melnikov, and F. Petriello, Dilepton rapidity distribution in the Drell-Yan process at NNLO in QCD, Phys. Rev. Lett. 91 (2003) 182002, arXiv:hep-ph/0306192 [hep-ph].
- (5) C. Anastasiou, L. J. Dixon, K. Melnikov, and F. Petriello, High precision QCD at hadron colliders: Electroweak gauge boson rapidity distributions at NNLO, Phys. Rev. D69 (2004) 094008, arXiv:hep-ph/0312266 [hep-ph].
- (6) K. Melnikov and F. Petriello, The boson production cross section at the LHC through , Phys. Rev. Lett. 96 (2006) 231803, arXiv:hep-ph/0603182 [hep-ph].
- (7) S. Catani, L. Cieri, G. Ferrera, D. de Florian, and M. Grazzini, Vector boson production at hadron colliders: a fully exclusive QCD calculation at NNLO, Phys. Rev. Lett. 103 (2009) 082001, arXiv:0903.2120 [hep-ph].
- (8) S. Catani, G. Ferrera, and M. Grazzini, W Boson Production at Hadron Colliders: The Lepton Charge Asymmetry in NNLO QCD, JHEP 05 (2010) 006, arXiv:1002.3115 [hep-ph].
- (9) S. Frixione and G. Ridolfi, Jet photoproduction at HERA, Nucl. Phys. B507 (1997) 315–333, arXiv:hep-ph/9707345 [hep-ph].
- (10) G. Salam, Thoughts on QCD for Run 2, https://gsalam.web.cern.ch/gsalam/talks/repo/2015-02-ATLAS-Annecy-ATLAS-Salam.pdf.
- (11) S. Catani, D. de Florian, G. Ferrera, and M. Grazzini, Vector boson production at hadron colliders: transverse-momentum resummation and leptonic decay, JHEP 12 (2015) 047, arXiv:1507.06937 [hep-ph].
- (12) ATLAS Collaboration, M. Aaboud et al., Measurement of the Drell-Yan triple-differential cross section in collisions at TeV, JHEP 12 (2017) 059, arXiv:1710.05167 [hep-ex].
- (13) D. M. Walker, Higher Order QCD Corrections to Electroweak Boson Production at Colliders. PhD thesis, Durham U., 2019. http://etheses.dur.ac.uk/13284/.
- (14) CDF Collaboration, T. Aaltonen et al., First Measurement of the Angular Coefficients of Drell-Yan pairs in the Z Mass Region from Collisions at = 1.96 TeV, Phys. Rev. Lett. 106 (2011) 241801, arXiv:1103.5699 [hep-ex].
- (15) ATLAS Collaboration, G. Aad et al., Measurement of the transverse momentum and distributions of Drell–Yan lepton pairs in proton–proton collisions at TeV with the ATLAS detector, Eur. Phys. J. C76 (2016) no. 5, 291, arXiv:1512.02192 [hep-ex].
- (16) J. M. Campbell and R. K. Ellis, An Update on vector boson pair production at hadron colliders, Phys. Rev. D60 (1999) 113006, arXiv:hep-ph/9905386 [hep-ph].
- (17) T. Carli, D. Clements, A. Cooper-Sarkar, C. Gwenlan, G. P. Salam, F. Siegert, P. Starovoitov, and M. Sutton, A posteriori inclusion of parton density functions in NLO QCD final-state calculations at hadron colliders: The APPLGRID Project, Eur. Phys. J. C66 (2010) 503–524, arXiv:0911.2985 [hep-ph].
- (18) R. Boughezal, J. M. Campbell, R. K. Ellis, C. Focke, W. Giele, X. Liu, F. Petriello, and C. Williams, Color singlet production at NNLO in MCFM, Eur. Phys. J. C77 (2017) no. 1, 7, arXiv:1605.08011 [hep-ph].
- (19) J. Campbell and T. Neumann, Precision Phenomenology with MCFM, JHEP 12 (2019) 034, arXiv:1909.09117 [hep-ph].
- (20) R. Gauld, A. Gehrmann-De Ridder, T. Gehrmann, E. W. N. Glover, and A. Huss, Precise predictions for the angular coefficients in Z-boson production at the LHC, JHEP 11 (2017) 003, arXiv:1708.00008 [hep-ph].
- (21) J.-C. Peng, W.-C. Chang, R. E. McClellan, and O. Teryaev, Interpretation of Angular Distributions of -boson Production at Colliders, Phys. Lett. B 758 (2016) 384–388, arXiv:1511.08932 [hep-ph].
- (22) W.-C. Chang, R. E. McClellan, J.-C. Peng, and O. Teryaev, Dependencies of lepton angular distribution coefficients on the transverse momentum and rapidity of bosons produced in collisions at the LHC, Phys. Rev. D 96 (2017) no. 5, 054020, arXiv:1708.05807 [hep-ph].
- (23) P. Chiappetta and M. Le Bellac, Angular Distribution of Lepton Pairs in Drell-Yan Like Processes, Z. Phys. C32 (1986) 521.
- (24) CMS Collaboration, V. Khachatryan et al., Angular coefficients of Z bosons produced in pp collisions at = 8 TeV and decaying to as a function of transverse momentum and rapidity, Phys. Lett. B750 (2015) 154–175, arXiv:1504.03512 [hep-ex].
- (25) ATLAS Collaboration, G. Aad et al., Measurement of the angular coefficients in -boson events using electron and muon pairs from data taken at TeV with the ATLAS detector, JHEP 08 (2016) 159, arXiv:1606.00689 [hep-ex].
- (26) A. Gehrmann-De Ridder, T. Gehrmann, E. W. N. Glover, A. Huss, and T. A. Morgan, Precise QCD predictions for the production of a Z boson in association with a hadronic jet, Phys. Rev. Lett. 117 (2016) no. 2, 022001, arXiv:1507.02850 [hep-ph].
- (27) ATLAS Collaboration, M. Aaboud et al., Luminosity determination in pp collisions at = 8 TeV using the ATLAS detector at the LHC, Eur. Phys. J. C76 (2016) no. 12, 653, arXiv:1608.03953 [hep-ex].
- (28) ATLAS Collaboration, M. Aaboud et al., Measurements of top-quark pair to -boson cross-section ratios at TeV with the ATLAS detector, JHEP 02 (2017) 117, arXiv:1612.03636 [hep-ex].
- (29) A. Gehrmann-De Ridder, T. Gehrmann, N. Glover, A. Huss, and T. A. Morgan, NNLO QCD corrections for boson plus jet production, PoS RADCOR2015 (2016) 075, arXiv:1601.04569 [hep-ph].
- (30) S. Dulat, T.-J. Hou, J. Gao, M. Guzzi, J. Huston, P. Nadolsky, J. Pumplin, C. Schmidt, D. Stump, and C. P. Yuan, New parton distribution functions from a global analysis of quantum chromodynamics, Phys. Rev. D93 (2016) no. 3, 033006, arXiv:1506.07443 [hep-ph].
- (31) T.-J. Hou et al., Progress in the CTEQ-TEA NNLO global QCD analysis, arXiv:1908.11394 [hep-ph].
- (32) T.-J. Hou et al., New CTEQ global analysis of quantum chromodynamics with high-precision data from the LHC, arXiv:1912.10053 [hep-ph].
- (33) L. A. Harland-Lang, A. D. Martin, P. Motylinski, and R. S. Thorne, Parton distributions in the LHC era: MMHT 2014 PDFs, Eur. Phys. J. C75 (2015) no. 5, 204, arXiv:1412.3989 [hep-ph].
- (34) NNPDF Collaboration, R. D. Ball et al., Parton distributions from high-precision collider data, Eur. Phys. J. C77 (2017) no. 10, 663, arXiv:1706.00428 [hep-ph].
- (35) Alekhin, S. and Blümlein, J. and Moch, S. and Placakyte, R., Parton distribution functions, , and heavy-quark masses for LHC Run II, Phys. Rev. D96 (2017) no. 1, 014011, arXiv:1701.05838 [hep-ph].
- (36) S. Camarda et al., DYTurbo: fast predictions for Drell–Yan processes, Eur. Phys. J. C 80 (2020) no. 3, 251, arXiv:1910.07049 [hep-ph]. [Erratum: Eur.Phys.J.C 80, 440 (2020)].
- (37) H1, ZEUS Collaboration, H. Abramowicz et al., Combination and QCD Analysis of Charm Production Cross Section Measurements in Deep-Inelastic ep Scattering at HERA, Eur. Phys. J. C73 (2013) no. 2, 2311, arXiv:1211.1182 [hep-ex].