Influence of Vacancy Defect in Solid High-Order Harmonic Generation
Abstract
The present work discusses the impact of vacancy defects in solid high-order harmonic generation. The total energy cut off of the high-order harmonic spectrum increases as a function of concentration of vacancy defect, and the total spectrum gradually turns into a single slanted spectrum without having an abrupt transition between primary and secondary plateaus. The spectral intensity of the below band-gap harmonics in a solid with vacancy defects is enhanced significantly in comparison to the harmonics in a pristine solid. The changes in the harmonic spectra are understood in terms of their effective band structures. The presence of vacancy defects breaks the translational symmetry of the unit cell locally. As a consequence of this, new defect states appear, which open additional paths for the electron dynamics. The ill-resolved electron trajectories in the Gabor profile confirm the interference of additional paths. Moreover, the single slanted high-order harmonic spectrum carries a unique signature of vacancy defects in comparison to the high-order harmonic spectrum corresponding to solids with defects such as underdoping or overdoping.
I Introduction
High-order harmonic generation (HHG) is a process in which a strong laser pulse interacts with gaseous atoms or molecules and electromagnetic radiation, consisting of higher-order harmonics of the driving laser pulse, is emitted as an outcome of this interaction Ferray et al. (1988). The underlying physical mechanism of HHG is well understood by the semiclassical three-step model Corkum (1993). HHG in a gaseous medium offers the route to generate attosecond pulses Bartels et al. (2002); Sansone et al. (2006); Paul et al. (2001) as well as to interrogate electron and nuclear dynamics in atoms and molecules on their natural timescales Krausz and Ivanov (2009); Smirnova et al. (2009); Dixit et al. (2012); Bredtmann et al. (2014); Bucksbaum (2007); Corkum and Krausz (2007); Lépine et al. (2014).
Recently, a variety of solid-state systems such as dielectrics, semiconductors, nano-structures and noble gas solids have been used to generate strong-field driven high-order harmonics of terahertz and mid-infrared driving frequencies Ghimire et al. (2011a, b); Zaks et al. (2012); Schubert et al. (2014); Vampa et al. (2015a, b); Hohenleutner et al. (2015); Luu et al. (2015); Ndabashimiye et al. (2016); You et al. (2017); Lanin et al. (2017); Sivis et al. (2017); Langer et al. (2018). In the case of HHG from solids, the harmonic cutoff linearly depends on the strength and the wavelength of the driving laser field, which is in contrast to HHG from gases where the cutoff depends quadratically on the strength and the wavelength Ghimire et al. (2011a); Ghimire et al. (2014); Wu et al. (2015); Du and Bian (2017). Moreover, the harmonic spectrum from solids consists of multiple plateaus, which extend beyond the HHG from gases Ndabashimiye et al. (2016). Higher electron density as well as periodicity make solids an ideal source for harmonic generation Luu et al. (2015); Vampa and Brabec (2017); Kruchinin et al. (2018). This offers an attractive compact table-top source for coherent and bright attosecond pulses in extreme ultraviolet (XUV) and soft x-ray energy regimes. HHG from solids is used to image energy bands Ndabashimiye et al. (2016) and to perform tomography of impurities in solids Almalki et al. (2018). Therefore, HHG from solids opens a unique avenue to probe energy structures and electron dynamics in solids at their intrinsic timescales Higuchi et al. (2014); Ghimire et al. (2014); Vampa and Brabec (2017); S. et al. (2019a); Kruchinin et al. (2018).
In general, different forms of defect such as vacancies, interstitials, impurities (donor- or acceptor-type doping), etc., are inevitably present in real solids. Understanding how different kinds of defects affect HHG in solids is an interesting and challenging problem.
Recently, several theoretical works have discussed the influence of defects on solid HHG Almalki et al. (2018); Orlando et al. (2018); Yu et al. (2019a); Huang et al. (2017). Time-dependent density functional theory in one-dimension is employed to understand HHG in donor-doped, acceptor-doped and un-doped semiconductors Yu et al. (2019a). In donor-doped solids, the highest occupied impurity orbital found to be very close to the lowest conduction band. The probability of electrons tunneling from the impurity orbital to the conduction band is high, as the tunneling rate depends on the energy band gap. In comparison to acceptor-doped and un-doped semiconductors, several orders of magnitude enhancement in the efficiency of HHG in donor-doped semiconductor has been reported Yu et al. (2019a). On the other hand, Huang et al. have investigated HHG from doped semiconductors and found that the efficiency of the second plateau from a doped semiconductor is enhanced by about three orders of magnitude in comparison to an un-doped semiconductor Huang et al. (2017). The tight-binding Hamiltonian within the two-band Anderson model with disorder is employed to understand HHG in disordered semiconductor Orlando et al. (2018). It has been shown that the disorder is the probable cause behind the experimental observation of the well-resolved harmonic peaks in the spectrum Orlando et al. (2018). Corkum and co-workers have developed a conceptual formalism for the tomographic imaging of the shallow impurities using a one-dimensional hydrogenic model Almalki et al. (2018). All of these works have shown the possible modification of high-order harmonic spectra with different kinds of substitutional impurity, while the influence of vacancy defects on the HHG is still an open problem.
In the present work, we discuss the influence of vacancy defects in solid HHG. The HHG spectra due to vacancy defects can be compared with substitutional defects such as underdoping (acceptor doping) and overdoping (donor doping). We will show that the harmonic spectra corresponding to solids with vacancy defects are significantly different from the spectra corresponding to solids with substitutional defects. The supercell approach is used to realize different concentrations of vacancy defects in solid. The time-dependent Schrodinger equation (TDSE) in the Bloch basis is solved to simulate the HHG from solids with various vacancy-defect concentrations. The present paper is organised as follows. In Sec. II, the theoretical model and numerical methods are presented. The results and discussion of our numerical simulations are given in Sec. III, and the conclusion is presented in Sec. IV.
II Theoretical Model
In this work, atomic units are used throughout unless stated otherwise. To obtain the high-order harmonic spectrum, the TDSE within the single-active-electron approximation is solved
| (1) |
where is the field-free Hamiltonian and is the interaction Hamiltonian between the solid and the laser pulse. In the present study, the laser pulse is considered to be linearly polarized. A Mathieu-type model potential is used as the periodic potential of the solid without defects and is written as
| (2) |
where is the depth of the potential and is the lattice constant. Here, a.u. and a.u. are used. The Mathieu-type potential is a popular potential widely used to study HHG in solids Wu et al. (2015); Liu et al. (2017a, b); Ikemachi et al. (2017). The Mathieu-type potential is modified to incorporate the different kinds of defects and is written as
| (3) |
The value of can be modified to realize different kinds of defects such as vacancies (), underdoping ( a.u.) and overdoping ( a.u.), where the values of for underdoped and overdoped cases are adopted from Ref. Huang et al. (2017). The absence of an atom in a lattice site creates a vacancy in the periodic potential as shown in Fig. 1. The periodic potential with a vacancy defect (solid orange curve) differs from the pristine or vacancy free periodic potential (blue dashed curve) in the region between and points. We assume that the lattice constant is unaffected due to the presence of a vacancy defect.

Different concentrations of vacancy defects are achieved systematically by increasing the size of the supercell and keeping a single vacancy in the supercell. The vacancy concentration becomes when the supercell is -times larger than the single unit cell. The vacancy concentration becomes 4.7%, 9.1%, 14.2% and 20.0% corresponding to and 5; respectively. A linearly polarized laser pulse with eight sine-square enveloped optical cycles is used to obtain the HHG spectrum. The wavelength and the intensity of the laser pulse are 3.2 m and 8.11011 W/cm2, respectively.
The HHG spectrum is simulated by solving the TDSE in the velocity-gauge within the Bloch-state basis as given in Ref. Korbman et al. (2013). Brillouin zone sampling is used for pristine as well as supercell calculations. A fourth-order Runge-Kutta method with 0.01 a.u. time-step is employed to solve the coupled differential equations. The intensity of the high-order harmonics is obtained from the square of the Fourier transform of the time-dependent current as
| (4) |
where is laser-induced time-dependent current.
III Results and Discussion
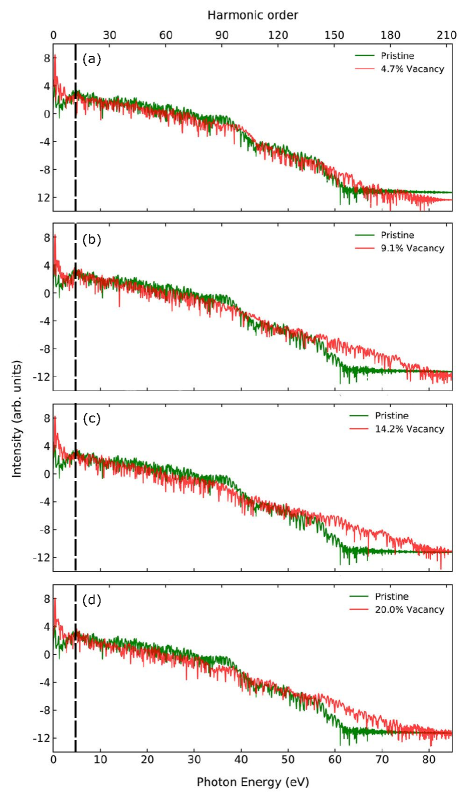
Figure 2 represents the high-order harmonic spectrum of solids with vacancy defects of different concentrations (red color) compared to the spectrum of a pristine solid without vacancy defects (green color). The harmonic spectrum of the pristine solid reproduces unique features as it exhibits both a primary and a secondary plateau and a sudden transition from the primary plateau to the secondary plateau with clear cutoffs. The primary plateau lies between the 12th and 90th harmonic orders, whereas the secondary plateau lies in the range of the 116th to 144th harmonic orders. The secondary plateau is about five orders of magnitude lower than the primary plateau. Our simulated spectrum confirms distinct features of solid HHG previously reported and agrees with other published results Liu et al. (2017b); Huang et al. (2017); Wu et al. (2015); Ikemachi et al. (2017); Guan et al. (2016).
The harmonic spectra of solids with vacancies are significantly different from the spectrum of a pristine solid, as is evident from Fig. 2. The spectrum corresponding to 4.7% vacancy concentration is similar to the pristine one as the vacancy concentration is very low [see Fig. 2(a)]. However, the total energy cut off increases significantly for 9.1%, 14.2%, and 20.0% vacancy concentrations as reflected in Figs. 2(b), (c) and (d); respectively. Also, the spectrum profile of the harmonic yield gradually turns into a single slanted spectrum without a sharp distinction between the primary and secondary plateaus. Not only does the total energy cut off increase but also the below band-gap harmonics changes drastically for vacancy solids. There is an enhancement of approximately two orders of magnitude in the below band-gap harmonic intensity for solids with vacancies in comparison to the pristine solid, as reflected in Fig. 3.

To understand the increase in energy cut off and spectral intensity enhancement in the below band-gap harmonics, the effective energy band structures of solids with different vacancy concentrations are presented in Fig. 4. The size of the first Brillouin zone decreases as the size of the supercell increases. This means that the sizes of the first Brillouin zone, corresponding to solids with different vacancy concentrations and to a pristine solid, are different. Note that different sizes of the supercell are used to realize different vacancy concentrations. To compare the band structures of solids with different vacancy concentrations and a pristine solid for the identical size of the first Brillouin zone, a band unfolding approach is used. Following the method given in Refs. (Ku et al., 2010; Popescu and Zunger, 2012; Mayo and Soler, 2018), the energy-band structures of solids with different vacancy concentrations are unfolded into the area of first Brillouin zone of a pristine solid.

The uppermost valence and three lower conduction bands are the most affected bands due to vacancy defects in solids, as evident from Fig. 4. The inclusion of vacancy defects breaks the translational symmetry of the unit cell locally, although translational symmetry of the supercell remains preserved globally. The breaking of the translational symmetry leads to splitting of the pristine energy bands and new defect states emerge Zhong et al. (2016). As the vacancy concentration increases, new defect states become more prominent near the Fermi level. The splittings of energy bands are predominantly observed in the conduction band region.
To better comprehend the total modification in the harmonic spectra, we analyze the joint density of states (JDOS) for different concentrations of vacancy defect. JDOS provides an estimate of possible transitions at a particular energy. From Fig. 5, it is evident that the JDOS of a defect solid in the low-energy regime, upto 20 eV, is significantly modified in comparison to the JDOS of a pristine solid. There are additional JDOS in the below band-gap regime, accounting for the below band-gap enhancement in the harmonic spectra. The qualitative nature of the JDOS in the higher energy regime, above 25 eV, is also different for pristine and defect solids. These changes in the JDOS are responsible for the modulation in the harmonic spectra in the cutoff regime. Note that JDOS does not account for the probability of transitions, which may also affect the spectrum.

In a pristine solid, distinct interband coupling strengths and energy gaps between different pairs of conduction and valence bands lead to a different harmonic intensities in different plateaus. The new energy bands due to vacancy defects open new paths for the interband transitions, and these new interband transitions modify the electron dynamics. As a result of these additional modifications, abrupt intensity drops between primary and secondary plateaus are reduced and the plateaus gradually become indistinguishable with the increase in the vacancy concentrations, as reflected in Fig 2.
Time-frequency maps corresponding to the harmonic spectra in Fig 2 are obtained by performing a Gabor transform and are presented in Fig 6. The generation of electron-hole pairs and their trajectories can be seen from the maps. The pristine solid has well-resolved states in the band structure, which translate into well-resolved trajectories in the time-frequency map [see Fig. 6(a)], and this is consistent with earlier work as shown in Ref. Du and Bian (2016). Several additional defect states in the band structure appear as the vacancy defects are introduced [see Figs. 4(b)-(e)]. As a consequence of these additional states, additional paths for the electron-hole dynamics in a vacancy solid are possible and these paths interfere with each other. The well-resolved trajectories in the time-frequency maps disappear as a result of additional interfering paths, as is visible in Figs. 6(b)-(e). Similar ill-resolved trajectories are discussed in the time-frequency map corresponding to HHG from an imperfect solid Yu et al. (2019b).
The enhancement in the below band-gap harmonics in vacancy solid can be understood as follows: the defect states near the Fermi level open additional channels for interband transitions, which lead to an enhancement in the below band-gap harmonics S. et al. (2019b). The enhancement in the below band-gap harmonics is clearly visible in time-frequency maps [see red colored regions in Fig 6(b)-(e)].

To understand how HHG from a vacancy solid is different from HHG from solids with underdoping and overdoping defects, we present harmonic spectra from solids with these three kinds of defects (vacancies, underdoping and overdoping, see Fig. 1) and their comparison with the pristine solid in Fig. 7. Here, 9.1% defect concentration is chosen for all three cases. The harmonic spectrum for vacancy solid exhibits a slanted nature without having an abrupt variation [Fig. 7(a)], whereas the spectra from underdoped or overdoped solids show sharp transitions in intensity between the two plateaus [Figs. 7(b) and (c)], much like HHG from the pristine solid. The significant variations among the spectra from the three kinds of defects can be understood in terms of their effective band-structure as presented in Fig. 8. There are new defect states near the Fermi level for overdoped and underdoped solids. In the case of vacancy defects, there are additional defect states in the conduction and valence bands, in addition to the defect states near the Fermi level.


IV Conclusion
In conclusion, the impact of different concentrations of vacancy defects in solid HHG is investigated. It is found that the total energy cutoff of the harmonic spectra increases with the increment in vacancy concentration. The intensity of below band-gap harmonics in solids with vacancy defects is enhanced significantly in comparison to the harmonics in a pristine solid. The changes in the harmonic spectra of solids with vacancies are understood in terms of their effective unfolded band structures. The presence of a vacancy breaks the translational symmetry of the unit cell locally, which results in the splitting of pristine energy bands. The appearance of the new defect states opens additional paths for interband and intraband currents. This leads to the energy cutoff and harmonic yield different from the pristine solid. The time-frequency analysis of the HHG spectra confirms the enhancement in the below band-gap harmonics. It also helps us to conclude that the electron trajectories become ill-resolved with the increment in the vacancy concentration due to the appearance of additional conduction bands and reduce the abrupt drop in the intensity of the harmonic yield between the plateaus. The single slanted harmonic spectrum carries a unique signature of vacancy defects which differs from the HHG from solids with underdoping or overdoping defects. The reduction in the abrupt drop in HHG intensity due to the band splitting makes HHG from vacancy defects distinctive. Our current work indicates that solids with vacancy defects are potential band-gap materials for generation of high-energy radiation in XUV and soft x-ray energy regimes. HHG from solids with vacancy defects will be fascinating avenues for future work.
G.D. acknowledges support via a Ramanujan fellowship (SB/S2/ RJN-152/2015). We are thankful for a fruitful discussion with Dr. Vladislav Yakovlev from the Max-Planck institute for Quantum Optics, Garching, Germany.
Appendix A Absorption Spectrum
Figure 9 present absorption spectra as a function of vacancy concentration. The modifications in the band structure due to vacancy defects are captured by absorption spectra in the perturbative regime. The peak at 4.18 eV reflects the minimum band gap for a pristine solid [see Fig. 9(a)]. Figures 9(b)-(e) show the emergence of multiple sharp peaks in the absorption spectra for different vacancy concentrations, which become apparent due to the appearance of new defect states in the energy-band structure. The absorption peaks in the below-band-gap regime indicate the transitions including defect states. These results support the findings regarding the enhancement of the harmonics near the band-gap regime.

References
- Ferray et al. (1988) M. Ferray, A. L’Huillier, X. F. Li, L. A. Lompre, G. Mainfray, and C. Manus, Journal of Physics B 21, L31 (1988).
- Corkum (1993) P. B. Corkum, Physical Review Letters 71, 1994 (1993).
- Bartels et al. (2002) R. A. Bartels, A. Paul, H. Green, H. C. Kapteyn, M. M. Murnane, S. Backus, I. P. Christov, Y. Liu, D. Attwood, and C. Jacobsen, Science 297, 376 (2002).
- Sansone et al. (2006) G. Sansone, E. Benedetti, F. Calegari, C. Vozzi, L. Avaldi, R. Flammini, L. Poletto, P. Villoresi, C. Altucci, R. Velotta, et al., Science 314, 443 (2006).
- Paul et al. (2001) P. M. Paul, E. S. Toma, P. Breger, G. Mullot, F. Augé, P. Balcou, H. G. Muller, and P. Agostini, Science 292, 1689 (2001).
- Krausz and Ivanov (2009) F. Krausz and M. Ivanov, Reviews of Modern Physics 81, 163 (2009).
- Smirnova et al. (2009) O. Smirnova, Y. Mairesse, S. Patchkovskii, N. Dudovich, D. Villeneuve, P. Corkum, and M. Ivanov, Nature 460, 972 (2009).
- Dixit et al. (2012) G. Dixit, O. Vendrell, and R. Santra, Proc. Natl. Acad. Sci. U.S.A. 109, 11636 (2012).
- Bredtmann et al. (2014) T. Bredtmann, M. Ivanov, and G. Dixit, Nature Communications 5, 5589 (2014).
- Bucksbaum (2007) P. H. Bucksbaum, Science 317, 766 (2007).
- Corkum and Krausz (2007) P. B. Corkum and F. Krausz, Nature Physics 3, 381 (2007).
- Lépine et al. (2014) F. Lépine, M. Y. Ivanov, and M. J. J. Vrakking, Nature Photonics 8, 195 (2014).
- Ghimire et al. (2011a) S. Ghimire, A. D. DiChiara, E. Sistrunk, P. Agostini, L. F. DiMauro, and D. A. Reis, Nature Physics 7, 138 (2011a).
- Ghimire et al. (2011b) S. Ghimire, A. D. DiChiara, E. Sistrunk, U. B. Szafruga, P. Agostini, L. F. DiMauro, and D. A. Reis, Physical Review Letters 107, 167407 (2011b).
- Zaks et al. (2012) B. Zaks, R. B. Liu, and M. S. Sherwin, Nature 483, 580 (2012).
- Schubert et al. (2014) O. Schubert, M. Hohenleutner, F. Langer, B. Urbanek, C. Lange, U. Huttner, D. Golde, T. Meier, M. Kira, S. W. Koch, et al., Nature Photonics 8, 119 (2014).
- Vampa et al. (2015a) G. Vampa, T. J. Hammond, N. Thiré, B. E. Schmidt, F. Légaré, C. R. McDonald, T. Brabec, D. D. Klug, and P. B. Corkum, Physical Review Letters 115, 193603 (2015a).
- Vampa et al. (2015b) G. Vampa, T. J. Hammond, N. Thiré, B. E. Schmidt, F. Légaré, C. R. McDonald, T. Brabec, and P. B. Corkum, Nature 522, 462 (2015b).
- Hohenleutner et al. (2015) M. Hohenleutner, F. Langer, O. Schubert, M. Knorr, U. Huttner, S. W. Koch, M. Kira, and R. Huber, Nature 523, 572 (2015).
- Luu et al. (2015) T. T. Luu, M. Garg, S. Y. Kruchinin, A. Moulet, M. T. Hassan, and E. Goulielmakis, Nature 521, 498 (2015).
- Ndabashimiye et al. (2016) G. Ndabashimiye, S. Ghimire, M. Wu, D. A. Browne, K. J. Schafer, M. B. Gaarde, and D. A. Reis, Nature 534, 520 (2016).
- You et al. (2017) Y. S. You, Y. Yin, Y. Wu, A. Chew, X. Ren, F. Zhuang, S. Gholam-Mirzaei, M. Chini, Z. Chang, and S. Ghimire, Nature Communications 8, 724 (2017).
- Lanin et al. (2017) A. A. Lanin, E. A. Stepanov, A. B. Fedotov, and A. M. Zheltikov, Optica 4, 516 (2017).
- Sivis et al. (2017) M. Sivis, M. Taucer, G. Vampa, K. Johnston, A. Staudte, A. Y. Naumov, D. M. Villeneuve, C. Ropers, and P. B. Corkum, Science 357, 303 (2017).
- Langer et al. (2018) F. Langer, C. P. Schmid, S. Schlauderer, M. Gmitra, J. Fabian, P. Nagler, C. Schüller, T. Korn, P. G. Hawkins, J. T. Steiner, et al., Nature 557, 76 (2018).
- Ghimire et al. (2014) S. Ghimire, G. Ndabashimiye, A. D. DiChiara, E. Sistrunk, M. I. Stockman, P. Agostini, L. F. DiMauro, and D. A. Reis, Journal of Physics B 47, 204030 (2014).
- Wu et al. (2015) M. Wu, S. Ghimire, D. A. Reis, K. J. Schafer, and M. B. Gaarde, Physical Review A 91, 043839 (2015).
- Du and Bian (2017) T.-Y. Du and X.-B. Bian, Optics express 25, 151 (2017).
- Vampa and Brabec (2017) G. Vampa and T. Brabec, Journal of Physics B 50, 083001 (2017).
- Kruchinin et al. (2018) S. Y. Kruchinin, F. Krausz, and V. S. Yakovlev, Reviews of Modern Physics 90, 021002 (2018).
- Almalki et al. (2018) S. Almalki, A. M. Parks, G. Bart, P. B. Corkum, T. Brabec, and C. R. McDonald, Physical Review B 98, 144307 (2018).
- Higuchi et al. (2014) T. Higuchi, M. I. Stockman, and P. Hommelhoff, Physical Review Letters 113, 213901 (2014).
- S. et al. (2019a) Mrudul M. S., A. Pattanayak, M. Ivanov, G. Dixit, Physical Review A 100, 043420 (2019).
- Orlando et al. (2018) G. Orlando, C. M. Wang, T. S. Ho, and S. I. Chu, JOSA B 35, 680 (2018).
- Yu et al. (2019a) C. Yu, K. K. Hansen, and L. B. Madsen, Physical Review A 99, 013435 (2019a).
- Huang et al. (2017) T. Huang, X. Zhu, L. Li, X. Liu, P. Lan, and P. Lu, Physical Review A 96, 043425 (2017).
- Liu et al. (2017a) X. Liu, X. Zhu, X. Zhang, D. Wang, P. Lan, and P. Lu, Optics Express 25, 29216 (2017a).
- Liu et al. (2017b) X. Liu, X. Zhu, P. Lan, X. Zhang, D. Wang, Q. Zhang, and P. Lu, Physical Review A 95, 063419 (2017b).
- Ikemachi et al. (2017) T. Ikemachi, Y. Shinohara, T. Sato, J. Yumoto, M. Kuwata-Gonokami, and K. L. Ishikawa, Physical Review A 95, 043416 (2017).
- Korbman et al. (2013) M. Korbman, S. Y. Kruchinin, and V. S. Yakovlev, New Journal of Physics 15, 013006 (2013).
- Guan et al. (2016) Z. Guan, X.-X. Zhou, and X.-B. Bian, Physical Review A 93, 033852 (2016).
- Ku et al. (2010) W. Ku, T. Berlijn, and C. C. Lee, Physical Review Letters 104, 216401 (2010).
- Popescu and Zunger (2012) V. Popescu and A. Zunger, Physical Review B 85, 085201 (2012).
- Mayo and Soler (2018) S. G. Mayo and J. M. Soler, arXiv preprint arXiv:1812.03925 (2018).
- Zhong et al. (2016) S. Zhong, M. Wu, and X. Lei, Materials Science-Poland 34, 916 (2016).
- Yu et al. (2019b) C. Yu, K. K. Hansen, and L. B. Madsen, Physical Review A 99, 063408 (2019b).
- Du and Bian (2016) T. Y. Du and X. B. Bian, arXiv preprint arXiv:1606.06433 (2016).
- S. et al. (2019b) Mrudul M. S., N. Tancogne-Dejean, A. Rubio, and G. Dixit, arXiv preprint arXiv:1906.10224 (2019b).