Stellar Kinematics and Environment at in the LEGA-C Survey: Massive, Slow-Rotators are Built First in Overdense Environments
Abstract
In this letter, we investigate the impact of environment on integrated and spatially-resolved stellar kinematics of a sample of massive, quiescent galaxies at intermediate redshift (). For this analysis, we combine photometric and spectroscopic parameters from the UltraVISTA and Large Early Galaxy Astrophysics Census (LEGA-C) surveys in the COSMOS field and environmental measurements. We analyze the trends with overdensity (1+) on the rotational support of quiescent galaxies and find no universal trends at either fixed mass or fixed stellar velocity dispersion. This is consistent with previous studies of the local Universe; rotational support of massive galaxies depends primarily on stellar mass. We highlight two populations of massive galaxies () that deviate from the average mass relation. First, the most massive galaxies in the most under-dense regions () exhibit elevated rotational support. Similarly, at the highest masses () the range in rotational support is significant in all but the densest regions. This corresponds to an increasing slow-rotator fraction such that only galaxies in the densest environments () are primarily (9010%) slow-rotators.This effect is not seen at fixed velocity dispersion, suggesting minor merging as the driving mechanism: only in the densest regions have the most massive galaxies experienced significant minor merging, building stellar mass and diminishing rotation without significantly affecting the central stellar velocity dispersion. In the local Universe, most massive galaxies are slow-rotators, regardless of environment, suggesting minor merging occurs at later cosmic times in all but the most dense environments.
1 Introduction
Growing evidence from observations of quiescent, early-type galaxies through cosmic time (e.g., Bezanson et al., 2009; van Dokkum et al., 2010; Hilz et al., 2012; Newman et al., 2012; Hilz et al., 2013; Newman et al., 2013) and from hydrodynamic simulations in a cosmological setting (e.g., Naab et al., 2009; Wellons et al., 2015, 2016; Penoyre et al., 2017) suggests the importance of hierarchical assembly via gas-poor, minor merging in building today’s elliptical galaxies. Cosmological simulations predict that the growth of elliptical galaxies through minor merging should extend their radial profiles (e.g., Lagos et al., 2017; Lagos, 2018) and decrease their rotational support (e.g., Frigo et al., 2019). Additionally, as ellipticals continue to grow in mass and size, their rotational support decreases (e.g., van der Wel et al., 2008, 2014; Bezanson et al., 2018b), with the tendency for galaxies to transition from rotation-supported systems to pressure-supported systems (e.g., Cappellari et al., 2011b; van de Sande et al., 2013; Naab et al., 2014).
In this model, the ordered motions of stellar orbits are averaged out by a series of mergers through cosmic time, creating a direct connection between merging and rotational or dispersion support. Given this, one would expect to find environmental trends in the rotational support of elliptical galaxies driven by their differing merger histories (Cappellari et al., 2011b). However, although rotational support has been shown to correlate strongly with stellar mass (e.g., Cappellari et al., 2011a; van de Sande et al., 2013, 2017, 2019; Veale et al., 2017; Bezanson et al., 2018a; Greene et al., 2018), ellipticals in the nearby Universe do not appear to have additional environmental dependencies (Veale et al., 2017; Greene et al., 2018). This suggests that the processes responsible for diminishing rotational support in massive, elliptical galaxies do so independently of environment or that those trends have been eroded over time.
If the destruction of rotational support is gradual in elliptical galaxies, observations of galaxies at a much earlier epoch could probe an informative period of this process, providing stronger tests of the extended nature of this evolution. However, these observations are challenging, requiring sufficient depths to measure the resolved stellar kinematics and large enough samples to search for environmental trends that have been previously out of reach. Early studies of the shapes and rotational support of quiescent galaxies much closer to their quenching episodes point towards a picture of kinematic evolution post-quenching, although there may be some tension between kinematic and morphological studies. Holden et al. (2009) found no evolution in the projected shapes of early-type galaxies, from to , implying the lack of rotational support evolution between these epochs. Studies of the field population have shown at most mild evolution in the shape distribution below (Holden et al., 2012; Chang et al., 2013), while at , there is a clear and accelerated evolution of field galaxy projected shapes (van der Wel et al., 2011; Chang et al., 2013). At , several strongly-lensed, massive galaxies (Newman et al., 2018; Toft et al., 2017), show significant rotation and the spatially integrated stellar kinematics of 80 quiescent galaxies (Belli et al., 2017) also suggest increased rotational support. Bezanson et al. (2018a) demonstrated that a sample of quiescent galaxies from an early release of the Large Early Galaxy Astrophysics Census (LEGA-C) have more rotational support than local elliptical galaxies.
In this letter, we extend the analysis presented by Bezanson et al. (2018a) to determine whether the rotational support of quiescent galaxies in LEGA-C exhibits a dependence on environment, in addition to stellar mass. In §2, we describe the LEGA-C sample and auxillary data sets used in our analysis. We analyze the trends in environment and stellar properties on rotational support in §3. In §4, we summarize our findings and discuss conclusions. We assume a standard concordance cosmology throughout this analysis ( = 70 km s-1, = 0.3, = 0.7).
2 Data and Sample
2.1 The LEGA-C Spectroscopic Dataset of Massive Galaxies at
The sample of galaxies used in this paper is based on LEGA-C data release 2 (DR2) (Straatman et al., 2018) (PI: van der Wel). LEGA-C includes ultra-deep spectroscopy of approximately 3500 massive galaxies at z 0.8 in the COSMOS field using VIMOS on the VLT as a part of an ESO Large Spectroscopic Program. A more detailed description of the survey, data reduction, and quality can be found in van der Wel et al. (2016) and Straatman et al. (2018). Observations were taken using the HRred grating, which produces R 2500 spectra between 6300 and 8800 Å. The LEGA-C survey targets massive galaxies with a redshift-dependent K-magnitude limit (KAB = 20.7 - 7.5 log()) that yields a representative sample of galaxies above Spectroscopic targets are selected from the Muzzin et al. (2013) v4.1 UltraVISTA catalog, which includes 30 photometric band measurements from 150 Å to 24000 Å from the GALEX, Subaru, Canada-France-Hawaii, VISTA, and Spitzer telescopes. Stellar population properties are estimated for the full sample using FAST (Kriek et al., 2009) assuming delayed exponentially declining star formation histories, a Chabrier (2003) Initial Mass Function, Calzetti et al. (2000) dust law and fixing to the spectroscopic redshifts. HST/ACS F814W imaging of each galaxy (Koekemoer et al., 2007; Massey et al., 2010) is fit with a Sérsic profile using Galfit (Peng et al., 2002, 2010). We note that all VIMOS slits are North-South aligned in the LEGA-C survey, therefore we restrict our analysis in this work to galaxies for which the photometric major axis is within 30 degrees of the slit.
The spatially resolved stellar kinematics measured from the LEGA-C spectra are vital for this analysis. Full details of the kinematic modelling of the spectra are described in Bezanson et al. (2018a, b) and we summarize briefly here. Each 2D and 1D optimally-extracted spectrum is fit using pPXF (Cappellari & Emsellem, 2004; Cappellari, 2017) with a non-negative linear combination of theoretical single stellar population templates and Gaussian emission lines and broadened to fit the spectrum. This yields stellar and ionized gas rotation curves and dispersion profiles along the slit for all galaxies in the survey. We draw specific attention to two quantities used in our analysis. is the stellar velocity dispersion measured from the spatially integrated, optimally extracted spectrum (see Bezanson et al., 2018b). We define rotational support by the ratio between the stellar rotational velocity measured at 5 kpc and the stellar velocity dispersion in the central pixel. To minimize the impact of projection effects, we divide this ratio by where (Bezanson et al., 2018a):
| (1) |
Systematic differences between this observed quantity and the intrinsic rotational support are very likely functions of mass and . For our study, we focus on a sample of 217 quiescent galaxies, selected by U-V and V-J colors according to Muzzin et al. (2013), most of which are visually early-type. We do not expect any uncertainty in rotational support to be a function of environment.
2.2 LEGA-C and Sampling the COSMOS Field
In addition to the LEGA-C dataset, we include information about galaxy environments in the COSMOS field, focusing on projected overdensities (1+) from Darvish et al. (2017). This group catalog uses the COSMOS2015 photometric redshift catalog from Laigle et al. (2016) in the UltraVISTA-DR2 region (McCracken et al., 2012; Ilbert et al., 2013). Adaptive weighted kernel smoothing is used to determine projected number densities and subsequent overdensities. The projected densities are determined using a 2-dimensional Gaussian kernel which changes depending on the local density of galaxies within each redshift slice. For a more complete description, see Darvish et al. (2015). There is an additional component of randomness added in the measurements of overdensity, which we expect to smear out any trends related to environment. We match LEGA-C galaxies to the group catalog within 1”.
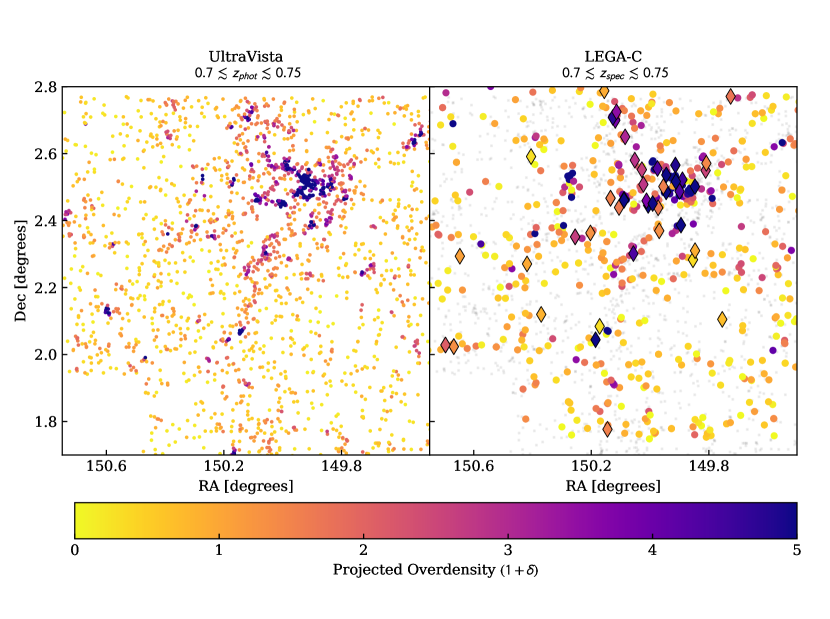
Although LEGA-C is a targeted sample, it traces the full range of overdensities. In Figure 1, we show a 2-dimensional projection of the photometric UltraVISTA galaxies (left) used in the environmental analysis (Darvish et al., 2015) and a sub-sample of the spectroscopic targets from the LEGA-C survey (right) in COSMOS for a small redshift slice (). Galaxies are colored by their projected overdensity (1+) and we have marked the well-aligned quiescent galaxies used in this analysis with outlined diamonds. The range in log (1+) for the UltraVISTA photometric catalog is and the range sampled by the LEGA-C survey is , which effectively spans the full dynamic range of overdensities in the COSMOS field.
2.3 Nearby quiescent galaxies from the MASSIVE and ATLAS 3D surveys
Finally, we include a comparison sample of massive, quiescent galaxies in the local Universe from the MASSIVE and ATLAS3D surveys. The MASSIVE survey is a volume-limited sample of 115 galaxies in which all galaxies with a K-band magnitude brighter than are targeted (Carrick et al., 2015) and observed using an integral field (IFU) spectrograph giving 2-dimensional stellar kinematic information about each galaxy (Veale et al., 2017). ATLAS3D is also an IFU survey, observing all 260 galaxies above and within a 42 Mpc radius. For a complete description of the ATLAS3D survey, see Cappellari et al. (2011a). For the purpose of this paper, we use the stellar kinematic parameter (Emsellem et al., 2011; Veale et al., 2017) to quantify rotational support and classify galaxies in the local Universe as fast-/slow-rotators. Using a linear -to-stellar mass ratio (Cappellari et al., 2013a), we convert the K-band magnitudes of galaxies in the MASSIVE and ATLAS3D surveys and compare them to galaxies in the LEGA-C survey with the highest masses. There is dex uncertainty in stellar masses which comes from uncertainties in the K-band magnitudes and the relation (Cappellari et al., 2013a). is measured by binning the spatial pixels in each galaxy until a signal-to-noise threshold of 20 is reached, and averaging the bins out to the effective radius of the galaxy. To specify the environment of MASSIVE and ATLAS3D, we adopt luminosity-weighted overdensities , taken from Carrick et al. (2015) and Lavaux & Hudson (2011), respectively. ATLAS 3D and MASSIVE have volumes of and , respectively, and LEGA-C has a volume of .
3 Dependence of Rotational Support on Environment at
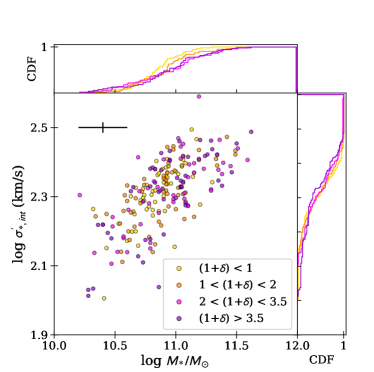
In this section, we investigate whether stellar kinematics in quiescent galaxies at z 0.8 depend on environment. In the primary panel of Figure 2, we show the distribution of observed stellar velocity dispersion versus stellar mass, or the mass Faber-Jackson relation (mFJ, Faber & Jackson, 1976) for all the galaxies in the LEGA-C sample, colored by overdensity, with each bin containing galaxies. We continue this color scheme in later figures. Cumulative distribution functions (CDFs) are shown for both stellar mass and . Stellar mass tends to increase with overdensity, with the most massive galaxies accumulating in the densest environments. However, the trend is more subtle in the CDFs for : at most overdensities, galaxies tend to have similar except in the highest overdensities, where galaxies tend to have the highest .
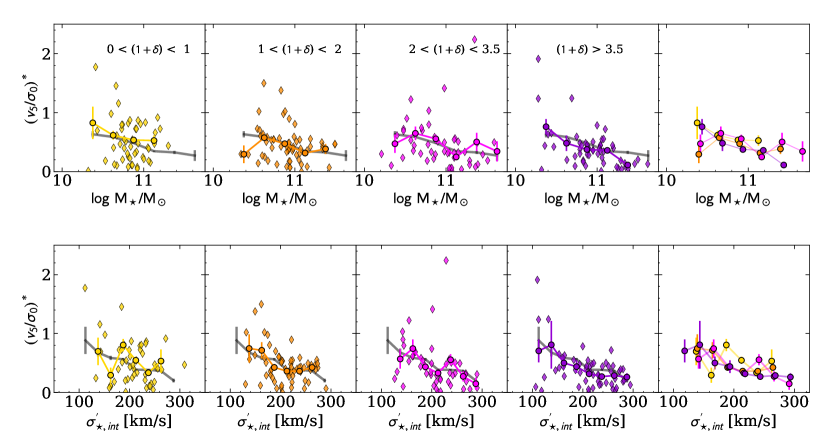
Additionally, we investigate trends in rotational support with environment. In Figure 3, we show the rotational support of galaxies versus stellar mass in the top row and versus in the bottom row, colored by overdensity. Black lines and colored lines show the average rotational support for the entire sample and for each overdensity bin, respectively, with jackknife error estimation. In the two right-most panels, we show the running average rotational support for each overdensity bin, with a slight offset from the center of the bin for clarity. As shown in Bezanson et al. (2018b), the average range in rotational support tends to decrease with increasing stellar mass, which is consistent with studies of massive, quiescent galaxies in the local Universe (Veale et al., 2017; Greene et al., 2018). We do not see a strong environmental trend at all masses, but we note two statistically significant trends at the massive end of the sample. First, while galaxies in the least dense environments (yellow symbols) are not represented at the highest masses (), the most massive of these () exhibit more rotational support than other similar mass galaxies. In denser environments (), massive galaxies follow the average relation except at the highest masses (), where only galaxies in the most overdense regions have minimal . Unlike comparisons at fixed mass, trends in at fixed are much more subtle.
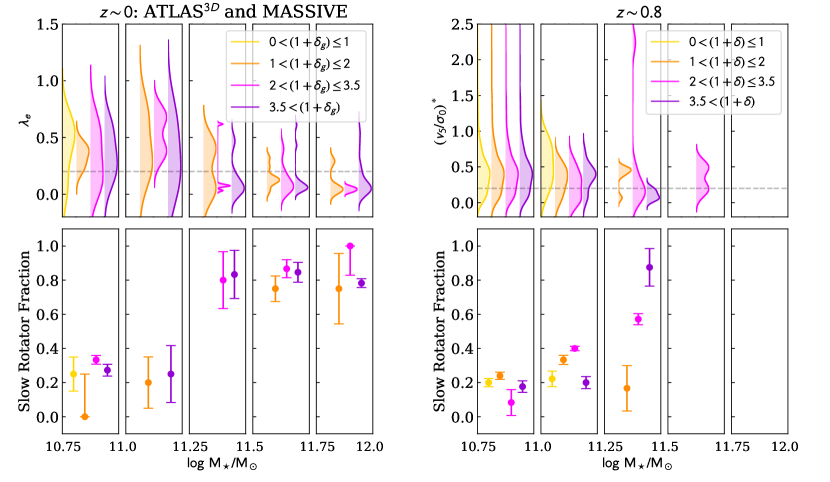
We focus the remainder of the letter on the most massive galaxies in the sample (). In the local Universe this corresponds to the mass at which galaxies are primarily slow-rotators, or core ellipticals (e.g., Cappellari et al., 2013a, b). In the top row of Figure 4 we show the Gaussian-kernel smoothed, normalized probability distribution functions (Waskom et al., 2016) for (left, ATLAS 3D and MASSIVE) and (right, LEGA-C) for galaxies with log , in bins of 0.25 dex. We note that the different distributions identified in Figure 3 likely correspond to a difference in populations of so-called fast- and slow- rotators in the local Universe. The dashed horizontal line indicates the separation between fast- and slow-rotators. In the bottom row, we indicate the fraction of galaxies in each mass and density bin that lie below the slow-rotator threshold. We adopt a threshold of to discriminate between the two populations following Veale et al. (2017); however, using a threshold of does not significantly affect the identification of slow-rotators in this sample of massive galaxies. While is an empirical quantity and does not have an agreed upon threshold to separate galaxies with significant rotation and those without, we adopt a threshold of 0.2 based on the distribution of galaxies (e.g., in Figure 3). We have tested additional values for this threshold between 0.1 and 0.3, which do not change the results of this analysis; the distributions of galaxies in the distant and local Universe are fundamentally different.
In the local Universe, the fraction of slow rotators at fixed mass does not depend on environment. In the distant Universe, in the low-density regions () only of the most massive () galaxies exhibit minimal rotation. Although under-dense regions tend to be populated by galaxies with higher average rotational support, as shown in Figure 4, this does not correspond to a statistically significant difference in the fraction of slow-rotators. This is not true for the distributions of galaxies in denser regions, which tend to decrease in with increasing mass. We note that although , and stellar masses are measured very differently in the local and LEGA-C samples, they correspond to qualitatively similar properties. In the local samples, the majority of galaxies with are slow-rotators. However, for galaxies in LEGA-C, the slow-rotator fraction of the most massive galaxies depends strongly on environment; specifically, in the most overdense regions, nearly all ultra-massive () galaxies are slow-rotators, while galaxies in less dense environments are progressively more likely to retain significant stellar rotational support.
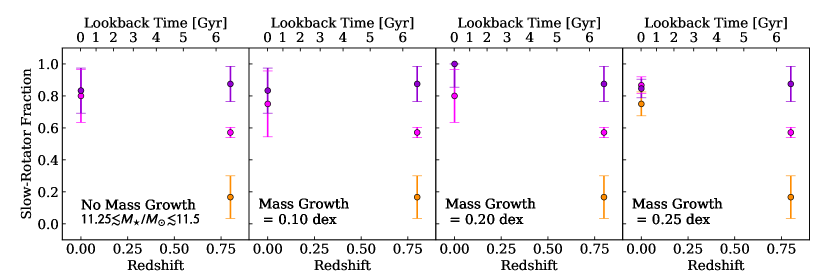
Finally, we compare the slow-rotator fractions in possible progenitor and descendant quiescent galaxy populations. In Figure 5, we show the slow-rotator fraction versus redshift for local and distant galaxies, colored by overdensity. Each panel compares the most massive LEGA-C progenitors to local descendant populations, showing the slow-rotator fractions for mass ranges of , , , and , (allowing for an increase in mass of 0.0, 0.10, 0.20, and 0.25 dex) from left to right respectively. Empirically motivated work (e.g., Leja et al., 2013; Patel et al., 2013; van Dokkum et al., 2013) and theoretical studies (Behroozi et al., 2013; Torrey et al., 2015, 2017) have estimated mass growth rates of 0.15 dex for massive LEGA-C-like galaxies since , although this value is particularly uncertain at the massive end. At these masses, all potential descendant populations are dominated by slow-rotators, independent of environment. However, the highest mass galaxies in the distant universe display a clear trend with environment: specifically, those in the densest regions tend to mainly be slow-rotators, with the fraction of slow-rotators decreasing with decreasing overdensity.
4 Discussion and Conclusions
In this letter we investigate the environmental effects on the stellar kinematics of massive, quiescent galaxies at intermediate redshift. We use two quantities for representing stellar kinematics: (1) , the spatially integrated, optimally extracted stellar velocity dispersion and (2) , the projection-corrected ratio between stellar velocity measured at 5 kpc and stellar velocity dispersion in the central pixel. We also compare the slow-rotator fractions of our sample at intermediate look-back time to the slow-rotator fractions for a sample of galaxies in the local Universe.
Similar to the trends found in the local Universe, our sample of ETGs demonstrates a strong mass and stellar velocity dispersion dependence, and no universal environmental dependence, in rotational support. Although overdense regions tend to host more massive galaxies, the trends with overdensity in are much more subtle. Specifically, only at the highest is there at subtle separation in the CDFs; increases with increasing overdensity. However, unlike galaxies at , at , the most massive population of quiescent galaxies is only dominated by slow-rotators in the most overdense environments. Specifically, in highly populated regions, elliptical galaxies tend to be slow-rotators at both redshifts, however in less dense regions, the fractions of slow-rotators increase dramatically between and . In contrast, the vast majority of likely descendants in the local Universe of such massive galaxies (e.g. as probed by the ATLAS3D and MASSIVE surveys) are slow-rotators. We do not find any significant environmental dependence in rotational support of the highest galaxies which is consistent with van Dokkum et al. (2010). In this framework, the continued evolution of galaxies must not significantly change the stellar velocity dispersions of massive galaxies in higher density regions. When taken together, we infer that minor merging is the driving mechanism in building the population of slow-rotating, ultra-massive galaxies in overdense regions of the COSMOS field because it can increase mass and black diminish rotational support without significantly influencing central stellar velocity dispersions (e.g., Bezanson et al., 2009; van Dokkum et al., 2010; Newman et al., 2012, 2013).
A quantitative analysis of the evolution of the rotational support of quiescent galaxies through cosmic time would require self-consistent analysis of both low- and high-redshift samples. We have limited our comparison to fast and slow-rotator fractions, but directly comparing the rotational support within the two samples would need to take into account differences in observations (e.g., seeing, aperture effects, IFU versus slit spectroscopy) and consistent modeling of the kinematics (e.g., Jeans modeling, van Houdt, et al., in prep). Such analysis may reveal additional environmental trends in the kinematics of massive, quiescent galaxies.
The strongest test of this evolution as a function of time would ideally probe to even earlier cosmic epochs to observe the formation of these massive galaxies. The James Webb Space Telescope will be equipped with the NIRSpec IFU, which will be able to spatially resolve the light from much more distant progenitors of massive slow rotating galaxies. However, the continuum spectroscopy necessary to probe stellar kinematics will be challenging even for spatially integrated measurements. For individual targets, continuum spectroscopy will be possible, but statistical samples will be out of reach for JWST (Newman et al., 2019). Thirty meter class telescopes with larger apertures and adaptive optics that enable near diffraction-limited seeing will be able to push spectroscopic observations of massive galaxies to higher redshifts, allowing spatially-resolved spectra to be obtained for higher redshifts than is currently possible and probing new epochs of galaxy formation.
References
- Astropy Collaboration et al. (2013) Astropy Collaboration, Robitaille, T. P., Tollerud, E. J., et al. 2013, A&A, 558, A33
- Behroozi et al. (2013) Behroozi, P. S., Marchesini, D., Wechsler, R. H., et al. 2013, ApJ, 777, L10
- Belli et al. (2017) Belli, S., Newman, A. B., & Ellis, R. S. 2017, ApJ, 834, 18
- Bezanson et al. (2009) Bezanson, R., van Dokkum, P. G., Tal, T., et al. 2009, ApJ, 697, 1290
- Bezanson et al. (2018a) Bezanson, R., van der Wel, A., Straatman, C., et al. 2018a, ApJ, 868, L36
- Bezanson et al. (2018b) Bezanson, R., van der Wel, A., Pacifici, Camilla an Noeske, K., et al. 2018b, ApJ, 858, 60
- Calzetti et al. (2000) Calzetti, D., Armus, L., Bohlin, R. C., et al. 2000, ApJ, 533, 682
- Cappellari (2017) Cappellari, M. 2017, MNRAS, 466, 798
- Cappellari & Emsellem (2004) Cappellari, M., & Emsellem, E. 2004, Publications of the Astronomical Society of the Pacific, 116, 138
- Cappellari et al. (2011a) Cappellari, M., Emsellem, E., Krajnović, D., et al. 2011a, MNRAS, 413, 813
- Cappellari et al. (2011b) —. 2011b, MNRAS, 416, 1680
- Cappellari et al. (2013a) Cappellari, M., Scott, N., Alatalo, K., et al. 2013a, MNRAS, 432, 1709
- Cappellari et al. (2013b) Cappellari, M., McDermid, R. M., Alatalo, K., et al. 2013b, MNRAS, 432, 1862
- Carrick et al. (2015) Carrick, J., Turnbull, S. J., Lavaux, G., & Hudson, M. J. 2015, MNRAS, 450, 317
- Chabrier (2003) Chabrier, G. 2003, PASP, 115, 763
- Chang et al. (2013) Chang, Y.-Y., van der Wel, A., Rix, H.-W., et al. 2013, ApJ, 773, 149
- Darvish et al. (2017) Darvish, B., Mobasher, B., Martin, D. C., et al. 2017, ApJ, 837, 16
- Darvish et al. (2015) Darvish, B., Mobasher, B., Sobral, D., Scoville, N., & Aragon-Calvo, M. 2015, ApJ, 805, 121
- Emsellem et al. (2011) Emsellem, E., Cappellari, M., Krajnović, D., et al. 2011, MNRAS, 414, 888
- Faber & Jackson (1976) Faber, S. M., & Jackson, R. E. 1976, ApJ, 204, 668
- Frigo et al. (2019) Frigo, M., Naab, T., Hirschmann, M., et al. 2019, MNRAS, 489, 2702
- Greene et al. (2018) Greene, J. E., Leauthaud, A., Emsellem, E., et al. 2018, ApJ, 852, 36
- Hilz et al. (2013) Hilz, M., Naab, T., & Ostriker, J. P. 2013, MNRAS, 429, 2924
- Hilz et al. (2012) Hilz, M., Naab, T., Ostriker, J. P., et al. 2012, MNRAS, 425, 3119
- Holden et al. (2012) Holden, B. P., van der Wel, A., Rix, H.-W., & Franx, M. 2012, ApJ, 749, 96
- Holden et al. (2009) Holden, B. P., Franx, M., Illingworth, G. D., et al. 2009, ApJ, 693, 617
- Ilbert et al. (2013) Ilbert, O., McCracken, H. J., Le Fèvre, O., et al. 2013, A&A, 556, A55
- Koekemoer et al. (2007) Koekemoer, A. M., Aussel, H., Calzetti, D., et al. 2007, The Astrophysical Journal Supplement Series, 172, 196
- Kriek et al. (2009) Kriek, M., van Dokkum, P. G., Labbé, I., et al. 2009, ApJ, 700, 221
- Lagos (2018) Lagos, C. d. P. 2018, arXiv e-prints, arXiv:1810.13074
- Lagos et al. (2017) Lagos, C. d. P., Theuns, T., Stevens, A. R. H., et al. 2017, MNRAS, 464, 3850
- Laigle et al. (2016) Laigle, C., McCracken, H. J., Ilbert, O., et al. 2016, The Astrophysical Journal Supplement Series, 224, 24
- Lavaux & Hudson (2011) Lavaux, G., & Hudson, M. J. 2011, MNRAS, 416, 2840
- Leja et al. (2013) Leja, J., van Dokkum, P., & Franx, M. 2013, ApJ, 766, 33
- Massey et al. (2010) Massey, R., Stoughton, C., Leauthaud, A., et al. 2010, MNRAS, 401, 371
- McCracken et al. (2012) McCracken, H. J., Milvang-Jensen, B., Dunlop, J., et al. 2012, VizieR Online Data Catalog, J/A+A/544/A156
- Muzzin et al. (2013) Muzzin, A., Marchesini, D., Stefanon, M., et al. 2013, ApJ, 777, 18
- Naab et al. (2009) Naab, T., Johansson, P. H., & Ostriker, J. P. 2009, ApJ, 699, L178
- Naab et al. (2014) Naab, T., Oser, L., Emsellem, E., et al. 2014, MNRAS, 444, 3357
- Newman et al. (2019) Newman, A., Bezanson, R., Johnson, S., et al. 2019, BAAS, 51, 145
- Newman et al. (2018) Newman, A. B., Belli, S., Ellis, R. S., & Patel, S. G. 2018, ApJ, 862, 126
- Newman et al. (2012) Newman, A. B., Ellis, R. S., Bundy, K., & Treu, T. 2012, ApJ, 746, 162
- Newman et al. (2013) Newman, S. F., Genzel, R., Förster Schreiber, N. M., et al. 2013, ApJ, 767, 104
- Patel et al. (2013) Patel, S. G., van Dokkum, P. G., Franx, M., et al. 2013, ApJ, 766, 15
- Peng et al. (2002) Peng, C. Y., Ho, L. C., Impey, C. D., & Rix, H.-W. 2002, AJ, 124, 266
- Peng et al. (2010) —. 2010, AJ, 139, 2097
- Penoyre et al. (2017) Penoyre, Z., Moster, B. P., Sijacki, D., & Genel, S. 2017, MNRAS, 468, 3883
- Straatman et al. (2018) Straatman, C. M. S., van der Wel, A., Bezanson, R., et al. 2018, The Astrophysical Journal Supplement Series, 239, 27
- Toft et al. (2017) Toft, S., Zabl, J., Richard, J., et al. 2017, Nature, 546, 510
- Torrey et al. (2017) Torrey, P., Wellons, S., Ma, C.-P., Hopkins, P. F., & Vogelsberger, M. 2017, MNRAS, 467, 4872
- Torrey et al. (2015) Torrey, P., Wellons, S., Machado, F., et al. 2015, MNRAS, 454, 2770
- van de Sande et al. (2013) van de Sande, J., Kriek, M., Franx, M., et al. 2013, ApJ, 771, 85
- van de Sande et al. (2017) van de Sande, J., Bland-Hawthorn, J., Brough, S., et al. 2017, MNRAS, 472, 1272
- van de Sande et al. (2019) van de Sande, J., Lagos, C. D. P., Welker, C., et al. 2019, MNRAS, 484, 869
- van der Wel et al. (2008) van der Wel, A., Holden, B. P., Zirm, A. W., et al. 2008, ApJ, 688, 48
- van der Wel et al. (2011) van der Wel, A., Rix, H.-W., Wuyts, S., et al. 2011, ApJ, 730, 38
- van der Wel et al. (2014) van der Wel, A., Franx, M., van Dokkum, P. G., et al. 2014, ApJ, 788, 28
- van der Wel et al. (2016) van der Wel, A., Noeske, K., Bezanson, R., et al. 2016, The Astrophysical Journal Supplement Series, 223, 29
- van Dokkum et al. (2010) van Dokkum, P. G., Whitaker, K. E., Brammer, G., et al. 2010, ApJ, 709, 1018
- van Dokkum et al. (2013) van Dokkum, P. G., Leja, J., Nelson, E. J., et al. 2013, ApJ, 771, L35
- Veale et al. (2017) Veale, M., Ma, C.-P., Greene, J. E., et al. 2017, MNRAS, 471, 1428
- Waskom et al. (2016) Waskom, M., Botvinnik, O., drewokane, et al. 2016, Seaborn: V0.7.0 (January 2016), v.v0.7.0, Zenodo, doi:10.5281/zenodo.45133
- Wellons et al. (2015) Wellons, S., Torrey, P., Ma, C.-P., et al. 2015, MNRAS, 449, 361
- Wellons et al. (2016) —. 2016, MNRAS, 456, 1030