Explaining the chemical trajectories of accreted and in-situ halo stars of the Milky Way
Abstract
The Milky Way underwent its last significant merger ten billion years ago, when the Gaia-Enceladus-Sausage (GES) was accreted. Accreted GES stars and progenitor stars born prior to the merger make up the bulk of the inner halo. Even though these two main populations of halo stars have similar durations of star formation prior to their merger, they differ in [/Fe]-[Fe/H] space, with the GES population bending to lower [/Fe] at a relatively low value of [Fe/H]. We use cosmological simulations of a ’Milky Way’ to argue that the different tracks of the halo stars through the [/Fe]-[Fe/H] plane are due to a difference in their star formation history and efficiency, with the lower mass GES having its low and constant star formation regulated by feedback whilst the higher mass main progenitor has a higher star formation rate prior to the merger. The lower star formation efficiency of GES leads to lower gas pollution levels, pushing [/Fe]-[Fe/H] tracks to the left. In addition, the increasing star formation rate maintains a higher relative contribution of Type II SNe to Type Ia SNe for the main progenitor population that formed during the same time period, thus maintaining a relatively high [/Fe]. Thus the different positions of the downturns in the [/Fe]-[Fe/H] plane for the GES stars are not reflective of different star formation durations, but instead reflect different star formation efficiencies.
keywords:
galaxies: dwarf - evolution - formation - haloes - clusters1 Introduction
The Galactic halo can be defined kinematically as stars with tangential velocities greater than 200 km s-1 relative to the local standard of rest. So defined, the local stellar halo (within 2 kpc at least) is largely comprised of two populations. One population has relatively low eccentricities whilst the other has relatively large radial motions and high eccentricities (e.g. Mackereth et al., 2018; Amarante et al., 2020). This latter population was first identified by its kinematics using Hipparcos data (Chiba & Beers, 2000) and has long been considered to have originated from an accreted satellite (Brook et al., 2003).
Recent studies confirmed that this phase-space structure is a major contributor to the stellar halo (Helmi et al., 2018; Belokurov et al., 2018; Iorio & Belokurov, 2019), and originates in the most significant accretion event in the Milky Way’s history. The accreted galaxy that contributed stars to this structure is now referred to variously as Gaia-Enceladus (Helmi et al., 2018) and the Gaia sausage (Belokurov et al., 2018). We refer to it as the Gaia-Enceladus-Sausage (GES) in what follows. A second, smaller accreted galaxy, dubbed SEQUOIA, has also been identified (Myeong et al., 2019).
The presence of two kinematically and chemically distinct halo populations has been long discussed. A difference in age of 2-3 Gyr had previously been inferred, with the low-alpha, accreted population being assigned younger ages (e.g. Schuster et al., 2012). These two dominant populations of inner halo stars also separate in their Hertzsprung-Russell diagram (HRD) (Gaia Collaboration et al., 2018b; Haywood et al., 2018), with the stars originating in GES forming a blue sequence, whilst the other population forms a red sequence. However, using robust techniques of CMD-fitting to derive age distributions of stellar populations, which had previously been used on nearby dwarf galaxies, Gallart et al. (2019) found that the two inner halo populations are actually coeval.111To be clear, our analysis is focussed upon the inner halo population; age gradients from the inner to the outer halo are the focus of complementary works such as Carollo et al. (2018).
Adopting these findings regarding ages points to a particular formation sequence of the Milky Way: the red sequence halo stars were heated from the more massive main progenitor of the Milky Way (MWprog) during the accretion of GES and thus can be considered the ’in situ halo’ using the terminology of Zolotov et al. (2009), whilst the blue sequence halo stars belonged to the accreted GES. The coeval ages of the two halo populations implies that no stars that formed in the Milky Way’s main progenitor after this accretion event were heated to halo-like kinematics, meaning that the GES accretion can be considered the last significant (possibly major) merger event in the Milky Way’s history.
Using the Gaia second data release (DR2 Gaia Collaboration et al., 2018a) and spectroscopic data from LAMOST (Zhao et al., 2012) and GALAH (Buder et al., 2018), Gallart et al. (2019) showed that the thick disc continued to form most of its stars after the GES event and, thus, is dominated by stars younger than these two halo populations (although with a tail to older stars). The thick disc stars fall on the same sequence of the CMD as the red sequence halo stars. Thus, the stars in the red sequence were formed ’in situ’ in the Milky Way’s main progenitor, before, during, and after the GES merger event. However, it was only during the GES event that some main progenitor stars were heated enough to be classified as (in situ) halo stars. In the following we refer to both ’in situ halo’ and thick disc stars, i.e. old stars on the red sequence of the CMD, as ’main progenitor stars’. ’Main progenitor stars’ in this context are not taken to include the thick disc stars that formed after the merger, nor the thin disc stars, even though they clearly also form within the same galactic structure. While the later forming thick disc stars still fall in the same red sequence as the so-defined ’main progenitor stars’, they tend to be even redder than the red sequence of the kinematically-selected halo.
Using complementary arguments based on a combination of kinematic information from Gaia DR2 and detailed chemical abundances from the SDSS/APOGEE (Holtzman et al., 2018) data, Di Matteo et al. (2018) also conclude that the stars in the red halo sequence were formed within the main progenitor. They refer to this population as ’thick disc’ stars, due to their chemical similarity. Any difference between these results and that of Gallart et al. (2019) regarding this population of stars is purely semantic. Both studies identify these stars as being formed within the main progenitor, with Haywood et al. (2018); Di Matteo et al. (2018) calling them the high velocity tail of the thick disc, whilst Gallart et al. (2019) follows the terminology of Zolotov et al. (2009) in calling them ’in situ halo’ stars. Results from FIRE simulations (Bonaca et al., 2017) also support the notion that the highest metallicity halo stars were formed ’in situ’. What is important to note is that the age distributions inferred by Gallart et al. (2019) imply that 1) only main progenitor stars that formed before (and perhaps during) the merger with GES gain such high velocities, and 2) thick disc stars were forming prior to, during, and after this merger. Further support for these conclusions comes from abundances of high velocity stars uncovered by Skymapper, and ages derived using isochrone fitting techniques (Sahlholdt et al., 2019).
A key component of the Di Matteo et al. (2018) study is the use of -elements, primarily formed in Type II supernovae (SNeII), and their comparison with abundances of Fe, largely formed in Type Ia supernovae (SNeIa) and thus delayed in time compared to -element production. In particular, the GES stars fall in a different region of the [Fe/H] vs [O/Fe] plane than the old main progenitor (thick disc and ’in situ’ halo) stars, with the GES stars bending downward toward low values of [O/Fe] at a lower value of [Fe/H] than the main progenitor stars.
Earlier, Nissen & Schuster (2010) had used kinematics and [O/Fe] to argue that a sample of stars that today we know are part of the ”blue sequence” halo stars were likely accreted, whilst stars falling in the red sequence were either heated from the early forming main progenitor or formed ”as the first stars during the collapse of a proto-Galactic gas cloud”. Haywood et al. (2018) also concluded that the ’blue sequence’ halo stars were likely accreted, and agreed with the scenario whereby the red sequence halo stars were heated from the main progenitor - in particular, that they were heated from the early-forming thick disc. Gallart et al. (2019) contributed to this scenario by showing that the red sequence ’in situ’ halo stars were heated from the disc by the same event that incorporated the blue sequence stars into the inner halo - i.e., by the accretion of the GES. The age information provided by the latter has allowed a clear picture of the Milky Way’s formation to emerge.
Efforts have been made to use hydrodynamical simulations to constrain the mass of the GES galaxy using metallicities and/or -abundances to infer the mass of the accreted galaxies that contributed to the formation of the inner halo (Robertson et al., 2005; Font et al., 2006; Zolotov et al., 2010; Tissera et al., 2013; Fattahi et al., 2019; Mackereth et al., 2018; Fernández-Alvar et al., 2019; Vincenzo et al., 2019). Our simulations support the notion that the chemical abundance patterns of the halo stars reflect the fact that a relatively massive accretion event occurred. In this paper, we study the origin of the difference in chemical abundances between halo stars accreted from the GES and those stars born in the main progenitor (and heated by the interaction with the GES).
Previously, Nissen & Schuster (2010), following from Gilmore & Wyse (1998), suggested that the origin of the difference is the duration of star formation, with the low [/Fe] population forming over a longer time such that they are more enriched by SNeIa. This fit with the previously held idea that the GES stars were younger than the main progenitor halo stars. Haywood et al. (2018) invoked the difference in star formation efficiency for explaining the two tracks in the [Fe/H] vs [O/Fe] plane, without putting constraints on the differences in the duration of star formation. Fernández-Alvar et al. (2019) suggest that it is a combination of both differences in the duration and the intensity of star formation, combined with differences in the initial mass functions (see also Kobayashi et al., 2014) of the two merging galaxies, that explains the different chemical evolution tracks.
Here, we leverage the result of Gallart et al. (2019) to place new constraints on the origin of these tracks in abundance space. Gallart et al. (2019) show that the two halo populations were formed over essentially the same period. Thus, the different tracks in the [Fe/H] vs [/Fe] plane are not due to a longer time-span of star formation in the GES galaxy compared to the population of halo stars that formed in the main progenitor.
We explore a cosmological simulation of a Milky Way analogue which has a merger history that resembles that of the Galaxy, with an early last significant merger. In the simulated galaxy, the accreted galaxy and main progenitor have similar [Fe/H] vs [/Fe] distributions as observed in the blue and red sequences of the Milky Way local stellar halo. We identify the reason for the different tracks as being a combination of the different star formation efficiencies and the star formation history before the merger.
Before proceeding, a quick note on terminology. Some studies refer to ”star formation timescales”, a term we find ambiguous. Does it mean duration of star formation, or the timescale for exhausting the existing gas? Here we refer to duration of star formation and star formation efficiency. The paper is organised as follows: in §2 we introduce the simulated Milky Way analogue; in §3 we analyse the simulation and show that the different abundances in the accreted galaxy and the main progenitor is caused by their different star formation efficiencies and star formation histories; in §4 we summarise and discuss the results.
2 Simulation
2.1 Simulation details
The simulated Milky Way analogue galaxy used in this study comes from the MaGICC project (Brook et al., 2012; Stinson et al., 2012) which were the first cosmological hydrodynamical simulations to reproduce galaxy scaling relations. The simulation employs the SPH code Gasoline (Wadsley et al., 2004; Keller et al., 2014) that includes ultraviolet (UV) heating, ionization and cooling due to hydrogen, helium, and metals (Shen et al., 2010) and a subgrid model for turbulent mixing of metals and energy (Wadsley et al., 2008).
Stars form from cool ( K), dense ( cm-3) gas. As metal cooling readily produces dense gas, the star formation density threshold is set to the maximum density at which gravitational instabilities can be resolved, ( cm-3), where M⊙ and is the gravitational softening (310 pc). Such gas is converted to stars according to the equation
| (1) |
where, is the mass of the star particle formed, is the timestep between star formation events ( yr in these simulations), and is the gas particle’s dynamical time. is the efficiency parameter, i.e. the fraction of gas that will be converted into stars during . Note that this efficiency parameter is not to be confused with the effective star formation efficiency we refer to in this study, which is measured on larger temporal and spatial scales, and which is largely regulated by feedback rather than by the details of the star formation implementation.
Star particles represent co-eval represent stellar populations, and the lifetimes of the constituent stars can be traced, such that they feed energy back into the ISM via blast-wave supernova (SN) feedback (Stinson et al., 2006) and early stellar feedback from massive stars (Stinson et al., 2013). The AHF halo finder (Knollmann & Knebe, 2009) is used to identify halos and the pynbody package (Pontzen et al., 2013) is used for parts of the analysis.
Details of the chemical evolution model are found in Stinson et al. (2006). We employ a Chabrier (Chabrier, 2003) initial mass function (IMF). We use the Raiteri et al. (1996) parameterisation of stellar lifetimes for stars of varying metallicities. Stars with masses in the range of 8-40 M☉ explode as SNeII. The number of SNeIa follows the Raiteri et al. (1996) implementation of the Greggio & Renzini (1983) single-degenerate progenitor model. This ensures a finite time delay for the main channels of Fe production, i.e., SNeII and SNeIa. We employed yields from the literature for SNeII (Woosley & Weaver, 1995) and SNeIa (Nomoto et al., 1997). In what follows, we use oxygen as a proxy for . These are relatively simplistic models, but they do allow us to identify the main drivers of chemical abundance evolution within the simulations.
The Numerical Investigation of a Hundred Astrophysical Objects (NIHAO, Wang et al. 2015; Obreja et al. 2016), simulated 125 galaxies using a very similar framework to MaGICC with some technical updates that do not result in significant differences in the resultant galaxies. This has allowed comparison of these simulations with an even larger range of observations (e.g. Obreja et al., 2019), providing greater confidence in the adopted model.
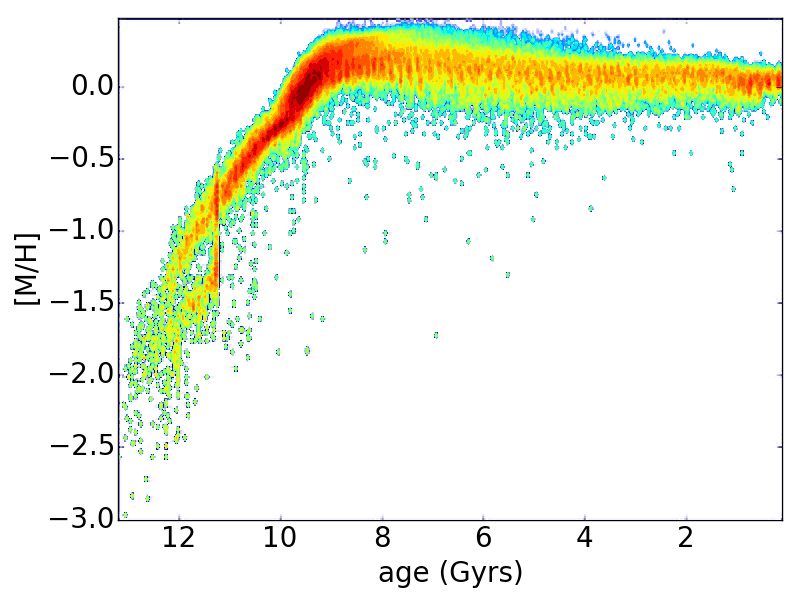
When selecting the Milky Way analogue for this study, 18 simulations of similar mass as the Milky Way were explored, 5 from the MaGICC project and 13 from NIHAO. We used the closest analogue to the Milky Way (galaxy g15784 from the MaGICC program - see also, Gibson et al. 2013; Walker et al. 2014) in terms of the merger history, the metallicity-age relation in the solar region (see Fig 1.) and tracks of the alpha to iron abundances in the solar region (see Fig 2.). An exploration of how merger history affects abundances in the discs of Milky Way analogues in the NIHAO sample can be found in Buck (2020). The thin and thick discs of this particular simulated Milky Way analogue were extensively studied in (Gibson et al., 2013) and (Miranda et al., 2016), respectively, and shown to have a range of properties, in particular chemical abundance gradients, that compare favourably with observations of the Milky Way, and indeed was shown to better reproduce these than other Milky Way mass galaxies explored in those studies. It is likely no co-incidence that the Milky Way analogue that best matches the Milky Way chemical properties has a merger history that appears to be similar to that of the Milky Way, i.e. an early significant/major merger around 10-11 Gyrs ago (Helmi et al., 2018; Chaplin et al., 2020) followed by relatively insignificant mergers and interactions which have only disturbed the disc in a minor (though interesting) way, in particular Sagittarius (Purcell et al. 2011; Laporte et al. 2019; Antoja et al. 2018; Ruiz-Lara et al. 2020).
The simulation was not tailored to have a merger that mimics that of GES; we simply chose a case that was the best analogue to such a system. Therefore, comparisons with observations can not be expected to match precisely, particularly when given that the merger occurred at a slightly different time (most likely slightly earlier in the simulation, although a degree of uncertainty remains as to the exact time of the real merger), and with slightly different mass ratios, and that there are other uncertainties such as the input yields that we use in our model that sets the quantitive values of the ratio [/Fe] for example.
Nevertheless, the merger history and similarity of its disc properties to the observed Milky Way makes this a particularly good analogue for our study.
The simulated Milky Way is the one that qualitatively best resembles the real Milky Way in the [/Fe]-[Fe/H] plane. Figure 1 shows the age-metallicity relation for stars in the ’solar region’. An early significant merger is evident around 11 Gyrs ago, redshift 2.6, followed by relatively few minor accretion events. A flat age-metallicity relation is found over the past 8 Gyrs, which corresponds to the epoch of thin disc formation and evolution.
2.2 Properties of the main progenitor and satellite prior to the merger
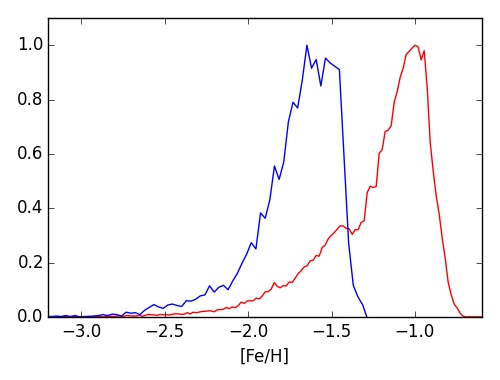
We measure the masses of the main progenitor and accreted galaxy prior to the latter entering the virial radius of the former, meaning that the total, stellar, and gas masses of the merging galaxies shown in Table 1 are measured at redshift 3. Figure 2 shows the significantly different metallicity distribution functions of the main progenitor (red) and GES analogue (blue) prior to their merger. Both the main progenitor and the GES analogues are around 0.2-0.3 dex lower in metallicity than the corresponding populations observed in the Milky Way (see e.g. Fig 2 of Gallart et al., 2019). From the slope of the age-metallicity relation in Fig. 1, one can see that the metallicities would match the observed ones if the merger was around 0.5 Gyrs later, i.e. around 10.5 Grys ago rather than 11 Gyrs ago as happened in this simulation. A systematic offsets between the metallicities in the simulation and observations may also be attributed, in part, to our specific choice of yields and IMF.
| Mtotal | Mstars | Mgas | |
|---|---|---|---|
| Main Progenitor | 2.3e11 | 2.0e9 | 3.4e10 |
| Accreted Galaxy | 9.7e10 | 2.9e8 | 1.5e10 |
2.3 The [/Fe] vs [Fe/H] plane
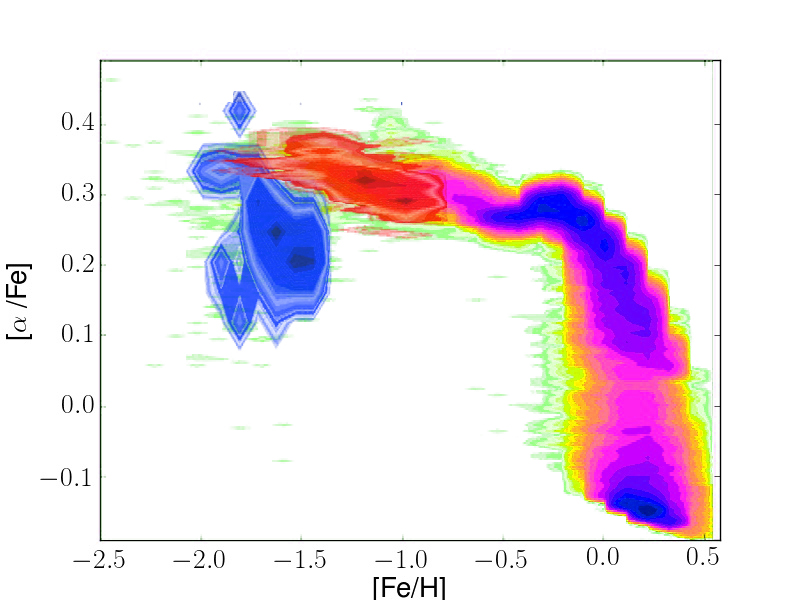
Figure 3 shows the [/Fe] vs [Fe/H] for the ’solar neighbourhood’ region in the simulated galaxy. We define the solar neighbourhood as within an annulus of 7-9 kpc from the galactic centre and within 2kpc of the plane of the disc. This is not quite the same as a 2kpc sphere volume around the Sun in the Galaxy, but allows us to sample a similar region that has a larger volume, which is required as the simulation has far fewer ’star particles’ compared to the observed Gaia sample of stars. The results are robust to the precise region that we chose as the Solar Neighbourhood, with our main conclusions not affected by chosing any region from 4-11 kpc in the disc within 4 kpc of the disc plane.
The thick and thin disc separation is evident at [/Fe]0 [Fe/H]0. Overlaid are the stars that originated in the main progenitor (red) and major accreted satellite - i.e., the GES analogue (blue) prior to their merger at z2. The different tracks in this plane are evident. It is also evident that the main progenitor smoothly blends into the thick disc track, which continues to form after the merger. The aim of this paper is to better understand the physics driving these different tracks, and their trajectories, for the main progenitor and the accreted GES analogue galaxy, prior to their merger.
3 Results: Explaining the trajectories in the [/Fe] vs [Fe/H] plane
3.1 Global properties of main progenitor and accreted galaxy
Table 1 shows the total, stellar and gas masses of the two merging galaxies. The main progenitor is 2.4 times more massive than the accreted galaxy, but has a factor of 6.9 more mass in stars. This is in agreement with the stellar mass-halo mass relation for galaxies at high-redshift (Behroozi et al., 2013). Yet the ratio of the gas masses (2.3) follows closely the ratio of total masses rather than the ratio of stellar masses. This also makes sense, with lower mass galaxies known to have higher gas fractions than higher mass galaxies in this mass range, at least at =0 (e.g. Bradford et al., 2015).
In what follows, we define star formation efficiency (SFE) as the rate at which gas is converted to stars, i.e. SFESFR/Mgas where SFR is the star formation rate and Mgas is the total gas mass within the virial radius. Note that SFE is defined as the ratio of star formation rate and total gas mass within the virial radius, rather than cold gas or HI gas. This allows the accounting for ongoing gas cooling, in particular hydrogen rich gas, into the star forming regions, as well as the outflow of gas beyond the star forming regions. We also explore the effect of restricting to observable gas.
Overall, the merging galaxies have very similar baryon fractions within their virial radii. This implies that preferential outflows of metals in the lower mass galaxy is not the driver of the different tracks in [/Fe] space. However, the two merging galaxies do have different efficiencies of converting gas into stars. Could a difference in star formation efficiency be driving the different tracks in the [/Fe] vs [Fe/H] plane?
3.2 Evolution of [Fe/H], [O/H] and [Fe/O]
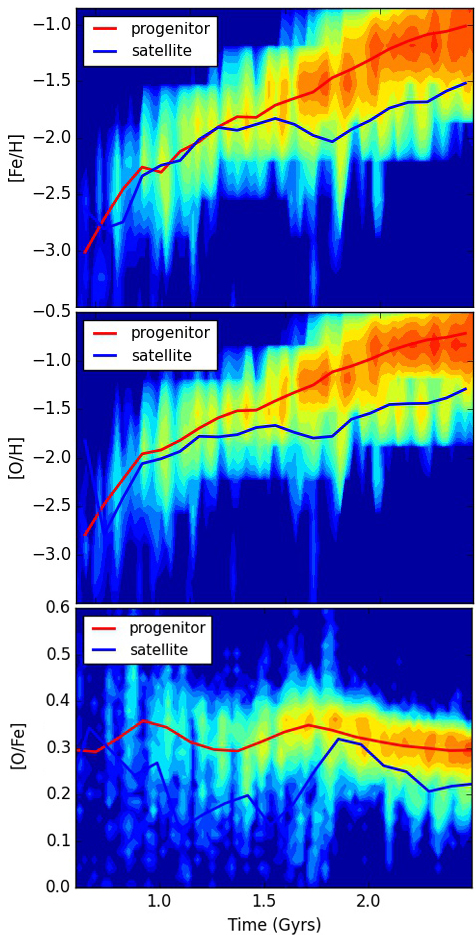
We look for clues in the temporal evolution of [Fe/H], [O/H], and [O/Fe]. The top panel of Figure 4 shows that the main progenitor reaches a factor of 3 higher in [Fe/H] than does the accreted galaxy by the time of the merger. Similarly, the middle panel of Figure 4 shows the same behaviour, both qualitatively and quantitatively, for [O/H]. In other words, the ISM is more enriched in both iron and oxygen in the more massive progenitor, a natural consequence of having converted a higher fraction of its baryons into stars.
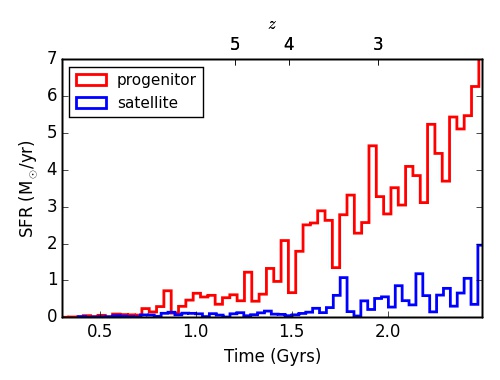
By contrast, the difference in [O/Fe] is relatively small (no more than 0.1 dex, as per the bottom panel of Figure 4. One can then see that the highest density red region in Figure 3 is offset approximately 0.5 dex rightwards and 0.1 dex upwards from the highest density blue region. We attribute the 0.1 dex offset to the difference in the rate of change of star formation. In particular, the main progenitor has an increasing star formation rate as we show next.
3.3 Star Formation Histories
In Figure 5, we show the star formation histories of the main progenitor (red) and accreted galaxy (blue) prior to the accreted galaxy entering the virial radius of the main progenitor. It is clear that the star formation rate is rapidly increasing for the main progenitor. By contrast, feedback is able to regulate the star formation and keep the relatively constant star formation rate in the lower accreting mass galaxy. An increasing star formation rate can sustain a relatively high [/Fe] in the main progenitor, because the rate of SNeII is linked to the current SFR, whilst the rate of SNeIa is related to the earlier (and lower) SFR. Once the star formation rate peaks and starts dropping, this situation is reversed: the rate of SNeIa relates to the earlier (and higher) SFR whilst the rate of SNeII is determined by the current (lower) SFR. This transition from increasing to decreasing star formation rates could be expected to result in a relatively rapid transition from high to low [/Fe].
Looking at the [Mg/Fe]-[Fe/H] plane of data from APOGEE DR14, as shown in Figure 1 of Mackereth et al. (2018), one can see that similar offsets of 0.5 dex rightwards and 0.1 dex upwards, as we found in our simulations, can explain the observational results.
3.4 Star Formation Efficiencies
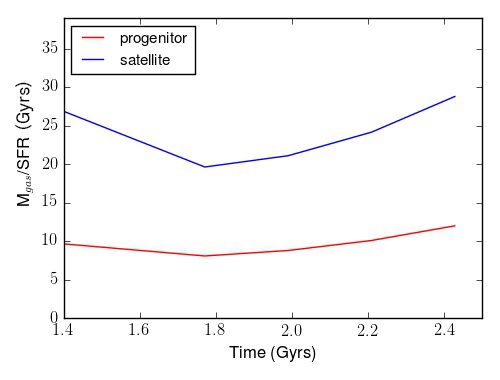
Because the Kennicutt-Schmidt law has a slope greater than 1, an increased star formation rate is associated with an increased star formation efficiency. In the simulations, where a Kennicutt-Schmidt law is imposed, this is also reflected in the greater star-to-gas ratio in the main progenitor than in the accreted galaxy, as shown in Table 1. In Figure 6 we show the inverse of the star formation efficiencies (SFEs) of the main progenitor and the accreted satellite, during the time leading up to their merger in the simulation. The plot shows that the main progenitor would consume its gas within ten Gyrs, whilst the satellite would take 25 Gyrs, more than a Hubble time, to consume its gas.
When restricting to only include ‘observable gas’ or gas in the star forming region, meaning 4/3 times the HI gas mass, the SFE is around an order of magnitude higher for both the main progenitor and the accreting galaxy, increasing from 0.04 and 0.1 to 0.4 and 1 Gyrs-1 respectively. The difference in star formation efficiency remains evident when the definition of star formation efficiency is restricted to ’observable’ gas.
3.5 Gas density profiles
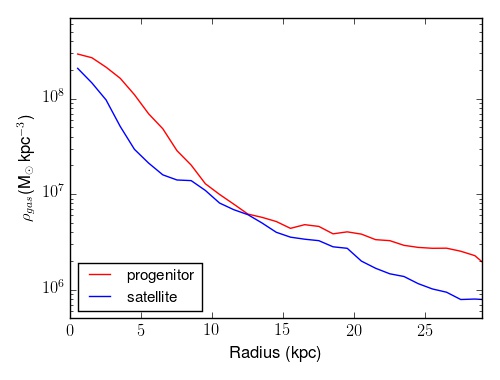
In Figure 7 we plot the density profile of gas for the main progenitor (red) and accreted satellite (blue) prior to their merger. The higher density in the inner star forming region of the main progenitor drives higher star formation rates which, via the (imposed) Kennicutt-Schmidt law, means higher star formation efficiencies. We note as well the slight differences in the shape of the profiles.
4 Conclusions
Using a simulated Milky Way analogue galaxy that has a final significant merger (major merger in terms of total mass ratios) at early times, qualitatively mimicing the Gaia-Encaladas-Sausage (GES) accretion event, we have explored the cause of the different abundances of the high velocity (halo) stars that were accreted compared to those that were heated from the main progenitor (this ’in situ’ halo population has also been referred to as the high velocity tail of the thick disc). We show that, prior to this early merger, the main progenitor and merging GES analogue have different star formation histories and different age-metallicity relations.
Our main finding is that the difference in abundances is driven by different star formation efficiencies. Possible other explanations that are not supported by our model include different durations of star formation, preferential outflows of particular metals, or different Initial Mass Functions (IMF). We discuss them in turn below:
The finding of common ages (Gallart et al. 2019, see also Sahlholdt et al. 2019) for halo stars formed in GES and the main progenitor allowed us to rule out a longer duration of star formation as an explanation for the two different tracks these populations take in the [Fe/H] vs [/Fe] plane. This degeneracy breaking allowed us to explore the origin of these differing tracks in abundance space.
We found that the main progenitor and accreted galaxy retain the same amount of baryons prior to their merging, allowing us to rule out outflows as the main driver of the different tracks they take through the [Fe/H] vs [/Fe] plane.
Finally, our study does not rule out the possibility of a varying IMF in the different galaxies that formed the bulk of the inner halo. Some degenerate model may be possible in which the IMF in the more massive galaxies have more massive stars than the less massive galaxies. Such a model would need to match the vast array of galaxy properties that our simulations have been shown to reproduce. We simply have shown that a varying IMF is not required, at least in these relatively low mass systems that merged around 10 Gyrs ago.
We note that, importantly, the simulated Milky Way shares many features of the observed Milky Way, particularly in its halo, thick disc and thin disc kinematics and abundances (see Brook et al., 2012; Gibson et al., 2013; Walker & Loeb, 2014; Miranda et al., 2016; Gallart et al., 2019, as well as Fig. 1 of this work). We also note that this same model for galaxy formation reproduces observed galaxy scaling relations over a wide range of masses. This is important because this again breaks many degeneracies that may exist in models that purely match the relation of interest in this paper - i.e., models that may reproduce the [Fe/H] vs [O/Fe] features but cannot form realistic galaxies in a broader context.
Our explanation is the most simple one in many regards. The Kennicutt-Schmidt law that relates gas density to star formation has a power law index greater than unity, which implies that galaxies with higher star formation rates have higher star formation efficiencies. The lower star formation efficiencies in the lower mass galaxy means that gas remains generally metal-poor, even with the two galaxies forming stars over the same length of time. In addition, the increasing SFR in the main progenitor helps in keeping the relatively high [O/Fe], by ensuring that SNII yields remain dominant over SN1a. We believe that this is the dominant mechanism driving the different tracks in the [Fe/H] vs [O/Fe] between GES and the main progenitor. Combined, these mechanisms lead to the different chemical evolution paths between the main progenitor and GES before the merger, even with the two galaxies forming stars over the same length of time.
This is an important finding as it is only in the Milky Way that such detailed abundances can be studied and related to early forming galaxies. It is quite possible that our explanation can be generalised to the origin of the different [Fe/H] vs [O/Fe] relations for different galaxies and/or components.
Although other explanations are possible in the parameter space provided, we argue that the one presented here gains support from the self-consistent cosmological simulation model from which it was drawn naturally. That is to say, cosmological simulations using the same physical recipes have been shown to match a wide range of observed galaxy properties over a wide range of galaxy masses. This is particularly important when exploring accretion of low mass objects onto Milky Way mass galaxies: it is crucial to be able to reproduce the properties of lower mass galaxies in order to have confidence in the properties of the accreted galaxy.
Acknowledgements
BKG acknowledges the support of STFC through the University of Hull Consolidated Grant ST/R000840/1 and access to viper, the University of Hull High Performance Computing Facility.
References
- Amarante et al. (2020) Amarante J. A. S., Smith M. C., Boeche C., 2020, MNRAS, p. 78
- Antoja et al. (2018) Antoja T., et al., 2018, Nature, 561, 360
- Behroozi et al. (2013) Behroozi P. S., Wechsler R. H., Conroy C., 2013, ApJ, 770, 57
- Belokurov et al. (2018) Belokurov V., Erkal D., Evans N. W., Koposov S. E., Deason A. J., 2018, MNRAS, 478, 611
- Bonaca et al. (2017) Bonaca A., Conroy C., Wetzel A., Hopkins P. F., Kereš D., 2017, ApJ, 845, 101
- Bradford et al. (2015) Bradford J. D., Geha M. C., Blanton M. R., 2015, ApJ, 809, 146
- Brook et al. (2003) Brook C. B., Kawata D., Gibson B. K., Flynn C., 2003, ApJ, 585, L125
- Brook et al. (2012) Brook C. B., Stinson G., Gibson B. K., Wadsley J., Quinn T., 2012, MNRAS, 424, 1275
- Buck (2020) Buck T., 2020, MNRAS, 491, 5435
- Buder et al. (2018) Buder S., et al., 2018, MNRAS, 478, 4513
- Carollo et al. (2018) Carollo D., Tissera P. B., Beers T. C., Gudin D., Gibson B. K., Freeman K. C., Monachesi A., 2018, ApJ, 859, L7
- Chabrier (2003) Chabrier G., 2003, PASP, 115, 763
- Chaplin et al. (2020) Chaplin W. J., et al., 2020, arXiv e-prints, p. arXiv:2001.04653
- Chiba & Beers (2000) Chiba M., Beers T. C., 2000, AJ, 119, 2843
- Di Matteo et al. (2018) Di Matteo P., Haywood M., Lehnert M. D., Katz D., Khoperskov S., Snaith O. N., Gómez A., Robichon N., 2018, arXiv e-prints,
- Fattahi et al. (2019) Fattahi A., et al., 2019, MNRAS, 484, 4471
- Fernández-Alvar et al. (2019) Fernández-Alvar E., Tissera P. B., Carigi L., Schuster W. J., Beers T. C., Belokurov V. A., 2019, MNRAS, 485, 1745
- Font et al. (2006) Font A. S., Johnston K. V., Bullock J. S., Robertson B. E., 2006, ApJ, 638, 585
- Gaia Collaboration et al. (2018a) Gaia Collaboration et al., 2018a, A&A, 616, A1
- Gaia Collaboration et al. (2018b) Gaia Collaboration et al., 2018b, A&A, 616, A10
- Gallart et al. (2019) Gallart C., Bernard E. J., Brook C. B., Ruiz-Lara T., Cassisi S., Hill V., Monelli M., 2019, arXiv e-prints,
- Gibson et al. (2013) Gibson B. K., Pilkington K., Brook C. B., Stinson G. S., Bailin J., 2013, A&A, 554, A47
- Gilmore & Wyse (1998) Gilmore G., Wyse R. F. G., 1998, AJ, 116, 748
- Greggio & Renzini (1983) Greggio L., Renzini A., 1983, A&A, 118, 217
- Haywood et al. (2018) Haywood M., Di Matteo P., Lehnert M. D., Snaith O., Khoperskov S., Gómez A., 2018, ApJ, 863, 113
- Helmi et al. (2018) Helmi A., Babusiaux C., Koppelman H. H., Massari D., Veljanoski J., Brown A. G. A., 2018, Nature, 563, 85
- Holtzman et al. (2018) Holtzman J. A., et al., 2018, AJ, 156, 125
- Iorio & Belokurov (2019) Iorio G., Belokurov V., 2019, MNRAS, 482, 3868
- Keller et al. (2014) Keller B. W., Wadsley J., Benincasa S. M., Couchman H. M. P., 2014, MNRAS, 442, 3013
- Knollmann & Knebe (2009) Knollmann S. R., Knebe A., 2009, ApJS, 182, 608
- Kobayashi et al. (2014) Kobayashi C., Ishigaki M. N., Tominaga N., Nomoto K., 2014, ApJ, 785, L5
- Laporte et al. (2019) Laporte C. F. P., Minchev I., Johnston K. V., Gómez F. A., 2019, MNRAS, 485, 3134
- Mackereth et al. (2018) Mackereth J. T., Crain R. A., Schiavon R. P., Schaye J., Theuns T., Schaller M., 2018, MNRAS, 477, 5072
- Miranda et al. (2016) Miranda M. S., et al., 2016, A&A, 587, A10
- Myeong et al. (2019) Myeong G. C., Vasiliev E., Iorio G., Evans N. W., Belokurov V., 2019, MNRAS, 488, 1235
- Nissen & Schuster (2010) Nissen P. E., Schuster W. J., 2010, A&A, 511, L10
- Nomoto et al. (1997) Nomoto K., Iwamoto K., Nakasato N., Thielemann F. K., Brachwitz F., Tsujimoto T., Kubo Y., Kishimoto N., 1997, Nucl. Phys. A, 621, 467
- Obreja et al. (2016) Obreja A., Stinson G. S., Dutton A. A., Macciò A. V., Wang L., Kang X., 2016, MNRAS, 459, 467
- Obreja et al. (2019) Obreja A., et al., 2019, MNRAS, 487, 4424
- Pontzen et al. (2013) Pontzen A., Roškar R., Stinson G., Woods R., 2013, pynbody: N-Body/SPH analysis for python, Astrophysics Source Code Library (ascl:1305.002)
- Purcell et al. (2011) Purcell C. W., Bullock J. S., Tollerud E. J., Rocha M., Chakrabarti S., 2011, Nature, 477, 301
- Raiteri et al. (1996) Raiteri C. M., Villata M., Navarro J. F., 1996, A&A, 315, 105
- Robertson et al. (2005) Robertson B., Bullock J. S., Font A. S., Johnston K. V., Hernquist L., 2005, ApJ, 632, 872
- Sahlholdt et al. (2019) Sahlholdt C. L., Casagrande L., Feltzing S., 2019, ApJ, 881, L10
- Schuster et al. (2012) Schuster W. J., Moreno E., Nissen P. E., Pichardo B., 2012, A&A, 538, A21
- Shen et al. (2010) Shen S., Wadsley J., Stinson G., 2010, MNRAS, 407, 1581
- Stinson et al. (2006) Stinson G., Seth A., Katz N., Wadsley J., Governato F., Quinn T., 2006, MNRAS, 373, 1074
- Stinson et al. (2012) Stinson G. S., et al., 2012, MNRAS, 425, 1270
- Stinson et al. (2013) Stinson G. S., Brook C., Macciò A. V., Wadsley J., Quinn T. R., Couchman H. M. P., 2013, MNRAS, 428, 129
- Tissera et al. (2013) Tissera P. B., Scannapieco C., Beers T. C., Carollo D., 2013, MNRAS, 432, 3391
- Vincenzo et al. (2019) Vincenzo F., Spitoni E., Calura F., Matteucci F., Silva Aguirre V., Miglio A., Cescutti G., 2019, MNRAS, 487, L47
- Wadsley et al. (2004) Wadsley J. W., Stadel J., Quinn T., 2004, New A, 9, 137
- Wadsley et al. (2008) Wadsley J. W., Veeravalli G., Couchman H. M. P., 2008, MNRAS, 387, 427
- Walker & Loeb (2014) Walker M. G., Loeb A., 2014, Contemporary Physics, 55, 198
- Walker et al. (2014) Walker A. P., Gibson B. K., Pilkington K., Brook C. B., Dutta P., Stanimirović S., Stinson G. S., Bailin J., 2014, MNRAS, 441, 525
- Wang et al. (2015) Wang L., Dutton A. A., Stinson G. S., Macciò A. V., Penzo C., Kang X., Keller B. W., Wadsley J., 2015, MNRAS, 454, 83
- Woosley & Weaver (1995) Woosley S. E., Weaver T. A., 1995, ApJS, 101, 181
- Zhao et al. (2012) Zhao G., Zhao Y.-H., Chu Y.-Q., Jing Y.-P., Deng L.-C., 2012, Research in Astronomy and Astrophysics, 12, 723
- Zolotov et al. (2009) Zolotov A., Willman B., Brooks A. M., Governato F., Brook C. B., Hogg D. W., Quinn T., Stinson G., 2009, ApJ, 702, 1058
- Zolotov et al. (2010) Zolotov A., Willman B., Brooks A. M., Governato F., Hogg D. W., Shen S., Wadsley J., 2010, ApJ, 721, 738