WAVELENGTH AND REFRACTIVE INDICES FROM INTERFEROMETERY

Kam Modjtahedzadeh Department of Physics, University of California, Santa Barbara
(August 29, 2019)
  • Abstract

    PASCO scientific 012-05187C Precision Interferometer is used in Michelson mode to investigate wavelengths and refractive indices. From varying the distance of the movable mirror in the Michelson setup the wavelength of the HeNe laser beam is found to be 630.6Β±7.9​nmplus-or-minus630.67.9nm630.6\pm 7.9~{}\mathrm{nm}; 0.280.280.28 sigmas away from the accepted 632.8 nm and agreeing with it. Then after considering the fact that the index of refraction for low pressure gasses varies linearly with pressure we place a vacuum cell in front of the movable mirror and pump out the air within it to find the individual slopes. By extrapolating the average slope we calculate the index of refraction for air to be n=1.000226Β±0.000026𝑛plus-or-minus1.0002260.000026n=1.000226\pm 0.000026. This is 1.44 sigmas away from the manufacturer’s measured 1.000263 and barely agreeing with it as we underestimated our error in the fringe count (which is caused by the change in pressure). Furthermore, the vacuum cell is replaced by a crown glass plate which is rotated to vary the length at which the EM wave travels in the Michelson interferometer. The angle of rotation is measured and utilized to find the refractive index of glass to be 1.514Β±0.006plus-or-minus1.5140.0061.514\pm 0.006; agreeing with the accepted value of 1.515 as it is 0.125 sigmas away from it. Thus, along with the wavelength observation this experiment is conducted successfully. Although the experiment to find the refractive index of air is conducted less successfully, it is also prosperous as the measured value is close to the accepted.

1 Introduction

Interferometers are laser based tools used to investigate various properties directly or indirectly relating to EM waves. In our experiment, we resort to the widely used Michelson mode setup to measure the wavelength of our laser beam as well as the indices of refraction for air and crown glass.

Refer to caption
Figure 1: A schematic of the Michelson interferometer. As the beam exits the laser source it passes through an 18​mm18mm18~{}\mathrm{mm} lens and hits the beam splitter. Part of the beam goes through and reflects back after hitting a movable mirror M1subscriptM1\mathrm{M}_{1}; the other part reflects to an adjustable mirror M2subscriptM2\mathrm{M}_{2}, which also reflects it back to the beam splitter. Both parts of the split beam make their way to the viewing screen and create visible fringes.

To find the wavelength of our laser beam, we will be utilizing Bragg’s Law:

2​dm​sin⁑Θ=N​λ,2subscriptπ‘‘π‘šΞ˜π‘πœ†\displaystyle 2d_{m}\sin\Theta=N\lambda\,, (1)

where Ξ»πœ†\lambda is the wavelength, dmsubscriptπ‘‘π‘šd_{m} is the distance that M1subscriptM1\mathrm{M}_{1} moves toward the beam-splitter,111Hence the subscript mπ‘šm. and N𝑁N is the number of the counted fringes.

Refer to caption
Figure 2: Fringe pattern as seen on viewing screen.

In our case ΘΘ\Theta is 90°(as seen in Figure 1); therefore,

Ξ»=2​dmN.πœ†2subscriptπ‘‘π‘šπ‘\displaystyle\lambda=\dfrac{2d_{m}}{N}\,. (2)

So after measuring dmsubscriptπ‘‘π‘šd_{m} and N𝑁N we can calculated Ξ»πœ†\lambda.

After measuring Ξ»πœ†\lambda we move on to find the refractive indices of air and glass, and start with that of air, nasubscriptπ‘›π‘Žn_{a}. To understand how to measure this, it is crucial to know that for EM waves:

Ξ»=Ξ»0n,πœ†subscriptπœ†0𝑛\displaystyle\lambda=\dfrac{\lambda_{0}}{n}\,, (3)

where Ξ»0subscriptπœ†0\lambda_{0} is the wavelength of the EM wave in vacuum and n𝑛n is the index of refraction of the media it is traveling through [1]. Knowing (3), we attempt to find nasubscriptπ‘›π‘Žn_{a} by constructing an alternative media in the midst of our Michelson interferometer. We do this by placing a vacuum cell between the beam-splitter and M1. It is also critical to know that for low pressure gasses the index of refraction varies linearly with pressure [2]. Combining this knowledge with (2) we can calculate nasubscriptπ‘›π‘Žn_{a} after measuring the manual change in cell pressure Δ​PΔ𝑃\Delta P and observing its affect on the fringe pattern.

Furthermore, since glass is rigid we must use an alternative method to measure its index of refraction ngsubscript𝑛𝑔n_{g}. So we use the method of varying the length of the crown glass222We place a glass plate in the same location that the vacuum cell was previously placed. More on this in section 2.3. which our laser passes through by revolving it using a rotating table and movable arm. The change in path length and measured N𝑁N relate to ngsubscript𝑛𝑔n_{g} by the following equation:

N=2​na​da​(ΞΈ)+2​ng​dg​(ΞΈ)Ξ»0,𝑁2subscriptπ‘›π‘Žsubscriptπ‘‘π‘Žπœƒ2subscript𝑛𝑔subscriptπ‘‘π‘”πœƒsubscriptπœ†0\displaystyle N=\dfrac{2n_{a}d_{a}(\theta)+2n_{g}d_{g}(\theta)}{\lambda_{0}}\,, (4)

where da​(ΞΈ)subscriptπ‘‘π‘Žπœƒd_{a}(\theta) and dg​(ΞΈ)subscriptπ‘‘π‘”πœƒd_{g}(\theta) are the changes of path length in air and glass respectively [3]. Since they are functions of the angle ΞΈπœƒ\theta which the glass rotates, we can find ngsubscript𝑛𝑔n_{g} if we measure ΞΈπœƒ\theta and N𝑁N.

2 Methods

To conduct our experiments we used the PASCO scientific 012-05187C Precision Interferometer which included a non-polarized yet standard HeNe laser with a wavelength of Ξ»0=623.8subscriptπœ†0623.8\lambda_{0}=623.8 nm [4].333We re-measure the laser’s wavelength, of course.

2.1 Distance Measurement

The procedure of measuring the beam wavelength starts after we set our interferometer in the Michelson mode and align the laser. Behind M2 there is a micrometer which actually moves M1subscriptM1\mathrm{M}_{1} back and forth; by setting it to 50 microns M1 and the micrometer reading have a virtually linear relationship. We then adjust the viewing screen such that our chosen reference fringe is centered on it. Now by increasing the micrometer reading we see a shift in the fringe pattern; so we record the number of fringes which pass our reference mark as well as the distance moved by the micrometer, which is,

dm=|final​positionβˆ’initial​position|.subscriptπ‘‘π‘šfinalpositioninitialpositiond_{m}=\left|\mathrm{final~{}position-initial~{}position}\right|\,.

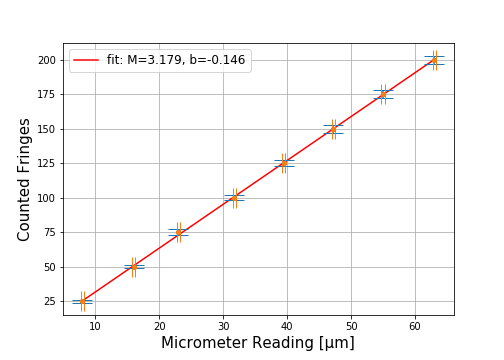
A figure of our measurements is plotted below.
Refer to caption
Figure 3: Measured N​vs​dm𝑁vssubscriptπ‘‘π‘šN~{}\text{vs}~{}d_{m}. Vertical error bars correspond to the uncertainty in N𝑁N, horizontal bars correspond to the uncertainty in dmsubscriptπ‘‘π‘šd_{m}. Using the SciPy package in Python, a fitted line Mβ‹…dm+b⋅𝑀subscriptπ‘‘π‘šπ‘M\cdot d_{m}+b is included. The variance of the parameters are found by taking the square root of the SciPy variance function pcov[]; δ​M=0.019𝛿𝑀0.019\delta M=0.019 and δ​b=0.755𝛿𝑏0.755\delta b=0.755. If the relationship between M1 and the dmsubscriptπ‘‘π‘šd_{m} was not linear, the fit might not have been a regression line.

The uncertainty in all micrometer measurements δ​dm𝛿subscriptπ‘‘π‘š\delta d_{m} is 0.250.250.25 microns, as the dial spacings are very tiny. The uncertainty for N𝑁N varies by the number of fringes we counted, since the more you count the easier it can be to lose track of the rings in Figure 2.

Table 1: Uncertainties for N𝑁N Depending on the Observed Rings
N𝑁N δ​N𝛿𝑁\delta N
1≀N≀501𝑁501\leq N\leq 50 1
50<N<15050𝑁15050<N<150 2
150≀N≀200150𝑁200150\leq N\leq 200 3

2.2 Vacuum Cell Pressure Change

We now place a vacuum cell before M1 as explained in the introduction. We measure the width of our cell to be d=2.95Β±0.01𝑑plus-or-minus2.950.01d=2.95\pm 0.01 cm.444According to the manufacturer PASCO it should be 333 cm, this is incorrect! The uncertainty comes from the fact that it is difficult to measure centimeters up to two decimal places with full accuracy.

Refer to caption
Figure 4: Image of our vacuum cell. The part number is 003-05162 from PASCO. The thickness d𝑑d is measured from both the part with the larger area and the one with the lower.

It is important to know d𝑑d because changing the travel length of our EM wave in an alternative media has the same effect as dmsubscriptπ‘‘π‘šd_{m} in (2). Moreover, after decreasing the pressure in the cell with a vacuum pump555The OS-8502 Hand-Held Vacuum Pump, to be exact. we record the change in pressure666The reading on the pump is Δ​PΔ𝑃\Delta P. Δ​PΔ𝑃\Delta P as well as the number of fringes that pass through our reference point.
Refer to caption
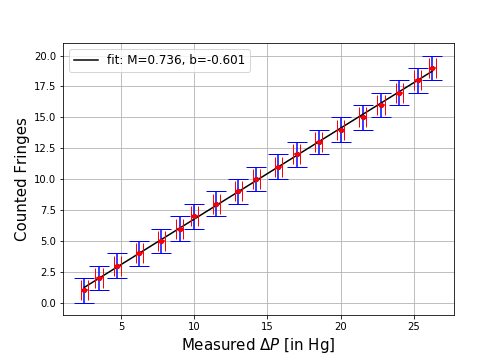
Figure 5: Measured N​vs​Δ​P𝑁vsΔ𝑃N~{}\text{vs}~{}\Delta P, counted fringes increase linearly with pressure. As displayed, pressure was measured in units of in Hg; but, it was converted to Pascals for analysis. Based on the measured units a curve M⋅Δ​P+b⋅𝑀Δ𝑃𝑏M\cdot\Delta P+b is fitted with the parameters given in the legend. The square root of their variances are δ​M=0.004𝛿𝑀0.004\delta M=0.004 and δ​b=0.071𝛿𝑏0.071\delta b=0.071.

The uncertainty in Δ​PΔ𝑃\Delta P comes from the vacuum pump reading and is a constant 0.25​in​Hg0.25inHg0.25~{}\mathrm{in~{}Hg}. There were no fluctuations in the reading as the device was calibrated shortly before we used it; hence the small error. See Table 1 for the error in N𝑁N.

2.3 Angle Quantification

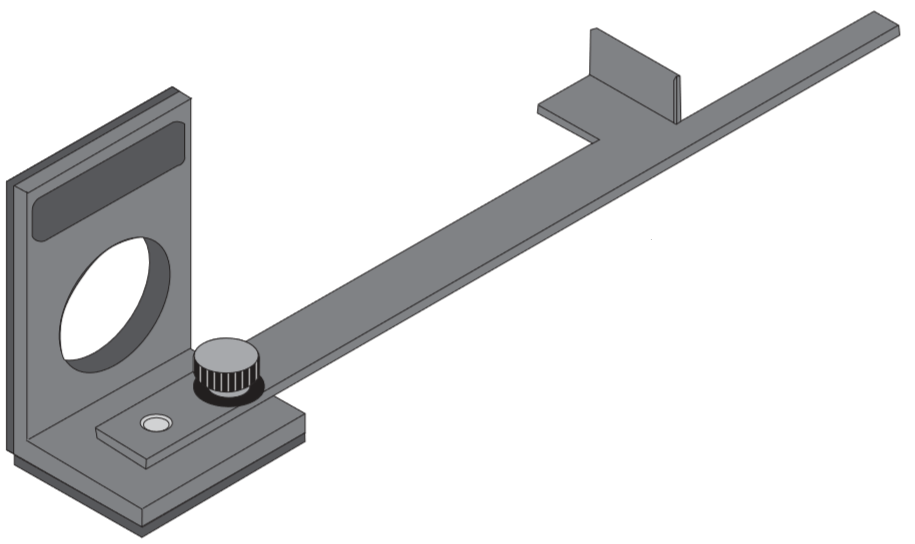
Replacing the vacuum cell with a crown glass plate sitting on a rotating table, we have the tools necessary to get the measurements for the refractive index of glass.
Refer to caption
Figure 6: The Rotating Table consists of a component holder to place the glass plate on and an arm to manually rotate it.
Refer to caption
Figure 7: The vernier scaleβ€”which is positioned to the right of M2 in Figure 1β€” is what we use to measure the angle which the arm has rotated the table. The alignment was set at βˆ’0.40​°±0.05plus-or-minus0.40Β°0.05-0.40\degree\pm 0.05, so we add the positive value of that to all our angle measurements.

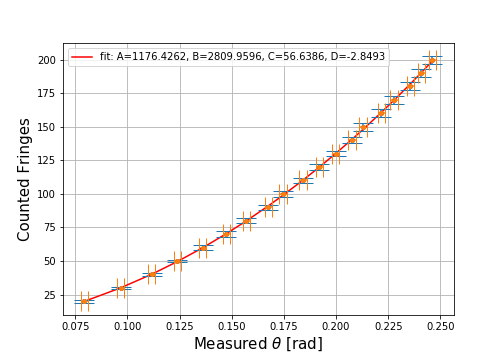
While we rotated the arm we observe the viewing screen. Starting at 20, we read the Vernier scale every time 10 fringes pass our reference mark. Our measurements are plotted in Figure 8.
Refer to caption
Figure 8: Measured N​vs​θ𝑁vsπœƒN~{}\text{vs}~{}\theta, where 0.4​°0.4Β°0.4\degree have been added to ΞΈπœƒ\theta as mentioned in Figure 6. The angle has also been converted to radians. A curve A​θ3+B​θ2+C​θ+D𝐴superscriptπœƒ3𝐡superscriptπœƒ2πΆπœƒπ·A\theta^{3}+B\theta^{2}+C\theta+D has been fitted to the data. The uncertainty in the parameters are δ​A=2097.06,δ​B=1042.25,δ​C=164.523,formulae-sequence𝛿𝐴2097.06formulae-sequence𝛿𝐡1042.25𝛿𝐢164.523\delta A=2097.06,~{}\delta B=1042.25,~{}\delta C=164.523, and δ​D=8.169𝛿𝐷8.169\delta D=8.169.

The error for the measured angle is 0.05​°0.05Β°0.05\degree as the Vernier scale is very small (after getting nearly identical results from a few trials we did manage to decrease the uncertainty). We also must take in consideration another 0.05​°0.05Β°0.05\degree for the alignment offset uncertainty (as mentioned in Figure 6), in total that sums up to 0.1​°0.1Β°0.1\degree. For δ​N𝛿𝑁\delta N see Table 1, as usual.

3 Results

3.1 HeNe Laser Wavelength

After gathering the measurements, we can calculate the uncertainty Ξ΄β€‹Ξ»π›Ώπœ†\delta\lambda of (2) from the propagation of error formula [5]:

Ξ΄β€‹Ξ»π›Ώπœ†\displaystyle\delta\lambda =(βˆ‚Ξ»βˆ‚N​δ​N)2+(βˆ‚Ξ»βˆ‚dm​δ​dm)2absentsuperscriptπœ†π‘π›Ώπ‘2superscriptπœ†subscriptπ‘‘π‘šπ›Ώsubscriptπ‘‘π‘š2\displaystyle=\sqrt{\left(\frac{\partial\lambda}{\partial N}\delta N\right)^{2}+\left(\frac{\partial\lambda}{\partial d_{m}}\delta d_{m}\right)^{2}}
=4​dm2N4​δ​N2+4N2​δ​dm2.absent4superscriptsubscriptπ‘‘π‘š2superscript𝑁4𝛿superscript𝑁24superscript𝑁2𝛿superscriptsubscriptπ‘‘π‘š2\displaystyle=\sqrt{\frac{4{d_{m}}^{2}}{N^{4}}{\delta N}^{2}+\frac{4}{N^{2}}{\delta d_{m}}^{2}}\,. (5)

Since we have multiple measurements, we plot our data against the measured fringes N𝑁N.

Refer to caption
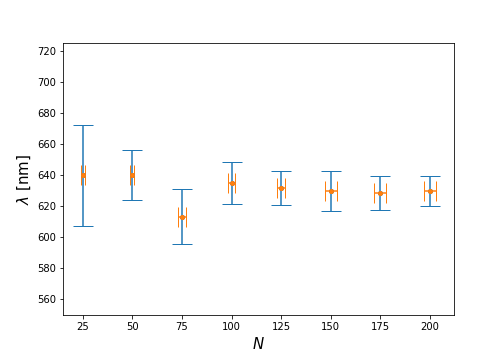
Figure 9: Calculated λ​vsΒ measured​Nπœ†vsΒ measured𝑁\lambda~{}\text{vs~{}measured}~{}N. As the fringe count increases, Ξ»πœ†\lambda practically converges to Ξ»0subscriptπœ†0\lambda_{0} while its uncertainty decreases. Had a fit been included, it would have been a line with an almost zero slope and vertical axis intercept close to Ξ»0subscriptπœ†0\lambda_{0}. Not included as it made each individual point hard to see.

To get a final result from the wavelength of the laser beam, we take the weighted average Ξ»Β―Β―πœ†\overline{\lambda} of the individual wavelengths Ξ»isubscriptπœ†π‘–\lambda_{i} in Figure 8;

λ¯=βˆ‘Ξ»i​wiβˆ‘wi,Β―πœ†subscriptπœ†π‘–subscript𝑀𝑖subscript𝑀𝑖\displaystyle\overline{\lambda}=\dfrac{\sum\lambda_{i}w_{i}}{\sum w_{i}}\,, (6)

where the weight wisubscript𝑀𝑖w_{i} is,

wi=1(δ​λi)2.subscript𝑀𝑖1superscript𝛿subscriptπœ†π‘–2\displaystyle w_{i}=\frac{1}{\left(\delta\lambda_{i}\right)^{2}}\,. (7)

It follows that λ¯=630.6​nmΒ―πœ†630.6nm\overline{\lambda}=630.6~{}\mathrm{nm}. The predicted average error based on the weight is,

δ​λ¯=1βˆ‘wi,π›ΏΒ―πœ†1subscript𝑀𝑖\displaystyle\delta\overline{\lambda}=\frac{1}{\sqrt{\sum w_{i}}}\,, (8)

which comes out to 4.7 nm. However, the actual empirical spread of the calculated errors based off the measured data is:

σλ=1kβ€‹βˆ‘i=1k(Ξ»iβˆ’Ξ»Β―)2,subscriptπœŽπœ†1π‘˜superscriptsubscript𝑖1π‘˜superscriptsubscriptπœ†π‘–Β―πœ†2\displaystyle\sigma_{\lambda}=\sqrt{\frac{1}{k}\sum_{i=1}^{k}\left(\lambda_{i}-\overline{\lambda}\right)^{2}}\,, (9)

where kπ‘˜k is the number of measurements [6]. And the final wavelength is, λ¯±σλplus-or-minusΒ―πœ†subscriptπœŽπœ†\overline{\lambda}\pm\sigma_{\lambda}, so Ξ»=630.6Β±7.9​nmπœ†plus-or-minus630.67.9nm\lambda=630.6\pm 7.9~{}\mathrm{nm}.

3.2 Air’s Index of Refraction

From (2),

N=Δ​N=2​d​(1Ξ»Ξ±βˆ’1λβ),𝑁Δ𝑁2𝑑1subscriptπœ†π›Ό1subscriptπœ†π›½\displaystyle N=\Delta N=2d\left(\frac{1}{\lambda_{\alpha}}-\frac{1}{\lambda_{\beta}}\right)\,, (10)

where the α𝛼\alpha and β𝛽\beta subscripts correspond to any two individual wavelengths. Then from (3),

N=2​dΞ»0​(nΞ±βˆ’nΞ²)⟹nΞ±βˆ’nΞ²=N​λ02​d.𝑁2𝑑subscriptπœ†0subscript𝑛𝛼subscript𝑛𝛽subscript𝑛𝛼subscript𝑛𝛽𝑁subscriptπœ†02𝑑\displaystyle N=\frac{2d}{\lambda_{0}}\left(n_{\alpha}-n_{\beta}\right)\implies n_{\alpha}-n_{\beta}=\frac{N\lambda_{0}}{2d}\,. (11)

As mentioned in the introduction, n𝑛n varies linearly with P𝑃P, so from the slope m=Δ​na/Δ​Pπ‘šΞ”subscriptπ‘›π‘ŽΞ”π‘ƒm=\Delta n_{a}/\Delta P and (11),

m=N​λ02​d​δ​P.π‘šπ‘subscriptπœ†02𝑑𝛿𝑃\displaystyle m=\frac{N\lambda_{0}}{2d\delta P}\,. (12)

Then,

na​(P)=mβ‹…P+n0,subscriptπ‘›π‘Žπ‘ƒβ‹…π‘šπ‘ƒsubscript𝑛0\displaystyle n_{a}(P)=m\cdot P+n_{0}\,, (13)

where n0=1subscript𝑛01n_{0}=1 is the vacuum refractive index. It follows from this that

δ​na=δ​mβ‹…P,𝛿subscriptπ‘›π‘Žβ‹…π›Ώπ‘šπ‘ƒ\displaystyle\delta n_{a}=\delta m\cdot P\,, (14)

where δ​mπ›Ώπ‘š\delta m is found from the propagation of uncertainty formula;

δ​mπ›Ώπ‘š\displaystyle\delta m =\displaystyle=
Ξ»02​d​δ​P​(δ​n)2+(δ​dd)2+(N​δ​Δ​PΔ​P)2.subscriptπœ†02𝑑𝛿𝑃superscript𝛿𝑛2superscript𝛿𝑑𝑑2superscript𝑁𝛿Δ𝑃Δ𝑃2\displaystyle\frac{\lambda_{0}}{2d\delta P}\sqrt{\left(\delta n\right)^{2}+\left(\dfrac{\delta d}{d}\right)^{2}+\left(\dfrac{N\delta\Delta P}{\Delta P}\right)^{2}}\,. (15)

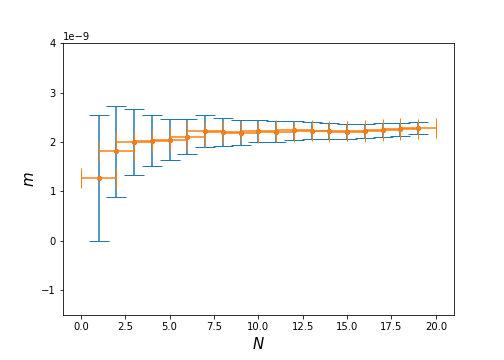
We plot each individual misubscriptπ‘šπ‘–m_{i} and their uncertainties δ​mi𝛿subscriptπ‘šπ‘–\delta m_{i} in Figure 10.

Refer to caption
Figure 10: Calculated mπ‘šm vs measured N𝑁N. With every measurement the error in the slope decreases. It also appears to converge to a value near 2.2 nPa-1. To find each individual naisubscriptsubscriptπ‘›π‘Žπ‘–{n_{a}}_{i}, we must use each individual misubscriptπ‘šπ‘–m_{i} and δ​mi𝛿subscriptπ‘šπ‘–\delta m_{i} in (14).

Similar to the previous section, we have random uncertainties, so we need to do a statistical analysis. Replacing Ξ»πœ†\lambda with mπ‘šm in equations (6) to (9)777The reason the equations have not explicitly been written out is to save space as well as clear redundancy. This is also the case for the next section. we obtain the values in the following table.

Table 2: Obtained Averages for Slope [nPa-1]
mΒ―Β―π‘š\overline{m} δ​mπ›Ώπ‘š\delta{m} ΟƒmsubscriptπœŽπ‘š\sigma_{m}
2.228 0.046 0.256

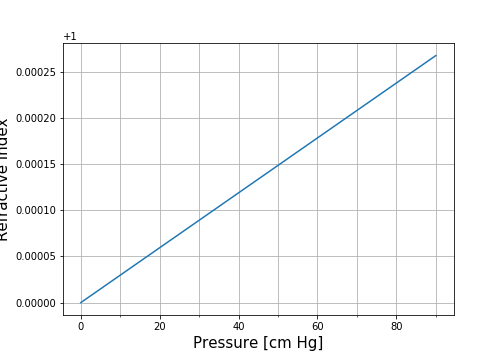
Using the average slope mΒ―Β―π‘š\overline{m} in Table 2 along with (13) we make a graph of the index of refraction of air against pressure.
Refer to caption
Figure 11: Calculated nΒ―asubscriptΒ―π‘›π‘Ž\overline{n}_{a} vs P𝑃P. A range of 1000 pressures between 0 and 90 [cm Hg] was fed into (13) to create this graph.

Extrapolating Figure 11 we find the refractive index of air to be 1.000226. From (14) and Table 2, δ​na𝛿subscriptπ‘›π‘Ž\delta n_{a} is 5Γ—10βˆ’65superscript1065\times 10^{-6}. And,

Οƒa=Οƒmβ‹…Pa​t​m,subscriptπœŽπ‘Žβ‹…subscriptπœŽπ‘šsubscriptπ‘ƒπ‘Žπ‘‘π‘š\displaystyle{\sigma_{a}}=\sigma_{m}\cdot P_{atm}\,, (16)

where ΟƒasubscriptπœŽπ‘Ž\sigma_{a} is the empirical spread for nasubscriptπ‘›π‘Žn_{a} and Pa​t​m=101325subscriptπ‘ƒπ‘Žπ‘‘π‘š101325P_{atm}=101325 Pa is the atmospheric pressure. So if,

na=nΒ―aΒ±Οƒa,subscriptπ‘›π‘Žplus-or-minussubscriptΒ―π‘›π‘ŽsubscriptπœŽπ‘Žn_{a}=\overline{n}_{a}\pm\sigma_{a}\,,

then na=1.000226Β±0.000026subscriptπ‘›π‘Žplus-or-minus1.0002260.000026n_{a}=1.000226\pm 0.000026.

3.3 Glass’s Index of Refraction

Based on our measurements as well as the curve in Figure 8 we suspect that it will be difficult to find the change in path length. So we rely on the work done by Andrews, 1960 to analyze the content of (4) and write an equation for ngsubscript𝑛𝑔n_{g} solely as a function of ΞΈπœƒ\theta and N𝑁N;

ng=(2​tβˆ’N​λ0)​(1βˆ’cos⁑θ)+((N​λ0)2/(4​t))2​t​(1βˆ’cos⁑θ)βˆ’N​λ0,subscript𝑛𝑔2𝑑𝑁subscriptπœ†01πœƒsuperscript𝑁subscriptπœ†024𝑑2𝑑1πœƒπ‘subscriptπœ†0\displaystyle n_{g}=\dfrac{\left(2t-N\lambda_{0}\right)(1-\cos\theta)+\left(\left(N\lambda_{0}\right)^{2}/\left(4t\right)\right)}{2t\left(1-\cos\theta\right)-N\lambda_{0}}\,, (17)

where t𝑑t is the thickness of the glass plate. For this we use the manufacturer value t=6Β±0.5𝑑plus-or-minus60.5t=6\pm 0.5 mm [8].888The exact part number for the glass plate is 003-04034. Since the manufacturer value is very precise the uncertainty is set to 5 in the next [unreported] significant figure.

Anyway, Since the second term in the numerator is negligible,

ng=(2​tβˆ’N​λ0)​(1βˆ’cos⁑θ)2​t​(1βˆ’cos⁑θ)βˆ’N​λ0.subscript𝑛𝑔2𝑑𝑁subscriptπœ†01πœƒ2𝑑1πœƒπ‘subscriptπœ†0\displaystyle n_{g}=\dfrac{\left(2t-N\lambda_{0}\right)(1-\cos\theta)}{2t\left(1-\cos\theta\right)-N\lambda_{0}}\,. (18)

Then from the propagation of error formula,

δ​ng=𝛿subscript𝑛𝑔absent\displaystyle\delta n_{g}=\hskip 199.16928pt
Ξ»0΢​(2​t​η​cos⁑θ​δ​N)2+(2​N​η​cos⁑θ​δ​t)2+(N​ξ​sin⁑θ​δ​θ)2,subscriptπœ†0𝜁superscript2π‘‘πœ‚πœƒπ›Ώπ‘2superscript2π‘πœ‚πœƒπ›Ώπ‘‘2superscriptπ‘πœ‰πœƒπ›Ώπœƒ2\displaystyle\frac{\lambda_{0}}{\zeta}\sqrt{\left(2t\eta\cos\theta\delta N\right)^{2}+\left(2N\eta\cos\theta\delta t\right)^{2}+\left(N\xi\sin\theta\delta\theta\right)^{2}}, (19)

where ΞΎπœ‰\xi, ΢𝜁\zeta, and Ξ·πœ‚\eta are parameterized below to avoid clutterness in (19);

{ΞΎ=N​λ0βˆ’2​tΞΆ=(Ξ»0​N+2​t​cosβ‘ΞΈβˆ’2​t)2Ξ·=cosβ‘ΞΈβˆ’1.casesπœ‰π‘subscriptπœ†02𝑑otherwise𝜁superscriptsubscriptπœ†0𝑁2π‘‘πœƒ2𝑑2otherwiseπœ‚πœƒ1otherwise\begin{cases}\xi=N\lambda_{0}-2t\\ \zeta=\left(\lambda_{0}N+2t\cos\theta-2t\right)^{2}\\ \eta=\cos\theta-1\,.\end{cases}

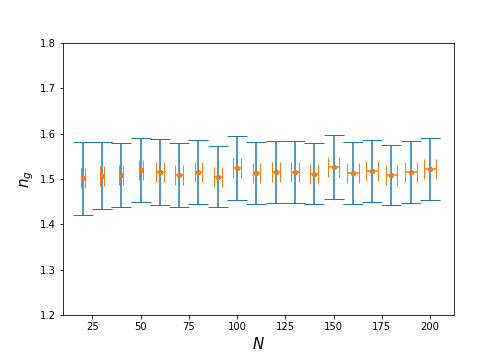
Plotting each ngisubscriptsubscript𝑛𝑔𝑖{n_{g}}_{i} with its error allows us to further analyze our data.
Refer to caption
Figure 12: Calculated ngsubscript𝑛𝑔n_{g} vs measured N𝑁N. Throughout the measurements the refractive index of glass appears to be consistently close to 1.5, no matter what the fringe count.

Once again we must do a weighted analysis, so this time we replace Ξ»πœ†\lambda with ngsubscript𝑛𝑔n_{g} in equations (6) to (9).

Table 3: Obtained Averages for ngsubscript𝑛𝑔n_{g}
nΒ―gsubscript¯𝑛𝑔\overline{n}_{g} δ​ng𝛿subscript𝑛𝑔\delta{n_{g}} ΟƒgsubscriptπœŽπ‘”\sigma_{g}
1.514 0.016 0.006

Our final index of refraction is nΒ―gΒ±Οƒgplus-or-minussubscript¯𝑛𝑔subscriptπœŽπ‘”\overline{n}_{g}\pm\sigma_{g}; so ng=1.514Β±0.006subscript𝑛𝑔plus-or-minus1.5140.006n_{g}=1.514\pm 0.006.

4 Discussion

In the results of all three experiments we deduced both the calculated uncertainties of the weighted averages and the standard deviations of the measured errors relative to the weighted means. The former is an analytical prediction for the latter, and the latter is the verifiable error which we are mainly concerned with. Therefore, to evaluate the accuracy of our results, we use the following expression:

|Ξacceptedβˆ’Ξžmeasured|Οƒ=std​away​fromβ€‹Ξžaccepted.subscriptΞacceptedsubscriptΞmeasured𝜎stdawayfromsubscriptΞaccepted\displaystyle\frac{\left|\Xi_{\mathrm{accepted}}-\Xi_{\mathrm{measured}}\right|}{\sigma}=\mathrm{std~{}away~{}from~{}\Xi_{\mathrm{accepted}}}. (20)

For the wavelength of the HeNe laser, our measured average result was Ξ»=630.6Β±7.9​nmπœ†plus-or-minus630.67.9nm\lambda=630.6\pm 7.9~{}\mathrm{nm}. 0.280.280.28 standard deviations away from Ξ»0=632.8subscriptπœ†0632.8\lambda_{0}=632.8 nm, agreeing with it. If we were to replace σλsubscriptπœŽπœ†\sigma_{\lambda} with δ​λ¯=4.7​nmπ›ΏΒ―πœ†4.7nm\delta\overline{\lambda}=4.7~{}\mathrm{nm}, we would get 0.480.480.48 standard deviations101010If you were to plug in these exact values in (20) you would get 0.4681 standard deviations. That is because our result have much more significant figures than reported here. This applies for all of our results (Ξ»,na,ng)\lambda,~{}n_{a},~{}n_{g}). away from the accepted value; also agreeing and implying that our errors were accurately estimated relative to our measurements.

Our result of na=1.000226Β±0.000026subscriptπ‘›π‘Žplus-or-minus1.0002260.000026n_{a}=1.000226\pm 0.000026 is 1.44 standard deviations away from PASCO’s measured 1.000263,111111Since we are using PASCO’s equipment, we will be comparing our result to their value as apposed to the accepted 1.000277 for 632.8 nm wavelengths. hardly agreeing [4]. When in (20) we replace ΟƒasubscriptπœŽπ‘Ž\sigma_{a} with the predicted uncertainty δ​nΒ―a=5​eβˆ’6𝛿subscriptΒ―π‘›π‘Ž5𝑒6\delta\overline{n}_{a}=5e-6, the standard deviation becomes 8.06, way off and not agreeing with PASCO’s value. So even though our result with its original error agrees with the manufacturer, we highly underestimated our uncertainties.

What is more is that for the refractive index of crown glass we obtained ng=1.514Β±0.006subscript𝑛𝑔plus-or-minus1.5140.006n_{g}=1.514\pm 0.006, 0.125 standard deviations away from the accepted value of 1.515121212This value is explicitly for crown glass at 632.8 nm wavelengths. [9]. If we instead use our calculated error based on our weighted average, δ​nΒ―g=0.016𝛿subscript¯𝑛𝑔0.016\delta\overline{n}_{g}=0.016, our result would be 0.05 standard deviations away from the accepted value. Thoroughly agreeing with it.

Had we taken more measurements in the procedures for finding Ξ»πœ†\lambda and ngsubscript𝑛𝑔n_{g} we may have obtained even smaller standard deviations, as the plotted points in Figures 9 and 10 would have converged closer to their respective accepted values. For the procedure of finding nasubscriptπ‘›π‘Žn_{a}: since in (15) Δ​PΔ𝑃\Delta P and d𝑑d have been squared in the denominator relative to their respective uncertainties, the error that we underestimated was δ​N𝛿𝑁\delta N. Redoing the experiment and being more careful with our observation of the rings of Figure 2 we can get a better predicted uncertainty δ​nΒ―a𝛿subscriptΒ―π‘›π‘Ž\delta\overline{n}_{a} and hence a much better predicted standard deviation. That being said, all of our measurements and actual errors found from interferometery were successful and agreed with the accepted values.

References

  • [1] Wavelength, General Media, en.wikipedia.org/wiki/Wavelength, Wikipedia.
  • [2] Kapoor & Brown, Proceedings of the Third Symposium on Silicon Nitride and Silicon Dioxide Thin Insulating Films, The Electrochemical Society, Inc, 1994.
  • [3] Monk, Light Principles and Measurements, McGraw-Hill, 1937.
  • [4] PASCO, Precision Interferometer
  • [5] Taylor J., An Introduction to Error Analysis, 2nd edition, University Science Books, 1997.
  • [6] Standard Deviation and Variance, mathsisfun.com/data/standard-deviation.html, Math is Fun.
  • [7] Andrews, C.L., Optics of the Electromagnetic Spectrum, Prentice-Hall, 1960.
  • [8] PASCO, Advanced Optics System, https://studylib.net/doc/8647418/advanced-optics-system, page 13.
  • [9] Filmetrics, Refractive Index of BK7, Float Glass, filmetrics.com/refractive-index-database/BK7/Float-Glass.