Monitoring of the radio galaxy M 87 during a low emission state from 2012 to 2015 with MAGIC
Abstract
M 87 is one of the closest (z=0.00436) extragalactic sources emitting at very-high-energies (VHE, GeV).
The aim of this work is to locate the region of the VHE gamma-ray emission and to
describe the observed broadband spectral energy distribution (SED) during the low VHE gamma-ray state.
The data from M 87 collected between 2012 and 2015 as part of a MAGIC monitoring programme are analysed and combined with multi-wavelength data from Fermi-LAT, Chandra, HST, EVN, VLBA and the Liverpool Telescope.
The averaged VHE gamma-ray spectrum can be fitted from 100 GeV to 10 TeV with a simple power law with a photon index of , while the integral flux above 300 GeV is . During the campaign between 2012 and 2015, M 87 is generally found in a low emission state at all observed wavelengths. The VHE gamma-ray flux from the present 2012-2015 M 87 campaign is consistent with a constant flux with some hint of variability () on a daily timescale in 2013.
The low-state gamma-ray emission likely originates from the same region as the flare-state emission. Given the broadband SED, both a leptonic synchrotron self Compton and a hybrid photo-hadronic model reproduce the available data well, even if the latter is preferred. We note, however, that the energy stored in the magnetic field in the leptonic scenario is very low suggesting a matter dominated emission region.
Keywords: galaxies: active - galaxies: individual: M 87 - galaxies: jets - gamma rays: galaxies - radiation mechanisms: non-thermal
1 Introduction
M 87††⋆ Corresponding authors (alphabetical ordered): C. Arcaro, P. Bangale, M. Manganaro, D. Mazin. contact.magic@mpp.mpg.de
⋆⋆: deceased is a large elliptical radio galaxy of Fanaroff-Riley type I (FR I; Fanaroff &
Riley, 1974), located in the Virgo Cluster, at a distance of Mpc (Bird et al., 2010).
M 87 is powered by a super-massive black hole (SMBH) with a mass assumed to be (Gebhardt
et al., 2011; Event Horizon Telescope Collaboration
et al., 2019b).
The relativistic jet of M 87 is misaligned with respect to our line of sight with an angle between 15-25∘ (Biretta et al., 1999; Acciari et al., 2009; Walker et al., 2018). The orientation and vicinity of M 87 allow the jet to be studied during its evolution, from the core to the extended lobe, where it slows down ending its path interacting with the intergalactic medium (Owen et al., 2000). The jet formation of M 87 has been recently studied by (Kim et al., 2018b) in the mm range at 86 GHz, revealing a parabolically expanding limb-brightened jet which emanates from a resolved VLBI core of Schwarzschild radii in size. In (Kim et al., 2018a) a strong indication was found that the jet base does not consist of a simple homogeneous plasma, but of inhomogeneous multi-energy components. The jet extends for (Marshall et al., 2002), and several knots along its length have been resolved in radio, optical and X-ray bands (Perlman et al., 2001; Wilson & Yang, 2002). The inner knot HST-1, located at from the core, has been in a flaring state since 2000 (Harris et al., 2003; Waters & Zepf, 2005; Harris et al., 2006), reaching the maximum flux in 2005 and had a secondary flaring in 2006-2007 (see Harris et al., 2009; Madrid, 2009; Abramowski et al., 2012).
The temporal correlation between the very-high-energies (VHE, E 100 GeV) gamma-ray emission and multi-wavelength (MWL) data, in which the source is spatially resolved, provides a unique opportunity to locate the origin of VHE gamma-ray emission in active galactic nuclei (AGNs). M87 was detected in TeV gamma rays first by the HEGRA (High-Energy-Gamma-Ray Astronomy) Collaboration in 1998 (Aharonian et al., 2003). The VERITAS (Very Energetic Radiation Imaging Telescope Array System) Collaboration reported a clear detection of M 87 in the 2007 campaign at energies above 250 GeV (Acciari et al., 2008) and continued to routinely monitor the source (Acciari et al., 2010). The first detection of gamma-ray emission from M 87 with MAGIC (Major Atmospheric Gamma-ray Imaging Cherenkov) occurred in 2005 in a low flux state, and results of those observations together with those performed between 2006 and 2007 were reported in Aleksić et al. (2012).
During a flare in 2008, detected through a monitoring campaign, MAGIC observed a flux variability on timescales as short as a day (Acciari et al., 2008; Albert et al., 2008). As of 2019, M 87 has been monitored for more than 10 years in the TeV band by MAGIC, H.E.S.S. (High Energy Stereoscopic System), and VERITAS (Acciari et al., 2009; Abramowski et al., 2012; Aliu et al., 2012; Beilicke & VERITAS Collaboration, 2012). According to the available VHE gamma-ray data, a total of three periods of high activity occurred in 2005, 2008 and 2010.
The modelling of VHE gamma-ray emission in the context of the broadband spectral energy distribution (SED) is challenging and draws the attention of several theory groups, see, e.g., Georganopoulos et al. (2005); Tavecchio & Ghisellini (2008); Ghisellini et al. (2005); Istomin & Sol (2009); Giannios et al. (2010).
The low state of M 87 is important for modelling as it can be used to describe a "baseline" state to be used as a reference, even if several model parameters remain unconstrained in the absence of flux variability. The study of the source in a high state can then be associated to the low-state reference improving the interpretation of the emission scenarios. Aleksić et al. (2012) previously modeled the low-state broadband SED using the same model applied to the high states observed in 2008. De Jong et al. (2015) and Prieto et al. (2016) also studied the M 87 activity in a MWL context. Prieto et al. (2016) singled out two different states of the source, a low and a more active one and studied them separately.
In this paper, the MAGIC monitoring dataset of M 87 between 2012 and 2015 is presented. No major flare is detected in this period, which allows us to study the source in low flux state. The data quality is sufficient to constrain some emission models and study the MWL SED of M 87 from radio to VHE gamma-ray frequencies, using MAGIC and available MWL data.
The paper is structured as follows: The observations and data analysis for the several instruments involved are presented in section 2. The results, consisting of the long-term light curves, skymaps and SEDs of the source in a MWL context are reported and described in detail in section 3. The SED modelling is discussed in section 4 and conclusions are summarized in section 5.
2 Observations & analysis
In the following, the data collected within this MWL campaign, ordered from the highest (gamma rays; MAGIC) to lowest energies (radio; VLBA –Very Long Baseline Array), are presented.
2.1 MAGIC
MAGIC is a stereoscopic system of two 17-m diameter imaging atmospheric Cherenkov telescopes situated at the Roque de los Muchachos, on the Canary island of La Palma. An integral sensitivity corresponding to % of the Crab Nebula flux above 220 GeV is achieved in 50 hrs at low zenith angles (see Aleksić et al., 2016, for details on the telescopes performance).
M 87 observations were performed regularly during the visibility period between December and July in the years 2012 to 2015. The observations took place at zenith angles ranging from during dark time and under moonlight conditions. Data were analysed using the standard MAGIC reconstruction software (MARS; Zanin et al., 2013). Further details on the stereo MAGIC analysis and on the telescopes performance under moonlight can be found in Aleksić et al. (2016) and Ahnen et al. (2017), respectively.
2.2 Fermi-LAT
The Large Area Telescope (LAT) on board the Fermi satellite is a pair-conversion telescope that covers the energy range from 20 MeV to more than 300 GeV, with an angular resolution of at 1 GeV and a field of view of 2.4 sr (Atwood et al., 2009). The unbinned likelihood analysis of the Fermi-LAT data was based on the publicly available Pass 8 photon dataset111http://fermi.gsfc.nasa.gov/cgi-bin/ssc/LAT/LATDataQuery.cgi. The data were analysed with the Fermi Science Tools package (version v10r0p5), using the Source (P8R2_SOURCE_V6) event class. The M 87 light curve was constructed for MeV with 30-days time bins. All events within of the region of interest centered at the catalog position of M 87 were selected. A dedicated likelihood analysis was performed on each time bin. All point sources from the Large Area Telescope source catalog (3FGL; Acero et al., 2015) that lied within a circle from M 87 were included in the model over each time interval. The resulting average flux was found to be . Fermi-LAT flux densities and the energy spectrum were found both to be consistent with the values reported in the 3FGL.
2.3 Chandra
The data reduction procedure of the X-ray dataset was performed following the Chandra Interactive Analysis of Observations (CIAO) threads222http://cxc.harvard.edu/ciao/guides/index.html, using CIAO version 4.7 and Chandra Calibration Database (CALDB) version 4.6.9. The X-ray images were ‘registered’ aligning the nuclear X-ray position to the location of the radio core (see for additional details Massaro et al. 2010, 2012; Massaro et al. 2013).
To measure observed fluxes for the nuclear emission as well as for any jet feature, a region of size and shape appropriate to the observed X-ray emission was chosen. The background contamination was estimated using two regions with the same shape and size as the science targets but offset from the jet (Massaro et al., 2015).
A 1 error was calculated based on the square root of the number of counts (the standard deviation of a Poissonian distribution) in the source and background regions. Fluxes reported here were also corrected for the Galactic absorption assuming a photon index of -2 and a value for the Galactic column density of cm (Kalberla et al., 2005).
2.4 HST
HST (Hubble Space Telescope) data presented here were obtained with the Space Telescope Imaging Spectrograph (STIS). These imaging data were obtained using the Near-Ultraviolet (NUV) Multi-Anode Microchannel Array (MAMA) detector of STIS, which has a pixel scale of 0 024 per pixel providing the best resolution currently available with HST (Maclay et al., 2019). The filter in use for these observations was the F25QTZ filter which is a long-pass quartz filter centered at 2360 with a FWHM of about 1000 . More details on the sensitivity and throughput of this filter are given in the STIS instrument handbook (Hernandez, 2014).
2.5 Liverpool Telescope
The optical polarization data were taken with the 2-m Liverpool Telescope (LT; Steele et al., 2004) located on the Canary island of La Palma. The 2012 observations were performed as a part of the Ringo2 blazar programme (Jermak et al., 2016) and 2014-2015 observations using the Ringo3 polarimeter (Arnold et al., 2012). Ringo2 observations were performed using a V+R hybrid filter.
The Ringo3 polarimeter consists of a rotating polaroid (1 rotation every 4 seconds) which captures 8 images of the source at successive 45∘ rotations of the polaroid. These 8 exposures could be combined according to the equations in Clarke & Neumayer (2002) to determine the degree and angle of polarization. Ringo3 data are separated into three wavelengths bands using dichroic mirrors rather than standard filters.
A gap between Ringo2 and Ringo3 data in the present work was due to the time needed for the upgrade of the polarimeter.
2.6 EVN
The European Very Long Baseline Interferometer (VLBI) Network (EVN333http://www.evlbi.org) is an interferometric array of radio telescopes spread throughout Europe (and beyond). It conducts unique high-resolution radio astronomical observations of cosmic radio sources.
Radio flux densities were taken with EVN during 2012-2015. M 87 was observed with EVN for a total of 10 epochs between 2012 January and 2015 May as a part of the long-term M 87/HST-1 monitoring project starting from mid-2009 (Giovannini et al., 2011; Giroletti et al., 2012; Hada et al., 2014, 2015). For all the observations, the data were recorded and correlated at the Joint Institute for VLBI in Europe (JIVE; see Giroletti et al. 2012; Hada et al. 2014 and Hada et al. 2015 for some more detailed information). The initial data calibration and fringe-fitting was performed in Astronomical Image Processing System (AIPS444http://www.aips.nrao.edu/index.shtml) based on the standard VLBI reduction procedures. The final images were produced in the DIFMAP software (Shepherd et al., 1994) after several cycles of phase and amplitude self-calibration. For the core, the peak flux densities were convolved with a 5/10-milliarcseconds (mas) as a circular Gaussian beam for 5-GHz/1.7-GHz data, respectively.
2.7 VERA
Between September 2011 and September 2012, the core of M 87 was densely monitored with the VLBI Exploration of Radio Astrometry (VERA), a Japanese VLBI network consisting of 4 stations operated at 22 and 43 GHz. A total of 24 epochs were obtained at 22 GHz throughout the period, and additional 5 sessions were performed at 43 GHz between February and May 2012. Detailed descriptions of the data analysis as well as some images were presented in Hada et al. (2014). In the present paper, an improved amplitude calibration procedure was applied to better take into account the amplitude loss due to multiple signal digitization processes during data recording (Iguchi et al., 2005). Peak flux densities of the M87 core (at 22 and 43 GHz) were provided, that were measured with a common 0.6-mas-diameter circular Gaussian convolving beam. An amplitude uncertainty of 10% for each dataset was assumed.
2.8 VLBA
During the period discussed in this paper, five high-resolution radio observations of M 87 were made at 43 GHz using the VLBA (Napier et al., 1994). Those observations were designed to monitor the ambient structure of M 87 in support of observations that would have been made in response to a flare in the gamma-ray energy band. No such flare occurred. A major upgrade to the VLBA digitization and recording hardware was occurring during this period555Dominici Science Operations Center 2014, VLBA Observational Status Summary 2015A (Socorro, NM:NRAO);https://science.lbo.us/facilities/vlba/docs/manuals/oss2015A which provided an improvement in sensitivity by a factor of two. Changes also occurred in the flux-density calibration methods and standards used (Walker, 2014). The data were processed in AIPS using standard methods. Additional details about the reduction of the VLBA data, along with the imaging and analysis results, could be found in Walker et al. (2018).
3 Results
In the following the results of this MWL campaign are presented, starting with the detection in the TeV band by MAGIC in Section 3.1, followed by the discussion on the MWL light curves in Section 3.2, and concluding with the characterization of the SED in the GeV-TeV band in Section 3.3.
3.1 Detection and sky maps with MAGIC
MAGIC has detected M 87 in every yearly campaign between 2012 and 2015. Table 1 lists the effective observation time and significance of the VHE gamma-ray signal. The significance of the detection is calculated according to Eq. 17 in Li & Ma (1983).
| Year | Teff [hrs] | Significance [] |
|---|---|---|
| 2012 | 38.75 | 5.41 |
| 2013 | 34.82 | 8.75 |
| 2014 | 49.88 | 7.29 |
| 2015 | 32.72 | 5.96 |
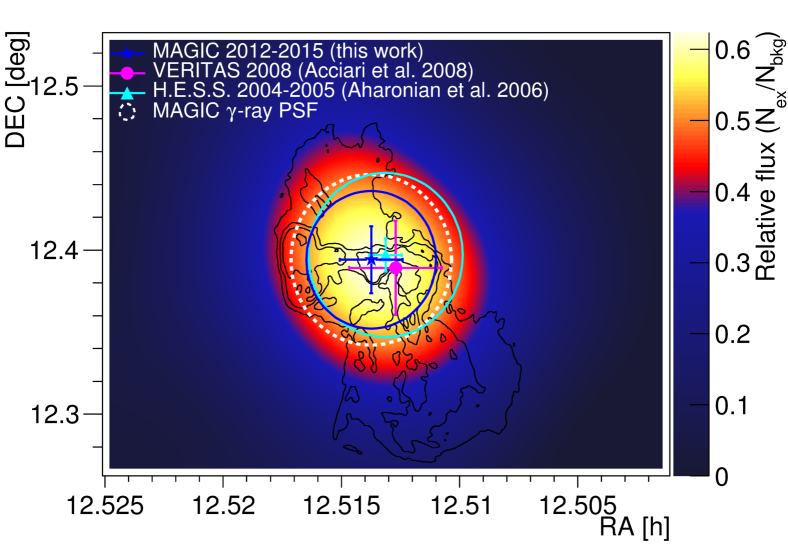
In Fig. 1 the contours of the radio image taken with VLA (Very Large Array) at 327 MHz (Owen et al., 2000) are superimposed on the VHE gamma-ray relative-flux sky map, showing the corresponding PSF of the MAGIC telescopes (0.052∘) and the upper limit at 99.9% confidence level of an extended VHE gamma-ray signal which is of the size of , corresponding to 11.5 kpc. An enhanced point-like gamma-ray signal is found at the position of the catalog position of M 87. The locations of the VHE gamma-ray emission observed by H.E.S.S. (Aharonian et al., 2006) and VERITAS (Acciari et al., 2008) are indicated in Fig. 1 as well.
| Year | [ cm-2 s-1] |
|---|---|
| 2012 | |
| 2013 | |
| 2014 | |
| 2015 | |
| 2012-2015 |
| Array | Year | [ cm-2 s-1] | [ TeV-1 cm-2 s-1] | |
|---|---|---|---|---|
| H.E.S.S. | 2004 | |||
| H.E.S.S. | 2005 | |||
| MAGIC | ||||
| VERITAS | 2007 | |||
| MAGIC | 2008 | |||
| VERITAS | 2010 | |||
| MAGIC |
| Waveband | Constant flux | /d.o.f. |
| probability | ||
| HE | 1.810-22 | 192/38 |
| X-rays (core) | 7.510-15 | 72.29/4 |
| X-rays (HST-1) | 6.510-10 | 48.87/4 |
| UV (core) | 0.11 | 7.64/4 |
| UV (HST-1) | 1.410-6 | 32.63/4 |
| Radio | ||
| VLBA∙ (1.2 mas) | 0.67 | 2.37/4 |
| VLBA▲ (Peak) | 0.44 | 3.73/4 |
| VLBA▼ (Down jet) | 0.88 | 1.22/4 |
| EVN□ (Core) | 0.40 | 5.15/5 |
| EVN∘ (Core) | 1.110-8 | 39.95/3 |
| EVN◆ (HST-1) | 1.510-13 | 69.27/5 |
| EVN△ (HST-1) | 0.12 | 5.85/5 |
| VERA■ (peak) | 1.9510-273 | 1360/23 |
| VERA⋆ (peak) | 5.9010-60 | 287.1/5 |
3.2 Multiwavelength light curves
The variability of the VHE gamma-ray flux is investigated at different timescales. The mean integral flux of each year, which is obtained by a fit with a constant is reported in Table 2. No variability is observed across the dataset, the only exception being a hint of variability on a daily scale observed in 2013 (the probability for a constant flux is 0.3%). For the other years the light curves are found to be compatible with a constant flux with a probability higher than 38%. Assuming an additional systematic uncertainty of 11% of the measured flux (Aleksić et al., 2016) for the 2013 data, a probability for a constant flux of 0.9% is obtained.
To compare the new data collected between 2012 and 2015 with previous M 87 observations, the integral flux is calculated for TeV and compared with previous MAGIC, H.E.S.S., and VERITAS observations (Aharonian et al., 2006; Acciari et al., 2008; Albert et al., 2008; Aleksić et al., 2012; Aliu et al., 2012); see Table 3. The integral flux level between 2012 and 2015 is compatible with those observed with H.E.S.S. in 2004 (Aharonian et al., 2006) and with MAGIC between 2005 and 2007 (Aleksić et al., 2012), when the source was in a low emission state in the TeV band, which can be defined as some 5–10% of the Crab Nebula flux at energies TeV. The low emission state is clearly separated from the flaring periods in 2005, 2008 and 2010 (Acciari et al., 2009; Abramowski et al., 2012; Beilicke & VERITAS Collaboration, 2012).
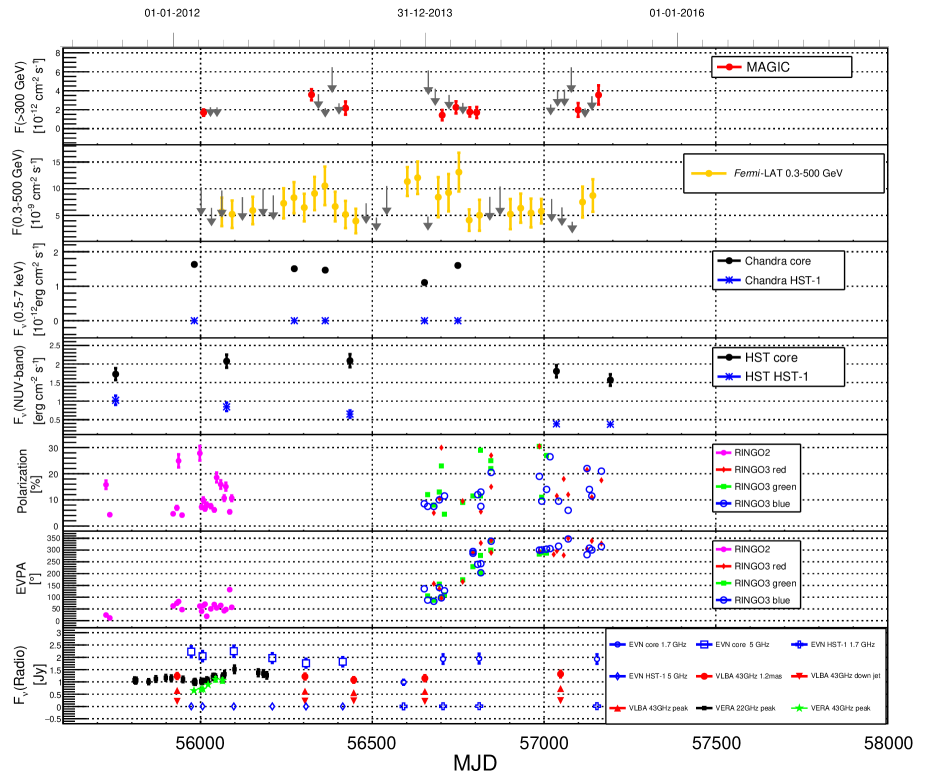
The MWL light curve of M 87 between 2012 and 2015 is shown in Fig. 2. Both the core and the innermost knot HST-1 in the jet are found to be in low emission state. Table 4 shows the constant flux probability and from HE to radio data. At lower frequencies, variability is observed for HST, Chandra, EVN 1.7 GHz core and 5 GHz HST-1 data, as well as VERA peak data at 22 and 44 GHz. No clear variability is found for the EVN 1.7 GHz HST-1 and 5 GHz core data, VLBA core and jet data, as well as for the high-energy (HE; 100 MeV E 100 GeV) gamma-ray data.
The optical polarimetry data suggest a long-term rotation of the electric vector polarization angle (EVPA) from 0∘ to 400∘, while the polarization stays in general at the rather low level of less than 5%, except some higher polarization of up to 25% around the beginning of the MAGIC observation period in 2012. Since the EVPA in blazars depends on the orientation of the shocks and the magnetic field threading it, EVPA provides an important tool to understand the acceleration mechanism of the shocked plasma. In recent studies, EVPA swings larger than 180∘ simultaneous to gamma-ray emission have been interpreted as additional evidence for an helical structure of the magnetic field (Marscher et al., 2010; Abdo et al., 2010; MAGIC Collaboration et al., 2018). However, in the present case, the EVPA rotation happens over several weeks (approximately from MJD 56704 to MJD 56824 – 16 February to 16 June 2014), making it difficult to find a connection to the activity in the other bands. EVPA rotations can be due to reconnection in the emission region of the jet during a high-activity state. However, no flare has been observed in the present datasample to be associated to a reconnection event.
3.3 SED in the TeV band
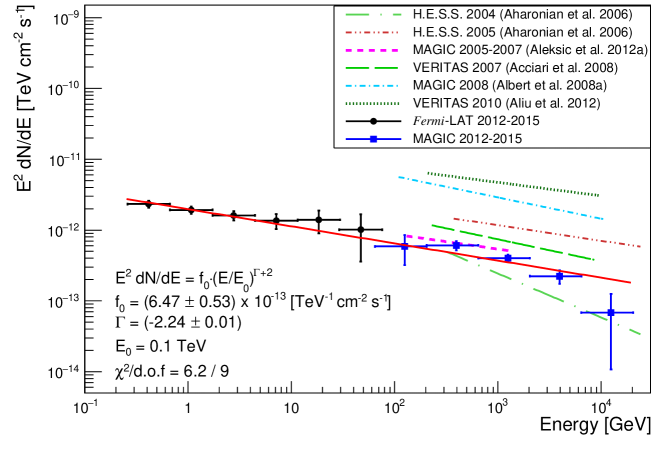
The VHE gamma-ray SED observed with MAGIC is well described666/d.o.f. = 3.87/3, corresponding to a fit probability of 28%. by a power law of the form , with the flux normalization being , at a decorrelation energy777The decorrelation energy corresponds to the energy at which the correlation between the flux normalization and spectral index is minimum. of 784 GeV and a spectral index equal to . The errors quoted here are only statistical. The observed spectrum is not significantly affected by the extragalactic background light (EBL) absorption due to the proximity of M 87; for this source, the production of electron-positron pairs by interaction with the EBL becomes significant at higher energies, above 10 TeV (Neronov & Aharonian, 2007). The spectral indices and differential fluxes at the decorrelation energy from previous VHE gamma-ray observations are reported in Table 3. All spectral indices observed both during high and low emission states are mostly compatible within the statistical errors. The differential flux between 2012 and 2015 is on a similar level as during the low emission states reported by MAGIC between 2005 and 2007, and by H.E.S.S. in 2004, whereas it is lower with respect to the flux level observed during the flaring states in 2005, 2008 and 2010.
The averaged VHE-HE gamma-ray SED between 2012 and 2015 is shown in Fig. 3. A simple power law (red line in Fig. 3) is fit to the combined VHE-HE gamma-ray SED, yielding a spectral index and a flux normalization of and , respectively, at normalization energy = 100 GeV. While Fermi-LAT data are collected throughout the four years, MAGIC data for reasons of visibility of the source are taken each year during the December-July time window.
4 SED modelling
In Tavecchio & Ghisellini (2008) a structured-jet model (Ghisellini et al., 2005) is applied, assuming a jet with a fast spine and a slower layer and thus two zones to explain the TeV flares. Aleksić et al. (2012) applies this scenario to model the low-state SED in 2005 to 2007. Lenain et al. (2008) propose that the flaring emission would occur while the jet is collimating, and Georganopoulos et al. (2005) while it is decelerating. An alternative process to explain these VHE gamma-ray flares was proposed by Giannios et al. (2010), which is based on misaligned mini-jets driven by magnetic reconnection moving within the jet at relativistic velocities. Istomin & Sol (2009) propose a two-step acceleration model to TeV energies involving initial particle acceleration within the accretion disk and then further centrifugal acceleration in the rotating magnetosphere. Levinson & Rieger (2011) discuss the variable TeV emission possibly to be produced in a starved magnetospheric region.
Despite the long-term investment in M 87 monitoring, the production site of TeV gamma rays remains unclear, with strong hints, however, that it will be close to the core of the jet (some from the black hole), suggested by the correlation with radio and X-ray activities (Acciari et al., 2008). HST-1 has also been discussed as a possible production site of the TeV emission because of a rapid TeV flare in 2006 (Harris et al., 2006) that coincides with an enhanced X-ray flux of this knot, while no enhanced flux from the nucleus is observed. However, the association with HST-1 seems unlikely given the absence of radio or X-ray short-timescale variabilities detected from this region, whereas several occasions of gamma-ray variability on daily timescales were seen. Another caveat to this interpretation is given by the fact that VLBA data have shown the compact knots in HST-1 to be essentially unresolved approaching the size limits set by the TeV-emission variability, as reported in Cheung et al. (2007).
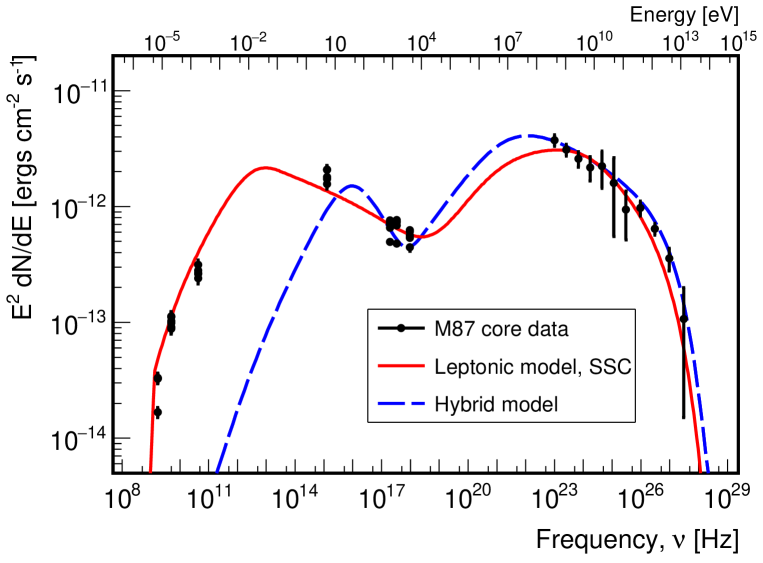
In this paper, the question whether a self-consistent modelling of a single emission region can explain the observed data in the low flux state and what consequences such scenario would have is investigated. Fig. 4 shows the MWL SED of the radio core of M 87. To build the SED, quasi-simultaneous data are used, taken between 2012 to 2015 from MAGIC, Fermi-LAT, Chandra, HST, EVN at 1.7 GHz and 5 GHz, and VLBA at 43 GHz. NUV data are corrected for interstellar extinction following Cardelli et al. (1989). No averaging is performed for the low-energy data from radio to X-ray, where variability has been observed.
As no clear variability in the TeV regime is detected, the model constraints are relaxed with respect to those for flaring states. The acceleration and emission zones are assumed to be directly connected representing the downstream region of a shock front. Additionally, the relevant parts in the quasi-simultaneous MWL data connected to the TeV gamma-ray emitting zone are assumed to be the HE gamma-ray data from Fermi-LAT and the X-ray data detected for the core region by Chandra. In general, radio emission tends to have a spatially-extended emission region, and can be subject to synchrotron self-absorption in the core region due to high magnetic field strength leading to high-opacity in this band. However, usually this absorption effect is more severe for hadronic models than it is for leptonic scenarios, where a less strong magnetic field is required. We therefore assume the radio emission observed by VLBA and EVN originate from a larger region. The NUV data from HST detected for the core of M 87 presumably have origin from a region much closer to the black hole and where the jet is launched, as suggested by General Relativistic Radiation Magnetohydrodynamics (see, e.g., Ryan et al., 2015). Therefore, we concentrate on the X-ray, GeV and TeV data rather than the radio-to-optical data for our modelling.
First, the leptonic model is applied to account for the broadband spectrum of M 87 with the numerical code in Asano et al. 2014, neglecting Fermi-II acceleration (see also, Asano & Hayashida, 2015, 2018). The code calculates the temporal evolution of the electron and photon energy distributions in the plasma rest frame along the jet (at radius from the black hole), which is similar to the BLAZAR code in Moderski et al. 2003 (for application examples see e.g., Kataoka et al., 2008; Hayashida et al., 2012). Here, a steady conical outflow is assumed, in which the temporal evolution along the jet is equivalent to the radial evolution. The conically expanding jet naturally leads to adiabatic cooling of electrons, which is a similar effect to the electron escape in one-zone steady models. In this 1-D code, the parameter for the electron escape is not required. The magnetic field decreases as . The macroscopic model parameters are the Lorentz factor , the initial radius (distance from the black hole), the initial magnetic field , the electron luminosity (including the counter jet), the jet opening angle , and the viewing angle . Here, , and half-opening angle of the jet are adopted (Biretta et al., 1999; Acciari et al., 2009; Walker et al., 2018), with the half-opening angle well below the average apparent full opening angle inferred from radio observations (Walker et al., 2018). Electrons are injected during the dynamical timescale in the plasma rest frame. In this timescale, the injection rate into a given volume is constant. The evolutions of the electron energy distribution and photon emission are calculated as far as , taking into account synchrotron emission and inverse Compton scattering with the Klein–Nishina effect, gamma-gamma absorption, secondary pair injection, synchrotron self-absorption, and adiabatic cooling. The model parameters for the electron injection spectrum are: the minimum and maximum electron Lorentz factors ( and ), the location of the break in the electron energy distribution (), and power-law indices and for below and above respectively. The parameter values are summarized in Table 5.
Second, a hybrid model is applied assuming that protons and electrons are accelerated in the jet. The fully time-dependent implementation is based on the geometry of Weidinger & Spanier (2010). The acceleration mechanism and the implementation of all leptonic processes are adopted from Richter & Spanier (2016) and the photo-hadronic framework is implemented following Hümmer et al. (2010). The acceleration of particles is closely modeled to the Fermi-I acceleration. Under the assumption that the particle distribution is quickly reaching isotropy in the downstream region of the shock, the model follows the evolution of the injected, monoenergetic particle distribution towards a power law. The shape of the particle distribution and the relevant timescales follow consistently from the input shock parameters.
| Leptonic | |||||||||||
|---|---|---|---|---|---|---|---|---|---|---|---|
| 3.2 | |||||||||||
| Hybrid | |||||||||||
| ] | |||||||||||
| size of the radiation zone | |
|---|---|
| size of the acceleration zone | |
| the energy injected | |
| magnetic field strength | |
| particle diffusion coefficient | |
| shock speed | |
| shock compression ratio | |
| Doppler factor |
The simulated SED, computed with the hybrid model that best describes the observed broadband SED, is shown in Fig. 4 (blue dashed line) together with the available quasi-simultaneous data. It is not clear whether a unique set of parameters exists for describing the SED and the high dimensionality of the parameter space does not allow for fitting. The community standard is therefore to optimize the SED modelling by manual parameter changes until data points and especially slopes are agreeing with the observed SED. In the hybrid model, the radio-to-X-ray radiations originate from synchrotron emission of electrons. The emission at higher energies, due to the high magnetic field and the assumption of protons being injected into the acceleration zone, are dominated by synchrotron emission of protons in this case. The parameters used for the presented fit are summarized in Table 5, and the most important parameters of the model are described in Table 6. The shock speed is set to and Fermi-II acceleration is neglected. The spatial diffusion coefficient is mass dependent, we will use as reference value and calculate the proton coefficient as . The escape time from each region is calculated as and the acceleration timescale follows, depending on the spectral index, from (for further reading see, e.g., Protheroe & Clay, 2004). It has to be noted that Chandra data are in the sensitive area of the transition between the two bumps ( Hz) in the hybrid model. In addition, the number of parameters is higher than in the leptonic model and the two components (self-Compton from electrons and synchrotron from protons) are basically independent of each other, as their densities are assumed to be uncorrelated. The hybrid model covers electrons and protons simultaneously. Hence self Compton and proton synchrotron emission exist within the same model.
The MAGIC observations reveal that the GeV–TeV emission is compatible with a single emission component, either self-Compton from the leptons or synchrotron from protons. The component from radio to X-rays is also explained by the synchrotron component of leptons in both scenarios. However, in the leptonic scenario, radio and X-rays would originate from the same region as the GeV–TeV data whereas in the hybrid scenario they would come from a different and a much larger region. The required electron luminosity ( including the counter jet) is comparable to the total jet power estimated from the large scale radio structure (Owen et al., 2000). However, the relatively high SSC flux requires a very low magnetization: the energy-density ratio of the magnetic field to the non-thermal electrons is at , which ismuch smaller than the values found in other blazars (, Asano & Hayashida, 2018).
Asada & Nakamura (2012) claim that the radio image of the M 87 jet is consistent with a parabolic streamline, also confirmed by Hada et al. (2013), which supports the magnetically-driven jet model (Komissarov et al., 2009). Later, Asada et al. (2014) show that the gradual acceleration through a distance of times the Schwarzschild radius also supports the magnetically driven jet model. In addition Kino et al. (2015) point out that the radio data at 230 GHz obtained by the Event Horizon Telescope implies a magnetically dominated jet. Those results seem inconsistent with the very low magnetization at 200 times the Schwarzschild radius indicated by the broadband SED. Other than the large-scale component constrained by radio observations, a very low-magnetized emission region is required to explain the gamma-ray spectrum by the leptonic model. Such a very low jet magnetization in the emitting region (the energy in leptons is 5 orders of magnitude higher than the energy in the magnetic field) is very far from the equipartition scenario. This suggests an emission region far from the core of the jet or a very efficient mechanism to convert Poynting flux into a matter dominated jet.
A similar low magnetization in leptonic modelling of blazars is also reported in Tavecchio & Ghisellini (2016), where the sample of BL Lacs used for the study were characterised by a small value of the magnetic energy density and a relatively large Doppler factor, not easy to be explained in a one-zone SSC scenario, but justified in a spine-layer model, supporting the hypothesis of structured jets in BL Lac objects.
New results from the EHT (Event Horizon Telescope Collaboration et al., 2019a) favor the hypothesis of the accretion disk as the origin of the observed emission at 230 GHz. However, given the fact that many of the used models produce images consistent with the EHT data, they suggests that the image shape is mainly controlled by gravitational lensing and the spacetime geometry, rather than details of the plasma physics.
The physical picture of the M 87 jet remains unrevealed yet, which provides great motivation of future observational and theoretical study for this object and blazars in general.
5 Conclusions
MAGIC has monitored M 87 from 2012 to 2015 for a total of 156 hrs after quality cuts. The source is detected in a low state every yearly campaign between 2012 and 2015. No clear variability is observed in the 2012, 2014, and 2015 data on daily and 20-days timescales. A hint of variability (3 level) is found in 2013 data on a daily timescale, remaining at a similar significance level even when variable systematic uncertainties of the MAGIC measurements are taken into account. The VHE gamma-ray flux level above 300 GeV between 2012 and 2015 is the lowest flux observed since 2005.
No clear variability was found at lower frequencies for the VLBA core and the jet data, nor for the EVN 1.7-GHz and 5-GHz data for HST-1 and the core respectively. However, variability was observed in HST, Chandra, EVN 1.7-GHz core and EVN 5-GHz HST-1 data, and VERA peak data at 22 and 44 GHz. The optical polarimetry data suggest a long-term rotation from to . The polarization stays in general at a rather low level, below 5%, except some higher polarization of up to around the beginning of the MAGIC observation period in 2012.
The energy spectrum of M 87 is found to have the same shape (within the statistical uncertainties) during the observations presented here and during the TeV flares observed in the past. Remarkably, the combination with Fermi-LAT data in GeV energies reveals a continuous photon spectrum over 5 orders of magnitude in energy, which is consistent with a simple power law.
The broadband SED is found to be consistent with leptonic and hybrid emission scenarios where the GeV–TeV component corresponds to self-Compton or synchrotron radiation from leptons and hadrons, respectively. An important result from the leptonic modelling is that the required jet magnetization in the emitting region is very low (the energy in leptons is 5 orders of magnitude higher than that in the magnetic field) and thus very far from the equipartition scenario. This either implies an emission region far from the core of the jet or a very efficient mechanism to convert Poynting flux into a matter dominated jet.
Both leptonic and hybrid model provide a good description of the data. However, the hybrid scenario is more consistent with the HE and VHE gamma-ray part of the SED. For this reason, it is preferred in describing the present low state of the source..
Further dense and precision MWL observations of M 87 are necessary to unveil the nature of the emission and its spatial location.
Acknowledgements
We are grateful to Dr. Filippo D’Ammando and Dr. C. C. Cheung for valuable discussions and their useful comments and suggestions.
We would like to thank the Instituto de Astrofísica de Canarias for the excellent working conditions at the Observatorio del Roque de los Muchachos in La Palma. The financial support of the German BMBF and MPG, the Italian INFN and INAF, the Swiss National Fund SNF, the ERDF under the Spanish MINECO (FPA2015-69818-P, FPA2012-36668, FPA2015-68378-P, FPA2015-69210-C6-2-R, FPA2015-69210-C6-4-R, FPA2015-69210-C6-6-R, AYA2015-71042-P, AYA2016-76012-C3-1-P, ESP2015-71662-C2-2-P, FPA2017-90566-REDC), the Indian Department of Atomic Energy, the Japanese JSPS and MEXT and the Bulgarian Ministry of Education and Science, National RI Roadmap Project DO1-153/28.08.2018 is gratefully acknowledged. This work was also supported by the Spanish Centro de Excelencia “Severo Ochoa” SEV-2016-0588 and SEV-2015-0548, and Unidad de Excelencia “María de Maeztu” MDM-2014-0369, by the Croatian Science Foundation (HrZZ) Project IP-2016-06-9782 and the University of Rijeka Project 13.12.1.3.02, by the DFG Collaborative Research Centers SFB823/C4 and SFB876/C3, the Polish National Research Centre grant UMO-2016/22/M/ST9/00382 and by the Brazilian MCTIC, CNPq and FAPERJ.
The Very Long Baseline Array is operated by the National Radio Astronomy Observatory, which is a facility of the National Science Foundation operated under cooperative agreement by Associated
Universities, Inc.
The work of F.Massaro is supported by the “Departments of Excellence 2018 - 2022” Grant awarded by the Italian Ministry of Education, University and Research (MIUR) (L. 232/2016). His research has made also use of resources provided by the Compagnia di San Paolo for the grant awarded on the BLENV project (S1618_L1_MASF_01) and by the Ministry of Education, Universities and Research for the grant MASF_FFABR_17_01. This investigation is supported by the National Aeronautics and Space Administration (NASA) grants GO4-15096X, AR6-17012X and GO6-17081X.
This work made use of the Swinburne University of Technology software
correlator, developed as part of the Australian Major National Research
Facilities Programme and operated under licence.
Based in part on observations made with the NASA/ESA Hubble Space Telescope, obtained at the Space Telescope Science Institute, which is operated by the Association of Universities for Research in Astronomy, Inc., under NASA contract NAS5-26555. These observations are associated with programmes GO 12293, 12671, 13061, and 13759.
Dan Harris passed away on December 6th, 2015.
His career spanned much of the history of radio and X-ray astronomy.
His passion, insight, and contributions will always be remembered.
Affiliations
1 Inst. de Astrofísica de Canarias, E-38200 La Laguna, and Universidad de La Laguna, Dpto. Astrofísica, E-38206 La Laguna, Tenerife, Spain
2 Università di Udine, and INFN Trieste, I-33100 Udine, Italy
3 National Institute for Astrophysics (INAF), I-00136 Rome, Italy
4 ETH Zurich, CH-8093 Zurich, Switzerland
5 Technische Universität Dortmund, D-44221 Dortmund, Germany
6 Croatian Consortium: University of Rijeka, Department of Physics, 51000 Rijeka; University of Split - FESB, 21000 Split; University of Zagreb - FER, 10000 Zagreb; University of Osijek, 31000 Osijek; Rudjer Boskovic Institute, 10000 Zagreb, Croatia
7 Saha Institute of Nuclear Physics, HBNI, 1/AF Bidhannagar, Salt Lake, Sector-1, Kolkata 700064, India
8 Centro Brasileiro de Pesquisas Físicas (CBPF), 22290-180 URCA, Rio de Janeiro (RJ), Brasil
9 IPARCOS Institute and EMFTEL Department, Universidad Complutense de Madrid, E-28040 Madrid, Spain
10 University of Łódź, Department of Astrophysics, PL-90236 Łódź, Poland
11 Università di Siena and INFN Pisa, I-53100 Siena, Italy
12 Deutsches Elektronen-Synchrotron (DESY), D-15738 Zeuthen, Germany
13 Istituto Nazionale Fisica Nucleare (INFN), 00044 Frascati (Roma) Italy
14 Max-Planck-Institut für Physik, D-80805 München, Germany
15 Institut de Física d’Altes Energies (IFAE), The Barcelona Institute of Science and Technology (BIST), E-08193 Bellaterra (Barcelona), Spain
16 Università di Padova and INFN, I-35131 Padova, Italy
17 Università di Pisa, and INFN Pisa, I-56126 Pisa, Italy
18 ICRANet-Armenia at NAS RA, 0019 Yerevan, Armenia
19 Centro de Investigaciones Energéticas, Medioambientales y Tecnológicas, E-28040 Madrid, Spain
20 Universität Würzburg, D-97074 Würzburg, Germany
21 Finnish MAGIC Consortium: Finnish Centre of Astronomy with ESO (FINCA), University of Turku, FI-20014 Turku, Finland; Astronomy Research Unit, University of Oulu, FI-90014 Oulu, Finland
22 Departament de Física, and CERES-IEEC, Universitat Autònoma de Barcelona, E-08193 Bellaterra, Spain
23 Japanese MAGIC Consortium: ICRR, The University of Tokyo, 277-8582 Chiba, Japan; Department of Physics, Kyoto University, 606-8502 Kyoto, Japan; Tokai University, 259-1292 Kanagawa, Japan; RIKEN, 351-0198 Saitama, Japan
24 Inst. for Nucl. Research and Nucl. Energy, Bulgarian Academy of Sciences, BG-1784 Sofia, Bulgaria
25 Universitat de Barcelona, ICCUB, IEEC-UB, E-08028 Barcelona, Spain
26 also at Port d’Informació Científica (PIC) E-08193 Bellaterra (Barcelona) Spain
27 also at Dipartimento di Fisica, Università di Trieste, I-34127 Trieste, Italy
28 also at INAF-Trieste and Dept. of Physics & Astronomy, University of Bologna
29 Centre for Space Research, North-West University, Potchefstroom 2520, South Africa
30 INAF Osservatorio Astronomico di Padova, vicolo dell’ Osservatorio 5, 35122, Padova, Italy
31 ICRR, University of Tokyo, Kashiwa-shi, Chiba 277-8582, Japan
32 Mizusawa VLBI Observatory, National Astronomical Observatory of Japan, 2-12 Hoshigaoka-cho, Mizusawa, Oshu, Iwate 023-0861, Japan
33 Department of Astronomical Science, The Graduate University for
Advanced Studies (SOKENDAI), 2-21-1 Osawa, Mitaka, Tokyo 181-8588,
Japan
34 Smithsonian Astrophysical Observatory, 60 Garden Street, Cambridge, MA 02138, USA
35 INAF Istituto di Radioastronomia, via Gobetti 101, 40129 Bologna, Italy
36 Astrophysics Research Institute, Liverpool John Moores University, Liverpool, UK
37 University of Texas Rio Grande Valley, Department of Physics and Astronomy, One West University Blvd. Brownsville, TX 78520, USA
38 Dipartimento di Fisica, Università degli Studi di Torino, via Pietro Giuria 1, I-10125 Torino, Italy
39 INFN, Sezione di Torino, I- 10125 Torino, Italy
40 INAF-Osservatorio Astrofisico di Torino, via Osservatorio 20, I-10025 Pino Torinese, Italy
41 Consorzio Interuniversitario per la Fisica Spaziale (CIFS), via Pietro Giuria 1, I-10125, Torino, Italy
42 National Radio Astronomy Observatory, Socorro, NM 87801 USA
43 Institut für Theoretische Astrophysik, Universitẗ Heidelberg
References
- Abdo et al. (2010) Abdo A. A., et al., 2010, Nature, 463, 919
- Abramowski et al. (2012) Abramowski A., et al., 2012, ApJ, 746, 151
- Acciari et al. (2008) Acciari V. A., et al., 2008, ApJ, 679, 397
- Acciari et al. (2009) Acciari V. A., et al., 2009, Science, 325, 444
- Acciari et al. (2010) Acciari V. A., et al., 2010, ApJ, 716, 819
- Acero et al. (2015) Acero F., et al., 2015, ApJS, 218, 23
- Aharonian et al. (2003) Aharonian F., et al., 2003, A&A, 403, L1
- Aharonian et al. (2006) Aharonian F., et al., 2006, Science, 314, 1424
- Ahnen et al. (2017) Ahnen M. L., et al., 2017, Astroparticle Physics, 94, 29
- Albert et al. (2008) Albert J., et al., 2008, ApJ, 685, L23
- Aleksić et al. (2012) Aleksić J., et al., 2012, A&A, 544, A142
- Aleksić et al. (2016) Aleksić J., et al., 2016, Astroparticle Physics, 72, 76
- Aliu et al. (2012) Aliu E., et al., 2012, ApJ, 746, 141
- Arnold et al. (2012) Arnold D. M., Steele I. A., Bates S. D., Mottram C. J., Smith R. J., 2012, in Ground-based and Airborne Instrumentation for Astronomy IV. p. 84462J, doi:10.1117/12.927000
- Asada & Nakamura (2012) Asada K., Nakamura M., 2012, ApJ, 745, L28
- Asada et al. (2014) Asada K., Nakamura M., Doi A., Nagai H., Inoue M., 2014, ApJ, 781, L2
- Asano & Hayashida (2015) Asano K., Hayashida M., 2015, ApJ, 808, L18
- Asano & Hayashida (2018) Asano K., Hayashida M., 2018, ApJ, 861, 31
- Asano et al. (2014) Asano K., Takahara F., Kusunose M., Toma K., Kakuwa J., 2014, ApJ, 780, 64
- Atwood et al. (2009) Atwood W. B., et al., 2009, ApJ, 697, 1071
- Beilicke & VERITAS Collaboration (2012) Beilicke M., VERITAS Collaboration 2012, in Aharonian F. A., Hofmann W., Rieger F. M., eds, American Institute of Physics Conference Series Vol. 1505, American Institute of Physics Conference Series. pp 586–589 (arXiv:1210.7830), doi:10.1063/1.4772328
- Bird et al. (2010) Bird S., Harris W. E., Blakeslee J. P., Flynn C., 2010, A&A, 524, A71
- Biretta et al. (1999) Biretta J. A., Sparks W. B., Macchetto F., 1999, ApJ, 520, 621
- Cardelli et al. (1989) Cardelli J. A., Clayton G. C., Mathis J. S., 1989, ApJ, 345, 245
- Cheung et al. (2007) Cheung C. C., Harris D. E., Stawarz Ł., 2007, ApJ, 663, L65
- Clarke & Neumayer (2002) Clarke D., Neumayer D., 2002, A&A, 383, 360
- De Jong et al. (2015) De Jong S., Beckmann V., Soldi S., Tramacere A., Gros A., 2015, MNRAS, 450, 4333
- Event Horizon Telescope Collaboration et al. (2019a) Event Horizon Telescope Collaboration et al., 2019a, ApJ, 875, L5
- Event Horizon Telescope Collaboration et al. (2019b) Event Horizon Telescope Collaboration et al., 2019b, ApJ, 875, L6
- Fanaroff & Riley (1974) Fanaroff B. L., Riley J. M., 1974, MNRAS, 167, 31P
- Gebhardt et al. (2011) Gebhardt K., Adams J., Richstone D., Lauer T. R., Faber S. M., Gültekin K., Murphy J., Tremaine S., 2011, ApJ, 729, 119
- Georganopoulos et al. (2005) Georganopoulos M., Perlman E. S., Kazanas D., 2005, ApJ, 634, L33
- Ghisellini et al. (2005) Ghisellini G., Tavecchio F., Chiaberge M., 2005, A&A, 432, 401
- Giannios et al. (2010) Giannios D., Uzdensky D. A., Begelman M. C., 2010, MNRAS, 402, 1649
- Giovannini et al. (2011) Giovannini G., Casadio C., Giroletti M., Beilicke M., Cesarini A., Krawczynski H., 2011, in Romero G. E., Sunyaev R. A., Belloni T., eds, IAU Symposium Vol. 275, Jets at All Scales. pp 150–154 (arXiv:1010.4170), doi:10.1017/S174392131001584X
- Giroletti et al. (2012) Giroletti M., et al., 2012, A&A, 538, L10
- Hada et al. (2013) Hada K., et al., 2013, ApJ, 775, 70
- Hada et al. (2014) Hada K., et al., 2014, ApJ, 788, 165
- Hada et al. (2015) Hada K., et al., 2015, arXiv e-prints, p. arXiv:1504.01808
- Harris et al. (2003) Harris D. E., Biretta J. A., Junor W., Perlman E. S., Sparks W. B., Wilson A. S., 2003, ApJ, 586, L41
- Harris et al. (2006) Harris D. E., Cheung C. C., Biretta J. A., Sparks W. B., Junor W., Perlman E. S., Wilson A. S., 2006, ApJ, 640, 211
- Harris et al. (2009) Harris D. E., Cheung C. C., Stawarz Ł., Biretta J. A., Perlman E. S., 2009, ApJ, 699, 305
- Hayashida et al. (2012) Hayashida M., et al., 2012, ApJ, 754, 114
- Hernandez (2014) Hernandez S. e. a., 2014, Space Telescope Imaging Spectrograph Instrument Handbook v. 13.0
- Hümmer et al. (2010) Hümmer S., Rüger M., Spanier F., Winter W., 2010, ApJ, 721, 630
- Iguchi et al. (2005) Iguchi S., Kkurayama T., Kawaguchi N., Kawakami K., 2005, PASJ, 57, 259
- Istomin & Sol (2009) Istomin Y. N., Sol H., 2009, Ap&SS, 321, 57
- Jermak et al. (2016) Jermak H., et al., 2016, MNRAS, 462, 4267
- Kalberla et al. (2005) Kalberla P. M. W., Burton W. B., Hartmann D., Arnal E. M., Bajaja E., Morras R., Pöppel W. G. L., 2005, A&A, 440, 775
- Kataoka et al. (2008) Kataoka J., et al., 2008, ApJ, 672, 787
- Kim et al. (2018a) Kim J.-Y., Lee S.-S., Hodgson J. A., Algaba J.-C., Zhao G.-Y., Kino M., Byun D.-Y., Kang S., 2018a, A&A, 610, L5
- Kim et al. (2018b) Kim J. Y., et al., 2018b, A&A, 616, A188
- Kino et al. (2015) Kino M., Takahara F., Hada K., Akiyama K., Nagai H., Sohn B. W., 2015, ApJ, 803, 30
- Komissarov et al. (2009) Komissarov S. S., Vlahakis N., Königl A., Barkov M. V., 2009, MNRAS, 394, 1182
- Lenain et al. (2008) Lenain J. P., Boisson C., Sol H., Katarzyński K., 2008, A&A, 478, 111
- Levinson & Rieger (2011) Levinson A., Rieger F., 2011, ApJ, 730, 123
- Li & Ma (1983) Li T. P., Ma Y. Q., 1983, ApJ, 272, 317
- MAGIC Collaboration et al. (2018) MAGIC Collaboration et al., 2018, A&A, 619, A45
- Maclay et al. (2019) Maclay M., et al., 2019, in American Astronomical Society Meeting Abstracts #233. p. 157.06
- Madrid (2009) Madrid J. P., 2009, AJ, 137, 3864
- Marscher et al. (2010) Marscher A. P., et al., 2010, ApJ, 710, L126
- Marshall et al. (2002) Marshall H. L., Miller B. P., Davis D. S., Perlman E. S., Wise M., Canizares C. R., Harris D. E., 2002, ApJ, 564, 683
- Massaro et al. (2009a) Massaro F., et al., 2009a, ApJ, 692, L123
- Massaro et al. (2009b) Massaro F., Harris D. E., Chiaberge M., Grandi P., Macchetto F. D., Baum S. A., O’Dea C. P., Capetti A., 2009b, ApJ, 696, 980
- Massaro et al. (2010) Massaro F., et al., 2010, ApJ, 714, 589
- Massaro et al. (2011) Massaro F., Harris D. E., Cheung C. C., 2011, ApJS, 197, 24
- Massaro et al. (2012) Massaro F., et al., 2012, ApJS, 203, 31
- Massaro et al. (2013) Massaro F., Harris D. E., Tremblay G. R., Liuzzo E., Bonafede A., Paggi A., 2013, ApJS, 206, 7
- Massaro et al. (2015) Massaro F., et al., 2015, ApJS, 220, 5
- Moderski et al. (2003) Moderski R., Sikora M., Błażejowski M., 2003, A&A, 406, 855
- Napier et al. (1994) Napier P. J., Bagri D. S., Clark B. G., Rogers A. E. E., Romney J. D., Thompson A. R., Walker R. C., 1994, IEEE Proceedings, 82, 658
- Neronov & Aharonian (2007) Neronov A., Aharonian F. A., 2007, ApJ, 671, 85
- Owen et al. (2000) Owen F. N., Eilek J. A., Kassim N. E., 2000, ApJ, 543, 611
- Perlman et al. (2001) Perlman E. S., Biretta J. A., Sparks W. B., Macchetto F. D., Leahy J. P., 2001, ApJ, 551, 206
- Perlman et al. (2011) Perlman E. S., et al., 2011, ApJ, 743, 119
- Prieto et al. (2016) Prieto M. A., Fernández-Ontiveros J. A., Markoff S., Espada D., González-Martín O., 2016, MNRAS, 457, 3801
- Proffitt et al. (2003) Proffitt C. R., Brown T. M., Mobasher B., Davies J., 2003, Technical report, Absolute Flux Calibration of STIS MAMA Imaging Modes
- Protheroe & Clay (2004) Protheroe R. J., Clay R. W., 2004, Publ. Astron. Soc. Australia, 21, 1
- Richter & Spanier (2016) Richter S., Spanier F., 2016, ApJ, 829, 56
- Ryan et al. (2015) Ryan B. R., Dolence J. C., Gammie C. F., 2015, ApJ, 807, 31
- Shepherd et al. (1994) Shepherd M. C., Pearson T. J., Taylor G. B., 1994, in BAAS. pp 987–989
- Steele et al. (2004) Steele I. A., et al., 2004, in Oschmann Jacobus M. J., ed., Society of Photo-Optical Instrumentation Engineers (SPIE) Conference Series Vol. 5489, Proc. SPIE. pp 679–692, doi:10.1117/12.551456
- Tavecchio & Ghisellini (2008) Tavecchio F., Ghisellini G., 2008, MNRAS, 385, L98
- Tavecchio & Ghisellini (2016) Tavecchio F., Ghisellini G., 2016, MNRAS, 456, 2374
- Walker (2014) Walker R. C., 2014, VLBA Scientific Memo n. 37
- Walker et al. (2018) Walker R. C., Hardee P. E., Davies F. B., Ly C., Junor W., 2018, ApJ, 855, 128
- Waters & Zepf (2005) Waters C. Z., Zepf S. E., 2005, ApJ, 624, 656
- Weidinger & Spanier (2010) Weidinger M., Spanier F., 2010, International Journal of Modern Physics D, 19, 887
- Wilson & Yang (2002) Wilson A. S., Yang Y., 2002, ApJ, 568, 133
- Zanin et al. (2013) Zanin R., et al., 2013, in Proceedings of the 33rd International Cosmic Ray Conference (ICRC2013): Rio de Janeiro, Brazil, July 2-9, 2013. p. 0773 (http://inspirehep.net/record/1412925/files/icrc2013-0773.pdf)