\ce^14N/^15N isotopic ratio in \ceCH3CN of Titan’s atmosphere measured with ALMA
Abstract
Each of the nitriles present in the atmosphere of Titan can be expected to exhibit different \ce^14N/^15N values depending on their production processes, primarily because of the various \ceN2 dissociation processes induced by ultraviolet radiation, magnetospheric electrons, and galactic cosmic rays. For \ceCH3CN, photochemical model predicted a \ce^14N/^15N value as 120–130 in the lower stratosphere. This is much higher than that for \ceHCN and \ceHC3N, 67–94. By analyzing archival data obtained by the Atacama Large Millimeter/submillimeter Array (ALMA), we successfully detected submillimeter rotational transitions of \ceCH3C^15N ( = 19–18) locate at the 338 GHz band in Titan’s atmospheric spectra. By comparing those observations with the simultaneously observed \ceCH3CN lines at the GHz band, we then derived \ce^14N/^15N in \ceCH3CN as . Although the range of the derived value shows insufficient accuracy due to data quality limitations, the best-fit value suggests that \ce^14N/^15N for \ceCH3CN is higher than values that have been previously observed and theoretically predicted for \ceHCN and \ceHC3N. This may be explained by the different \ceN2 dissociation sources , as suggested by a recent photochemical model.
1 Introduction
The presence of complex nitriles has been seen as one of the key features of Titan’s atmosphere since a millimeter emission spectrum of the Titan’s most abundant nitrile, HCN, was discovered in 1986 by the Institut de Radio Astronomie Millimtrique (IRAM) using a 30-m single-dish telescope (Paubert et al., 1987). Since that time, other nitriles such as \ceHC3N, \ceCH3CN, HNC, and \ceC2H5CN have been discovered by space and ground-based millimeter and observations (Marten et al. (2002); Moreno et al. (2011); Cordiner et al. (2015)). It is currently thought that the production of the above-described nitriles starts with the dissociation of \ceN2 into \ceN-atoms, which is induced by ultraviolet (UV) radiation, magnetospheric electrons (ME), and galactic cosmic rays (GCR). Recently, Loison et al. (2015) developed a neutral and ion chemistry model with which they successfully reproduced the observed vertical profiles of nitriles. According to their model, the main production path of \ceHCN is as follows: \ceN(^4S) + CH2 -¿ H2CN, \ceH2CN + H -¿ HCN + H2, where \ceN(^4S) is a ground-state \ceN-atom. In turn, \ceN(^2D), an excited-state \ceN-atom, easily reacts with \ceCH4, which is the second most abundant species on Titan, and produces \ceCH2NH. \ceCH2NH is lost by photo-dissociation and produces \ceH2CN, which leads to \ceHCN production. Once \ceHCN is formed, its photolysis produces reactive \ceCN radicals, which subsequently react with \ceC2H2 to produce \ceHC3N. Here, it is noted that the production process for \ceHNC, which is an isomer of \ceHCN, is similar to that for \ceHCN. \ceHNC is a minor product of the \ceH2CN + H reaction.
The production path for \ceCH3CN is expected to be different from that for \ceHCN and its daughter species. Loison et al. (2015) suggested that the main production path for \ceCH3CN is: \ceN(^4S) + C2H3 -¿ CH2CN, \ceCH2CN + H + M -¿ CH3CN. \ceCH2CN produces \ceC2H5CN by reacting with abundant \ceCH3 radicals, and it is expected that the production of \ceC2H3 radical occurs only in high-pressure (low altitude) regions (Loison et al., 2015). At such low altitudes, photo-dissociation of \ceN2 hardly ever occurs. Instead, it is considered likely that the production of \ceN(^4S) at those altitudes can be attributed to GCR-induced \ceN2 dissociation. A recent model by Dobrijevic & Loison (2018) showed that, below 600 km, the production of \ceN(^4S) is dominated by GCR-induced dissociation, not by UV or ME. Thus, the production of \ceCH3CN and \ceC2H5CN can be expected to continue below 600 km.
As mentioned above, the different \ceN2 dissociation processes lead to complex nitrogen compositions and chemistry. This is important because observations of the nitrogen isotopic ratio \ce^14N/^15N can be of use when evaluating theoretical models of Titan’s atmospheric chemistry. Dobrijevic & Loison (2018) predicted that the \ce^14N/^15N measured for the nitriles would change significantly depending on their production processes, in particular the dissociation process of \ceN2. Here, it should be noted that although dissociation due to GCR does not produce any isotopic fractionation, the same is not true for dissociation due to UV and ME. Due to the self-shielding nature of UV, \ceN^14N is not dissociated effectively in the upper stratosphere, whereas ME dissociate \ceN^14N 10 times more effectively than UV (Dobrijevic & Loison, 2018). In turn, in case of \ceN^15N, UV dissociation is stronger than that of ME because of less self-shielding.
The photochemical model of Dobrijevic & Loison (2018) suggested that \ceCH3CN and \ceC2H5CN have large differences in \ce^14N/^15N values compared with those for \ceHCN and \ceHC3N because of their production path differences. More specifically, the modeled \ce^14N/^15N values for \ceCH3CN and \ceC2H5CN are 80 at high altitudes (800 km) and increase to 120 in the lower stratosphere (200 km), while those for \ceHCN and \ceHC3N are expected to be relatively constant at 80 altitudes below 800 km. These modeled values for \ceHCN and \ceHC3N are in good agreement with previous observation results of 9413 (Gurwell, 2004) and 72.22.2 (Molter et al., 2016) for \ceHCN, and 6714 (Cordiner et al., 2018) for \ceHC3N.
It should be noted that a similar GCR-induced trace species production and brightness change process have also been proposed for Neptune (Lellouch (1994); Aplin & Harrison (2016)). From the viewpoint of planetary science, an understanding of the effects of GCR on atmospheric compositions is important because the process may be universally applicable to planets.
2 Data analysis
2.1 Extracting Titan data from the ALMA archive
The atmosphere of Titan is known to have seasonal variations in its thermal structure (e.g., Achterberg et al. (2008); Vinatier et al. (2010); Coustenis et al. (2013); Coustenis et al. (2018); Thelen et al. (2018)). The distribution of \ceCH3CN within Titan’s atmosphere also shows strong seasonal variations and spatial inhomogeneity (e.g., Cordiner et al. (2015); Lai et al. (2017); Thelen et al. (2019)). Therefore, researchers must always be careful when interpreting an isotopic ratio if the values were derived from the data of two isotopologues taken at different observation dates, and/or with different spatial resolutions. Keeping this point in mind, we searched the publicly released ALMA archive to identify the most favorable data for analyzing \ceCH3CN and \ceCH3C^15N.
CH3CN and \ceCH3C^15N have a large number of spectral lines with a variety of line strength in millimeter and wavelength. Data in the ALMA archive contain Titan as a science target and also as a flux calibration data. Accordingly, we began with a data search conducted among spectral cubes (spatial maps having spectral dimensions). However, since spectral cubes for use as calibration data had not previously been prepared in the archive, it was necessary for us to reduce them from raw visibility data. The calibration was done using the QA-2 pipeline script . Calibrated datasets for Titan were split into each spectral windows (SPW), and their line-of-sight Doppler-shift velocity values were corrected. The continuum and line emissions were separated in the plane. This process was needed to improve the dynamic range of the synthesized images, as our target spectral line features have weak intensity values. At the same time, synthesis images including the continuum emission are also required since we need to calibrate the flux density of Titan with respect to simulated spectra from our radiative transfer model (see Section 2.2). Imaging was performed with the CLEAN method with mode to produce a 320320 pixel image with a 0.025 spacing. A CLEAN mask with 1.5 diameter circle was placed at the Titan’s disk center.
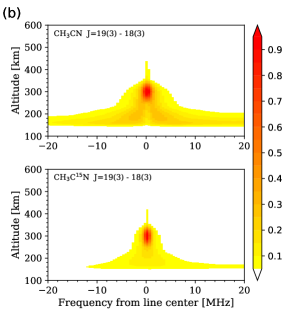
By examining all the CLEANed Titan images in the ALMA archival data, we successfully detected spectral features of \ceCH3C^15N in several datasets. We found that the data of ObsID 2013.1.00033.S contained two SPWs that include rotational transitions of \ceCH3C^15N (=19–18) in the 338.88–338.92 GHz range and The observation time was 157 seconds with seven observation scans taken at 6.05 second intervals. The observations were performed for flux and amplitude calibration. The center frequencies of SPWs for \ceCH3C^15N and \ceCH3CN were 337.995 and GHz, respectively. Since the total bandwidth and number of channels were 1874.956 MHz and 3840 channels, respectively, the spectral resolution was 488.270 kHz. The number of 12-m antennas used for the observation was 39. . The synthesis beam size was 1.190.62 (position angle = 70.3∘). The apparent disk diameter (2575 km) of Titan was 0.78 at the observed time, and the sub-Earth latitude was 24.7∘N.
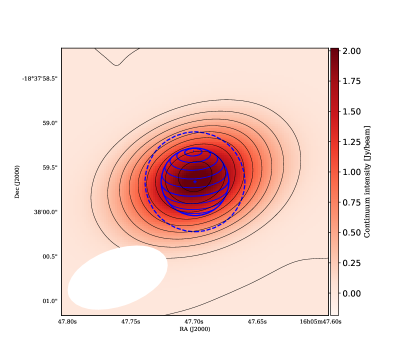
Figure 1 shows an integrated intensity map for Here it can be seen that the intensity peak is located in the northern mid-latitude region, which is consistent with past observations of the seasonal behavior of this species (Thelen et al., 2019). The thick Titan atmosphere creates significant limb brightening, and the emission originally extends outside of the 0.78-diameter disk. In order to collect such an extended emission, we averaged the spectra within a region that included the Titan atmosphere up to an altitude of 1200 km (1.15 diameter disk area, which is expressed as a dashed line in Figure 1). The disk-averaged spectra of both isotopologues are displayed in Figure 3(a) and 4(a).
2.2 Radiative transfer analysis
Next, we calculated the radiative transfer of atmospheric emissions from Titan. Our radiative transfer model consists of a line-by-line calculation using spherically uniform atmospheric layers. For the temperature profile, we referred to a recent work by Thelen et al. (2018), in which a disk-averaged temperature profile was retrieved from ALMA archived data observed on June 27, 2015 (2 months’ difference from the observation date of the data used in this study) (Figure 2). An a priori profile for \ceCH3CN was taken from Marten et al. (2002). Pencil-beam synthesis spectra were calculated under various emission angle conditions, including the limb-viewing geometry, and then convolved with an elliptic beam of the CLEANed image. The flux density for the observed spectrum was then calibrated against the continuum brightness of the forward model spectrum.
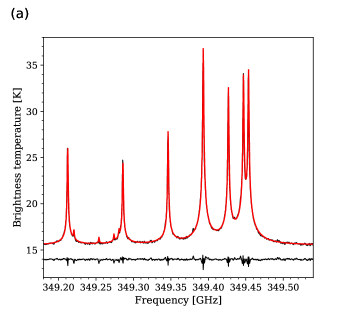
A vertical profile of \ceCH3CN was retrieved from the transitions at 349.21–349.45 GHz. Figure 3(a) shows the observed and best-fit spectra of \ceCH3CN. The a priori and retrieved vertical profiles are shown in Figure 3(b). Since the goal of this paper is to discuss \ce^14N/\ce^15N value for \ceCH3CN, we will not discuss the result of the retrieved \ceCH3CN profile in detail, but we briefly compared it with the work by Thelen et al. (2019) which has retrieved \ceCH3CN profile from the data taken on May 19, 2015.
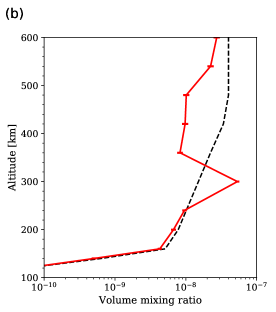
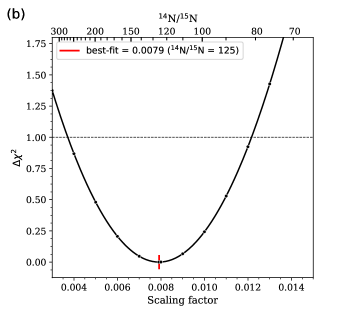
The retrieved \ceCH3CN profile was used to constrain the \ceCH3C^15N abundance by fitting the observed spectrum with a forward model spectrum. A vertically constant isotopic ratio is assumed in this study. The reduced values were calculated as a function of the scaling factor of \ceCH3C^15N with respect to the \ceCH3CN volume mixing ratio. Figure 4(a) shows the best-fit spectrum. Three \ceCH3C^15N lines are clearly detected in the observed SPW, and values were calculated using the data within a spectral range of 16 MHz around the best signal-to-noise ratio line at 338.882 GHz. The best-fit (the minimum of ) was obtained when the was , which corresponds to the \ce^14N/^15N value of . It is noted that this isotopic ratio also reproduces the other two \ceCH3C^15N lines that are not used in the fitting analysis. The fitting uncertainty was estimated from the range of , where is a difference from the minimum value. The corresponding uncertainty range was obtained as (Figure 4(b)).
3 Discussion
3.1 Caveat of the data analysis
3.2 Impact of the assumed temperature profile
One of the potential error sources in this study is the uncertainty in the temperature profile used in the radiative transfer calculation. We tested different temperature profiles for the \ce^14N/^15N derivation. Thelen et al. (2018) derived not only a disk-averaged temperature profile, but also temperature profiles representing the northern and southern hemispheres of Titan (Figure 2). Considering the fact that \ceCH3CN is enhanced in the northern hemisphere, as shown in Figure 1, the use of the northern hemispheric temperature profile provides an alternative choice when selecting a temperature profile for analyzing the \ceCH3CN spectra. If we use the northern hemispheric temperature profile of Thelen et al. (2018), the best fit \ce^14N/^15N in \ceCH3CN was .
3.3 Comparisons with the model and future perspectives
The best-fit \ce^14N/^15N value for \ceCH3CN, which is , falls within the range of the values obtained in the theoretical study of Dobrijevic & Loison (2018) (derived as 70–170 at 200 km, as the result of the Monte-Carlo simulation). As mentioned in Section 1, \ceCH3CN is expected to have two possible \ceN-atom origins, UV and GCR induced dissociation. Dobrijevic & Loison (2018) simulated the contribution of these two processes to \ce^14N/^15N for \ceCH3CN, and found that \ce^14N/^15N has two possible peak values, 90 and 160 (at 200 km), which corresponds to the UV and GCR origin scenarios, respectively. However, due to the data quality limitation, the \ce^14N/^15N value derived in this study is not sufficiently accurate to clearly differentiate between these two possible \ce^14N/^15N scenarios. In contrast to \ceCH3CN, both \ceHCN and \ceHC3N were expected to exhibit low \ce^14N/^15N value as 79.56.5 and 79.66.5, respectively, in the model. Our derived best-fit value of \ce^14N/^15N for \ceCH3CN is inconsistent with that expected for both \ceHCN and \ceHC3N, which supports the model’s prediction of the different \ceN2 dissociation sources among these nitriles.
For the further observational constraints, a dedicated observation of \ceCH3CN/\ceCH3C^15N with better sensitivity is required. In addition, derivation of a vertical profile of \ce^14N/^15N for \ceCH3CN could provide a good evaluation of the model because Dobrijevic & Loison (2018) predicted that the vertical distribution of \ce^14N/^15N might possibly exhibit a large gradient. Additionally, both the temporal and spatial variations of \ce^14N/^15N derived by additional observations will be useful for facilitating better understanding of the contributions of production processes under different environments (different UV condition, for example).


References
- Achterberg et al. (2008) Achterberg, R. K., Conrath, B. J., Gierasch, P. J., Flasar, F. M., & Nixon, C. A. 2008, Icarus, 194, 263
- Aplin & Harrison (2016) Aplin, K. L., & Harrison, R. G. 2016, Nature Communications, 7, 11976. http://www.nature.com/articles/ncomms11976
- Cordiner et al. (2018) Cordiner, M. A., Nixon, C. A., Charnley, S. B., et al. 2018, The Astrophysical Journal, 859, L15. http://stacks.iop.org/2041-8205/859/i=1/a=L15?key=crossref.3db3b0a1e328504fc7cc09382363bbb3
- Cordiner et al. (2015) Cordiner, M. a., Palmer, M. Y., Nixon, C. a., et al. 2015, The Astrophysical Journal, 800, L14. http://stacks.iop.org/2041-8205/800/i=1/a=L14?key=crossref.d304cda239aa0a7fa1c22fbf25847529
- Cordiner et al. (2015b) Cordiner, M. a., et al. 2015, American Astronomical Society, DPS meeting 47, id.205.03. https://ui.adsabs.harvard.edu/abs/2015DPS....4720503C/abstract
- Coustenis et al. (2018) Coustenis, A., Jennings, D. E., Achterberg, R. K., et al. 2018, The Astrophysical Journal, 854, L30. http://dx.doi.org/10.3847/2041-8213/aaadbdhttp://stacks.iop.org/2041-8205/854/i=2/a=L30?key=crossref.1fee7cb410afa4b45f2e8fba70342bf9
- Coustenis et al. (2013) Coustenis, A., Bampasidis, G., Achterberg, R. K., et al. 2013, The Astrophysical Journal, 779, 177. http://stacks.iop.org/0004-637X/779/i=2/a=177?key=crossref.4da79867b34ea56b4b4e7f414c51a352
- Dobrijevic & Loison (2018) Dobrijevic, M., & Loison, J. C. 2018, Icarus, 307, 371. https://doi.org/10.1016/j.icarus.2017.10.027
- Gurwell (2004) Gurwell, M. a. 2004, The Astrophysical Journal, 616, L7. http://arxiv.org/abs/astro-ph/0407169
- Lai et al. (2017) Lai, J. C. Y., Cordiner, M. A., Nixon, C. A., et al. 2017, The Astronomical Journal, 154, 206. http://arxiv.org/abs/1710.06411{%}0Ahttp://dx.doi.org/10.3847/1538-3881/aa8eef
- Lellouch (1994) Lellouch, E. 1994, Icarus, 108, 112. http://linkinghub.elsevier.com/retrieve/doi/10.1006/icar.1994.1045
- Loison et al. (2015) Loison, J. C., Hébrard, E., Dobrijevic, M., et al. 2015, Icarus, 247, 218. http://dx.doi.org/10.1016/j.icarus.2014.09.039
- Marten et al. (2002) Marten, A., Hidayat, T., Biraud, Y., & Moreno, R. 2002, Icarus, 158, 532. http://linkinghub.elsevier.com/retrieve/pii/S0019103502968971
- Molter et al. (2016) Molter, E. M., Nixon, C. A., Cordiner, M. A., et al. 2016, The Astronomical Journal, 152, 42. http://arxiv.org/abs/1606.00348http://stacks.iop.org/1538-3881/152/i=2/a=42?key=crossref.4259a4ec01fd61a24d2bd0bf6ad0d077
- Moreno et al. (2011) Moreno, R., Lellouch, E., Lara, L. M., et al. 2011, Astronomy & Astrophysics, 536, L12. http://www.aanda.org/10.1051/0004-6361/201118189
- Palmer et al. (2017) Palmer, M. Y., Cordiner, M. A., Nixon, C. A., et al. 2017, Science Advances, 3, 1
- Paubert et al. (1987) Paubert, G., Marten, A., Rosolen, C., Gautier, D., & Courtin, R. 1987, Bulletin of the American Astronomical Society, 19, 633
- Rengel et al. (2014) Rengel, M., Sagawa, H., Hartogh, P., et al. 2014, Astronomy & Astrophysics, 561, A4. http://www.aanda.org/10.1051/0004-6361/201321945
- Thelen et al. (2018) Thelen, A. E., Nixon, C. A., Chanover, N. J., et al. 2018, Icarus, 307, 380. https://doi.org/10.1016/j.icarus.2017.10.042
- Thelen et al. (2019) Thelen, A. E., Nixon, C., Chanover, N., et al. 2019, Icarus, 319, 417. https://linkinghub.elsevier.com/retrieve/pii/S0019103518304184
- Vinatier et al. (2010) Vinatier, S., Bézard, B., Nixon, C. a., et al. 2010, Icarus, 205, 559. http://linkinghub.elsevier.com/retrieve/pii/S0019103509003558
- Vuitton et al. (2019) Vuitton, V., Yelle, R. V., Klippenstein, S. J., Hörst, S. M., & Lavvas, P. 2019, Icarus, 324, 120. https://doi.org/10.1016/j.icarus.2018.06.013