Enhanced voltage-controlled magnetic anisotropy via magneto-elasticity in FePt/MgO(001)
Abstract
The interplay between magneto-electricity (ME) and magneto-elasticity (MEL) is studied in the context of voltage-controlled magnetic anisotropy (VCMA). Strain plays more than a role of changing lattice constant but that of the internal electric field in the heterostructure. As a prototype, FePt/MgO(001) is visited, where the behavior of two interfaces are drastically different: one exhibits switching the other does not. Whether an external electric field () is present or not, we found VCMA coefficient larger than 1 pJ/Vm, as a consequence of the rearrangement of orbitals with and in response to an external electric field. In addition, magneto-crystalline anisotropy (MA) is analyzed with strain taken into account, where non-linear feature is presented only accountable by invoking second-order MEL.
pacs:
75.80.+q, 75.30.Gw, 85.75.Dd, 77.80.bn, 77.55.nv, 75.70.-i,75.70.-iI Introduction
The advent of spintronics has witnessed a realization of magnetic random access memory (MRAM), which compliments or replaces conventional memories. This progress has relied on giant magneto-resistance (GMR)Binasch et al. (1989); Baibich et al. (1988) and tunnel magneto-resistance (TMR)Julliere (1975); Parkin et al. (2004). Moreover, the advancement is further pushed forward with the incorporation of spin-transfer torque (STT)Slonczewski (1996); Berger (1996); Tsoi et al. (2000) and spin-orbit torque (SOT)Oh et al. (2016); Qiu et al. (2014) for magnetization switching. In all cases, perpendicular magneto-crystalline anisotropy (PMA) is an essential ingredient to guarantee high bit density, lower switching current (), and thermal stability, , where is anisotropy; is the Boltzmann constant; is temperature. In spite of notable success in MRAM, high for switching and associated Joule heating are major obstacles to overcome.
Magneto-electric random access memory (MeRAM) has emerged as an alternative or compliments to MRAM, which utilizes voltage-controlled magnetic anisotropy (VCMA), where an external electric field () manipulates switching from one magnetization state to the other. The efficiency of VCMA is characterized by a single parameter, the VCMA coefficient, . The effective electric field, , where is the out-of-plane component of the dielectric tensor of an insulator, and is the magneto-crystalline anisotropy energy. In the pursuit of VCMA, various heterostructures have been explored, where FePt/MgO is one choice. FePt is ferromagnetic with a high Curie temperature of 750 KXu et al. (2014) and MgO has widely been used substrate. In addition to , strain can be another driving force of VCMA, which influences through of the insulator or acts as an effective electric field at ferromagnetic-insulator interface even in the absence of . Hence, comparative studies of VCMA with and without strain would be intriguing.
In this work, magneto-electricity (ME) as well as magneto-elasticity (MEL) of FePt/MgO is investigated. The non-linear magneto-crystalline anisotropy as a function of strain () is explained by invoking second-order MEL contribution, which is usually ignored. Fe-interface shows spin-reorientation for while for Pt case MA is positive regardless of . This difference stems from the competition between the positive effective anisotropy and negative first-order magneto-elasticity. Later, extremely large of FePt/MgO is presented as a result of an interplay between and . More specifically, the rearrangement of d orbitals at the interface in response to is the key, whose details are analyzed with band- and atom-resolved decompositions of MA.
II Computational methods
First-principles calculations have been carried out using Vienna ab initio Simulation Package (VASP) packageKresse and Furthmüller (1996) with projector augmented wave (PAW) basisBlöchl (1994). Generalized gradient approximation is employed for the exchange-correlation potentialPerdew and Wang (1992). Cutoff of 500 eV for plane wave expansion and a 12121 k mesh are used.
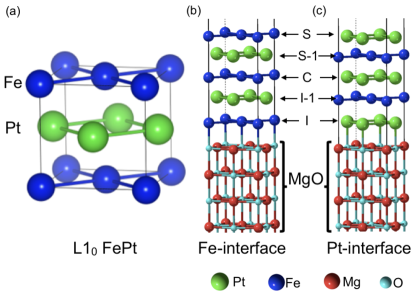
Fig. 1 shows the structure of bulk FePt and FePt/MgO film. Bulk FePt has structure [Fig. 1(a)] while the film consists of 5 monolayers (MLs) of FePt on 8 MLs MgO(001) [Fig. 1(b) and (c)]. In film, two different interfaces are taken into account by placing (i) Fe atoms on top of O atoms [Fig. 1(b)] and (ii) Pt atoms on top of O atoms [Fig. 1(c)], which are referred to Fe- and Pt-interface, respectively. The vacuum region of 12 is taken between adjacent cells. Both interfaces are systematically studied, where , -1, , , and -1refer to the surface, sub-surface, center, interface, and sub-interface layer, respectively. The optimized lattice constant of FePt and MgO are 3.864 and 4.212 , respectively, resulting in a large tensile strain () on the FePt layer, assuming the MgO substrate is unstrained. In order to study strain dependent MA of the system, , defined as , is varied from (unstrained FePt lattice constant) to (nearly unstrained MgO lattice constant), where is the equilibrium lattice constant of bulk FePt. Interlayer distances are relaxed for each strain with force criteria 1 eV/. Magneto-crystalline anisotropy energy () is determined from the total energy difference between [100] and [001] directions, where spin-orbit coupling (SOC) is treated in second-variational wayKoelling and Harmon (1977). Convergence of is checked with 30301 k mesh. The electric field along the surface normal is applied employing dipole layer methodNeugebauer and Scheffler (1992). In this work, shape anisotropy is not included in magnetic anisotropy.
III Results and Discussion
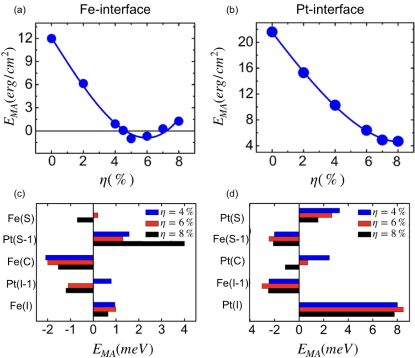
When , and 21.5 erg/cm2 for Fe- and Pt-interface, respectively, indicating perpendicular magnetization. Under tensile strain, both interfaces exhibit parabolic curve as shown in Fig. 2(a) and (b). However, one interface shows switching behavior but the other does not. For Fe-interface for , whereas for Pt-interface decreases with strain. The overall feature is expressed as
| (1) |
where is the zero strain anisotropy energy per area; and () are the direction cosines of magnetization and the strain tensor, respectively; is the FM film thickness; and are the first- and second-order MEL coefficients, respectivelyLandau and Lifshitz (1984).
MEL energy is expanded up to second-order of , whose coefficient is usually small and ignoredShick et al. (1997); Paes and Mosca (2013). However, it is explicitly taken into account here, whose consequence is discussed later. The zero-strain anisotropy energy is approximated as for uniaxial symmetry. It is decomposed into bulk and interface contributions, for thin film limit. In tetragonal structure, and the perpendicular strain is determined from magneto-elastic equation of state [See Supplementary Information]. Substituting the calculated strain value in Eq. (1) gives
| (2) |
where
| (3) |
and
| (4) |
where is the elastic stiffness constant at constant magnetization. The derivation of Eq. (2) is also given in Supplementary Information.
Table 1 lists magneto-elastic and effective anisotropy coefficients, extracted by fitting ab initio results. The second-order term, , responsible for the non-linearity is significantly large with 1.29 and 0.79 erg/cm3 for Fe- and Pt- interface, respectively. The difference in magnitudes of for both interfaces arises due to different local environment of two interfaces. Fe atoms experience larger magneto-elasticity in the presence of MgO substrate than Pt interface. The difference of two interfaces is further discussed now.
| Interface | |||
|---|---|---|---|
| Fe | -3.16 | 1.29 | 12.44 |
| Pt | -2.43 | 0.79 | 21.57 |
The calculated is of the opposite sign to that of for both interfaces. Further, it has been asserted that in the presence of strain, Komelj and Fähnle (2000); Tian et al. (2009). In our study, the ratio is large for Fe-interface as compared to Pt-interface, leading to a change in sign of for large strain values. For the Fe-interface, a competition between and produces spin reorientation, for . On the other hand, for the Pt-interface, results in PMA for up to .
Due to spin reorientation transition, we focus on = 4, 6, and 8%. Fig. 2(c-d) provides atomic layer resolved . PMA mainly arises from Pt layers. Especially, the dominant PMA contribution comes from Pt(S-1) for Fe-interface and from Pt(I) for Pt-interface. Pt contribution to PMA is consistent with hard X-ray photoemission experimentUeda et al. (2016). On the contrary, Fe atoms mostly contribute to , except Fe(I) and Fe(S) layers. Under strain, the overall behavior of remains the same for most of the atoms with changes in magnitude only. PMA from Fe(S), Pt(I-1) and Pt(C) at becomes in-plane as approaches to .
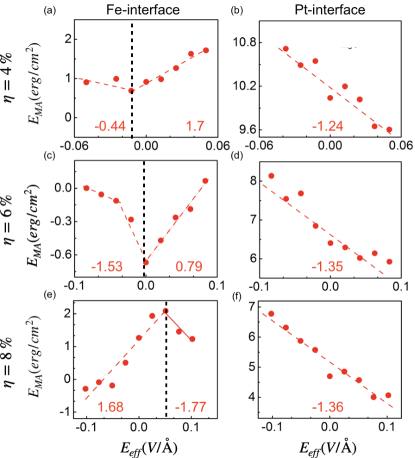
Now switching to VCMA, Fig. 3 shows change in MA as a function of for = 4, 6, and 8%. VCMA coefficient is defined as in the linear regime of as mentioned earlier. We choose =20.0, 12.0, 9.8 for MgO when = 4, 6, and 8, respectively, taken from Ref.Ong et al. (2015). Large VCMA coefficients are found for both interfaces. For Pt-interface, -1.24, -1.35, and -1.36 pJ/(Vm) under and , respectively. On the other hand, Fe-interface exhibits qualitatively different VCMA with strain. The V-shape curve is apparent for and with = 1.70 (-0.44) and 0.79 (-1.53) when (), respectively. At , the VCMA curve changes to -shape with -1.77 (1.68) under ().
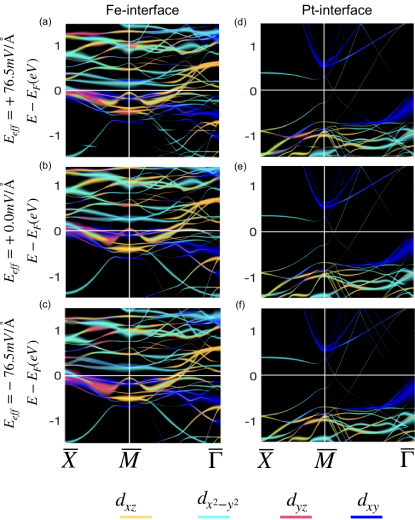
To understand the underlying mechanism of strain-induced MA and VCMA, orbital resolved bands at are plotted in Fig. 4 along high symmetry lines in two-dimensional Brillouin zone (BZ) under = +76.5, 0, and -76.5 mV/. The case are discussed in detail as it shows largest VCMA coefficient. For Fe- and Pt-interfaces, only the minority spin channel of Fe d bands and majority spin channel of Pt d bands are presented, respectively, as other spin channels do not contribute significantly to PMA. The d orbitals for both interfaces can contribute negatively to PMA and are shown in Supplementary Information. Both spin channels for Fe and Pt d bands at , , and are also provided in Fig. S1 and Fig. S2 in Supplementary Information, respectively.
In the framework of perturbation theoryWang et al. (1993), positive (negative) comes from spin-orbit coupling (SOC) between the unoccupied and occupied majority or minority spin states with the same (different) magnetic quantum number through . This approach has been widely applied in various systems Nakamura et al. (2010); Odkhuu et al. (2011, 2013); Hotta et al. (2013); Odkhuu et al. (2016); Qurat-ul-ain et al. (2018).
First, we discuss without , namely, strain-induced MA. For Fe-interface, arises from and along [Fig. 4(b)]. Similarly, for Pt- interface mainly comes from along [Fig. 4(e)]. As tensile strain decreases, bands experience overall downward shift for Fe-interface. However, for Pt-interface, and moves upward and downward, respectively, with decreasing strain, which is shown in Fig. LABEL:fig:S1 and Fig. LABEL:fig:S2 in Supplementary Information. Strain driven band rearrangement leads to substantial change in as , where () denotes energies of unoccupied (occupied) bands. In particular, at for Fe-interface, comes from around . Also, at , is through around .
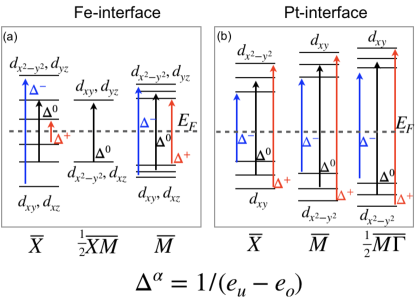
Moving to VCMA, bands shift at under are shown in top and bottom panels of Fig. 4. To understand in a simple picture, a schematic diagram is illustrated in Fig. 5. () denotes the inverse of the energy difference between unoccupied and occupied bands when is positive, zero, and negative, respectively.
Summing all SOC matrices, justifies the -shaped VCMA for Fe-interface. Under zero-field, occupied d (dxz) bands couples with unoccupied dxy (dyz) bands at , giving . With 76.5 mV/, unoccupied bands dxy and dyz becomes occupied, resulting in . Moreover, when , dxy and dxz occupied bands along with d and dyz unoccupied bands move towards at and , providing large PMA. While when , these bands moves away from , as a result contributing small PMA. On the other hand, for Pt-interface, explains linear VCMA. When , the unoccupied dxy band and occupied d band at , shift towards with respect to zero-field, resulting in enhanced PMA. However, when , both these bands move away from as compared to zero-field, hence PMA is reduced.
IV Conclusions
In summary, we investigated strain dependent voltage-controlled magnetic anisotropy for both Fe- and Pt-interfaces of FePt/MgO(001) film using ab initio electronic structure calculations. We predicted a huge VCMA coefficient 1.77 pJ/(Vm) due to the internal electric field as a result of strain. Moreover, magneto-crystalline anisotropy as a function of strain is also discussed. The strain-dependent non-linear magneto-crystalline anisotropy is explained by invoking second-order magneto-elastic (MEL) term in MA energy. Fe-interface shows spin-reorientation for as a consequence of the competition between the positive and negative . Magneto-crystalline anisotropy turns out to be extremely sensitive to strain and interface. Our finding provides a direction for experiments to achieve enhanced VCMA coefficient along with large PMA for ultra-low power nonvolatile memory devices.
Acknowledgements.
This work was supported by National Research Foundation of Korea (NRF) grant (NRF-2018R1A4A1020696 and NRF-2019R1I1A3A01059880).References
- Binasch et al. (1989) G. Binasch, P. Grünberg, F. Saurenbach, and W. Zinn, Phys. Rev. B 39, 4828 (1989).
- Baibich et al. (1988) M. N. Baibich, J. M. Broto, A. Fert, F. N. Van Dau, F. Petroff, P. Etienne, G. Creuzet, A. Friederich, and J. Chazelas, Phys. Rev. Lett. 61, 2472 (1988).
- Julliere (1975) M. Julliere, Phys. Lett. A 54, 225 (1975).
- Parkin et al. (2004) S. S. Parkin, C. Kaiser, A. Panchula, P. M. Rice, B. Hughes, M. Samant, and S.-H. Yang, Nat. Mater. 3, 862 (2004).
- Slonczewski (1996) J. C. Slonczewski, J. Magn. Magn. Mater. 159, L1 (1996).
- Berger (1996) L. Berger, Phys. Rev. B 54, 9353 (1996).
- Tsoi et al. (2000) M. Tsoi, A. Jansen, J. Bass, W.-C. Chiang, V. Tsoi, and P. Wyder, Nature 406, 46 (2000).
- Oh et al. (2016) Y.-W. Oh, S.-h. C. Baek, Y. M. Kim, H. Y. Lee, K.-D. Lee, C.-G. Yang, E.-S. Park, K.-S. Lee, K.-W. Kim, G. Go, et al., Nat. Nanotechnol. 11, 878 (2016).
- Qiu et al. (2014) X. Qiu, P. Deorani, K. Narayanapillai, K.-S. Lee, K.-J. Lee, H.-W. Lee, and H. Yang, Sci. Rep. 4, 4491 (2014).
- Xu et al. (2014) D. Xu, C.-J. Sun, J.-S. Chen, T.-J. Zhou, S. M. Heald, A. Bergman, B. Sanyal, and G. M. Chow, J. Appl. Phys. 116, 143902 (2014).
- Kresse and Furthmüller (1996) G. Kresse and J. Furthmüller, Phys. Rev. B 54, 11169 (1996).
- Blöchl (1994) P. E. Blöchl, Phys. Rev. B 50, 17953 (1994).
- Perdew and Wang (1992) J. Perdew and Y. Wang, Phys. Rev. B 45, 13244 (1992).
- Koelling and Harmon (1977) D. Koelling and B. Harmon, J. Phys. C:Solid State Phys. 10, 3107 (1977).
- Neugebauer and Scheffler (1992) J. Neugebauer and M. Scheffler, Phys. Rev. B 46, 16067 (1992).
- Landau and Lifshitz (1984) L. D. Landau and E. M. Lifshitz, Electrodynamics of Continuous Media (Pergamon Press, Oxford,1984) (Pergamon Oxford, 1984).
- Shick et al. (1997) A. Shick, D. Novikov, and A. J. Freeman, Phys.Rev. B 56, R14259 (1997).
- Paes and Mosca (2013) V. Z. Paes and D. H. Mosca, J. Magn. Magn. Mater. 330, 81 (2013).
- Komelj and Fähnle (2000) M. Komelj and M. Fähnle, J. Magn. Magn. Mater. 222, 245 (2000).
- Tian et al. (2009) Z. Tian, D. Sander, and J. Kirschner, Phys. Rev. B 79, 024432 (2009).
- Ueda et al. (2016) S. Ueda, M. Mizuguchi, Y. Miura, J. Kang, M. Shirai, and K. Takanashi, Appl. Phys. Lett. 109, 042404 (2016).
- Ong et al. (2015) P. Ong, N. Kioussis, D. Odkhuu, P. K. Amiri, K. Wang, and G. P. Carman, Phys. Rev. B 92, 020407 (2015).
- Wang et al. (1993) D. S. Wang, R. Wu, and A. J. Freeman, Phys. Rev. B 47, 14932 (1993).
- Nakamura et al. (2010) K. Nakamura, T. Akiyama, T. Ito, M. Weinert, and A. J. Freeman, Phys. Rev. B 81, 220409(R) (2010).
- Odkhuu et al. (2011) D. Odkhuu, W. S. Yun, S. H. Rhim, and S. C. Hong, Appl. Phys. Lett. 98, 152502 (2011).
- Odkhuu et al. (2013) D. Odkhuu, S. H. Rhim, N. Park, and S. C. Hong, Phys. Rev. B 88, 184405 (2013).
- Hotta et al. (2013) K. Hotta, K. Nakamura, T. Akiyama, T. Ito, T. Oguchi, and A. J. Freeman, Phys. Rev. Lett. 110, 267206 (2013).
- Odkhuu et al. (2016) D. Odkhuu, W. S. Yun, S. H. Rhim, and S. C. Hong, J. Magn. Magn. Mater. 414, 126 (2016).
- Qurat-ul-ain et al. (2018) Qurat-ul-ain, D. D. Cuong, D. Odkhuu, S. H. Rhim, and S. C. Hong, J. Magn. Magn. Mater. 467, 69 (2018).