The VLT-FLAMES Tarantula Survey
Analysis of late O-type stars observed in the Large Magellanic Cloud (LMC) by the VLT-FLAMES Tarantula Survey (VFTS) revealed a discrepancy between the physical properties estimated from model-atmosphere analysis and those expected from their morphological classifications. Here we revisit the analysis of 32 of these puzzling objects using new hydrogen-helium-silicon fastwind models and a different fitting approach to re-evaluate their physical properties. Our new analysis confirms that these stars indeed have properties that are typical of late O-type dwarfs. We also present the first estimates of silicon abundances for O-type stars in the 30 Dor clusters NGC 2060 and NGC 2070, with a weighted mean abundance for our sample of 7.05 0.03. Our values are 0.20 dex lower than those previously derived for B-type stars in the LMC clusters N 11 and NGC 2004 using tlusty models. Various possibilities (e.g. differences in the analysis methods, effects of microturbulence, and real differences between stars in different clusters) were considered to account for these results. We also used our grid of fastwind models to reassess the impact of using the Galactic classification criteria for late O-type stars in the LMC by scrutinising their sensitivity to different stellar properties. At the cool edge of the O star regime the He II 4686/He I 4713 ratio used to assign luminosity class for Galactic stars can mimic giants or bright giants in the LMC, even for objects with high gravities ( 4.0 dex). We argue that this line ratio is not a reliable luminosity diagnostic for late O-type stars in the LMC, and that the Si IV 4089/He I 4026 ratio is more robust for these types.
Key Words.:
stars: abundances – stars: early type – stars: fundamental parameters – stars: mass loss – Magellanic Clouds1 Introduction
Bright, massive stars play an important role in the evolution of galaxies and of the Universe as a whole. The Tarantula nebula (30 Doradus) in the Large Magellanic Cloud (LMC) comprises the most massive starburst cluster and giant H II region in the Local Group, and contains the most massive stars known (Crowther et al. 2010, Bestenlehner et al. 2011, Schneider et. 2018). As such, 30 Dor was the target of the VLT-FLAMES Tarantula Survey (VFTS, Evans et al. 2011), an unprecedented spectroscopic survey of 800 OB-type stars investigating their physical properties and multiplicity.
Spectra of approximately 350 of the VFTS targets were classified as O-type (Walborn et al. 2014). Physical properties from atmospheric analysis (including wind parameters) for the apparently single O-type dwarfs were presented by Sabín-Sanjulián et al. (2014, 2017), with a similar analysis for the giants and supergiants by Ramírez-Agudelo et al. (2017, hereafter RA17). These studies employed hydrogen–helium models calculated with the latest version (v10.1) of the fastwind (FW) NLTE line-blanketed, model-atmosphere code (Puls et al. 2005; Rivero González et al. 2012), combined with automated fitting using the IACOB–Grid Based Automatic Tool (iacob–gbat, see Simón-Díaz et al. 2011) for the former two studies, and a method employing the pikaia Genetic Algorithm (hereafter GA, Charbonneau 1995) for the ostensibly more luminous stars (see Mokiem et al. 2005).
This approach proved to be both effective and reliable, but the resulting parameters were rather unexpected in some cases. In particular, RA17 reported a group of low-luminosity (4.20 5.00) late O-type giants and bright giants with effective equatorial surface gravities (3.8 4.6 dex) that were greater than expected for their luminosity class111When stars evolve away from the zero-age main sequence their radii increase, and therefore their surface gravities decrease. Thus, although still on the main sequence, the more evolved O stars (giants and supergiants) would be expected to have lower gravities compared to the dwarfs.. Some of these were also found to have a helium content that was lower than expected for such stars in the LMC (see e.g. Brott et al. 2011). Interestingly, stars with rather high values of (4.4 to 4.5) and peculiarly low helium abundances were also identified among the O dwarfs from the VFTS (Sabín-Sanjulián et al. 2017).
Three hypotheses have been suggested to explain the puzzling results for this subset of stars:
-
i)
Limitations in HHe models for low-luminosity late-O stars;
-
ii)
intricacies in spectral classification, such as for example metallicity effects, strong nebular contamination in the Balmer and He I lines, and/or specific difficulties in morphological classification at late-O subtypes; and
-
iii)
undetected binarity or contamination in the fibre by another star that is not gravitationally bound with the target but impacts on the parameters derived from the spectroscopic analysis and available photometry.
This lack of consistency between morphological classifications and stellar properties from model atmosphere analyses presents an interesting challenge for the study of the low-luminosity late-O stars in the VFTS. As these comprise a reasonable fraction (9%) of the O stars observed by the survey, we decided to reinvestigate their properties with an alternative method to those used previously. This included fits with hydrogen–helium–silicon (HHeSi) FW models and a classical ‘by-eye’ approach to the model fits. We also reassessed the classification criteria used by Walborn et al. (2014) at the cool end of the O-star regime, focussing on the stellar properties that most critically influence the relative strengths of the diagnostic lines.
The layout of the paper is as follows. Section 2 presents the selection of the sample. Section 3 describes the new model grids and analysis strategy. Section 4 compares the estimated properties of the sample with published results and presents the first estimates of silicon abundances in late O-type stars in the LMC. Section 5 investigates the predicted behaviour of the diagnostic lines compared to the classification criteria used for the sample, and Section 6 summarises our findings.
| VFTS | Classification | Rating(a) | Mult? | Comments |
|---|---|---|---|---|
| 070 | O9.7 II | BBB | SB? | Si IV very weak |
| 077 | O9.5: IIIn | BBB | Si IV very weak | |
| 080 | O9.7 II-III((n)) | BBB | Si IV weak | |
| 091 | O9.5 IIIn | AAA | ||
| 104 | O9.7 II-III((n)) | BBB | Si IV very weak | |
| 113 | O9.7 II or B0 IV | BBB | SBs | Si IV very weak |
| 128 | O9.5 III:((n)) | BBB | Si IV weak | |
| 131 | O9.7 | BBB | ||
| 141 | O9.5 II-III((n)) | BBB | SB? | Si IV very weak |
| 188 | O9.7: III | BBB | SB? | Si IV very weak |
| 192 | O9.7 II or B0 IV | BBB | Si IV weak | |
| 205 | O9.7 II((n)) or B0 IV((n)) | BBB | Si IV, C III very weak | |
| 207 | O9.7 II((n)) | BBB | Si IV, C III very weak | |
| 210 | O9.7 II-III((n)) | AAA | ||
| 226 | O9.7 III | BBB | Si IV weak; runaway | |
| 328 | O9.5 III(n) | BBB | SB? | Si IV weak; runaway |
| 346 | O9.7 III | BBB | Si IV very weak | |
| 370 | O9.7 III | BBB | SB? | Si IV weak; runaway |
| 412 | O9.7 | BBB | ||
| 444 | O9.7 | BBB | SB? | |
| 495 | O9.7 II-IIIn | BBB | Si IV very weak | |
| 528 | O9.7(n) | BBB | Si IV very weak | |
| 569 | O9.2 III: | AAA | Si IV weak | |
| 571 | O9.5 II-III(n) | BBB | SB? | Si IV weak |
| 574 | O9.5 IIIn | AAA | SB2? | |
| 607 | O9.7 III | BBB | SB? | Si IV very weak |
| 615 | O9.5 IIInn | AAA | VM3 | |
| 620 | O9.7 III(n) | AAA | SB? | Si IV weak |
| 622 | O9.7 III | BBB | SB? | Si IV weak |
| 753 | O9.7 II-III | AAA | ||
| 787 | O9.7 III | BBB | SB | Si IV weak |
| 843 | O9.5 IIIn | AAA |
Notes. (a) AAA and BBB indicate high-/low-rated classifications, respectively. (b) Comments from Walborn et al. (2014) on possible multiplicity: ‘SB?’ – stellar absorption displaced from nebular emission lines but no radial-velocity variation measured; ‘SBs’ – small amplitude (10–20 km s-1 ) radial-velocity variations; ‘SB2?’ – possible double-lined binary system; ‘VM3’ – visual multiple consisting of three components.
2 Observational sample
The sample from RA17 comprised 72 presumably single O-type giants and supergiants, complemented with 31 stars classified as O-type but without luminosity classifications (see Walborn et al. 2014). For a remarkable 58% of the former, the estimated equatorial surface gravities do not match values that would be expected from their luminosity classifications.
The RA17 sample was assembled by including targets with no significant radial velocity ( ) variations, or where significant but only small shifts ( 20 km s-1 ) were seen from the VFTS spectroscopy (Sana et al. 2013). Several of these objects were later identified as binaries by further monitoring by Almeida et al. (2017) and were omitted from our sample222Almeida et al. (2017) found 28 km s-1 for VFTS 113 but were unable to estimate a reliable period so we retained it in our sample as an apparently single star..
Of course, some of our objects will probably be identified in the future as binaries. Sana et al. (2013) estimated an intrinsic binary fraction of 50% for the O-type stars from the VFTS. Therefore, in the sample studied by RA17, at least 32 binaries (with periods less than about 10 yr) may be expected, with only six idenfied so far by Almeida et al. (2017). The VFTS spectra might also include contributions from more than one star (not necessarily physically bound), although unless the two components have similar effective temperatures and luminosities, the analysis presented here should reveal peculiarities arising from binarity or composite spectra.
Discarding the most recently discovered binaries and objects with poor-quality fits (see Tables C.4 and C.5 in RA17, respectively), 32 objects remain from RA17 with peculiarly high surface gravities, which form the observational sample for our study. Their classifications from Walborn et al. (2014) are listed in Table 1, with all but one classified as O9.5-O9.7. The table also includes additional morphological comments of note as follows:
-
•
Rating: The ‘AAA’ notation was used by Walborn et al. for spectra with sufficiently high quality for morphological analysis. A ‘BBB’ rating indicated objects with low-rated classifications due to for example low signal-to-noise (S/N) ratios, strong nebular contamination in the Balmer and He I lines, or suspected binarity.
-
•
Additional comments regarding multiplicity: Walborn et al. also noted morphological features that may indicate evidence for binary companions that were otherwise undetected from the analyses. As indicated in Table 1, these primarily comprised stars where a clear offset was seen between the stellar absorption and nebular emission lines (‘SB?’).
-
•
Si weak stars: Many of the sample spectra also displayed a discrepancy between the He II 4686/He I 4713 and the Si IV 4089/He I 4026 line ratios used to assign luminosity classes (cf. Galactic standards) for late O-types. These were flagged as ‘Si IV weak’ by Walborn et al.
The majority of the sample are members of the two main clusters in 30 Dor (NGC 2070 and NGC 2060)333Sana et al. (2013) defined radii of 24 for membership of these two clusters and we adopted the same definition here., with only nine located in the nearby field. As seen from Table 1, 24 (75%) of our targets were BBB rated, highlighting that many of the stars with unexpected parameters are those with lower quality data. It is also notable that 23 (72%) were classified as Si weak (all but two of which were also rated as BBB), and 14 (44%) have some indication of possible multiplicity or composite nature.
To improve the S/N ratios and to simplify the analysis, RA17 employed spectra where the multi-epoch observations for each target were combined into a single, normalised spectrum. For consistency we use the same spectra here.
3 Model atmosphere analysis
Helium is the traditional temperature indicator in atmospheric analysis of O-type stars. Using HHe models was effective for the majority of the O stars from the VFTS, but there were cases where it did not provide robust results, such as weak or absent helium lines or spectra with strong nebular contamination. Alternative diagnostics such as nitrogen (early to mid-O stars) and silicon (O9.2-O9.7 stars) were therefore used to provide additional constraints (Sabín-Sanjulián et al. 2014, 2017, RA17).
As our sample consists only of late O-type stars, we employed HHeSi models calculated with FW (v10.1) to analyse the spectra. For an initial assessment of the basic stellar parameters, namely effective temperature ( ), the logarithm of the effective surface gravity ( ), microturbulence ( ), helium and silicon content with respect to particle number (= and = , respectively), and wind-strength parameter = /( * )1.5 (see Puls et al. 1996), we used a newly constructed grid of FW models with parameters typical for late-O and early-to-mid B stars in the LMC. For all but microturbulent velocity (see Sect. 3.3), these estimates were additionally fine-tuned by calculating a higher-resolution grid around the initial parameters, with tailored values of , , , , and .
3.1 The new FASTWIND grid
Non-local thermodynamic equilibrium (NLTE), line-blanketed, spherically symmetric models with stellar winds are generally used to analyse O-type stars (e.g. Crowther et al. 2002 Massey et al. 2004, 2005; Mokiem et al. 2005). In contrast, following tests of results from static versus wind models by Dufton et al. (2005), NLTE, line-blanketed, plane-parallel models (tlusty/synspec) are often used to investigate B-type stars (e.g. Hunter et al. 2007; Trundle et al. 2007; McEvoy et al. 2015; Dufton et al. 2018). This can lead to difficulties in comparing results from the two approaches, as discussed later in Sect. 4.4.
The new grid was calculated to provide a tool to explore the critical regime of late O- and early B-type stars in the LMC, in a statistically significant and internally consistent manner, and taking into account the effects of stellar winds in each object. The grid comprises 6 000 atmosphere models with more than 20 000 synthetic spectra, computed using seven input parameters: , , , , microturbulent velocity ( ), the wind velocity field exponent , and . A global metallicity (though specifying the helium and silicon content explicitly) of 0.5 was adopted (see e.g. Mokiem et al. 2007) 444Reference solar abundances were taken from Asplund et al. (2009)..
The parameter space of the grid is summarised in Table 2. Detailed information on how each of the listed parameters was specified in the calculations will be presented in a forthcoming paper (Petrov et al. in prep.). Here we briefly note specific points that are pertinent to the current analysis:
- i)
-
ii)
Najarro et al. (2011) demonstrated that profile fits for stars with thin winds (such as O dwarfs in the LMC) do not require the inclusion of clumping, and so all models were computed under the assumption of homogeneous outflows. For stars with stronger winds, this might lead to overestimates of .
-
iii)
In model atmosphere computations, the microturbulent velocity affects the NLTE occupation numbers (and thus also the atmospheric structure), and the formal integral calculations (emergent profiles). To compute the grid, we assumed a depth-independent, microturbulent velocity of 10 km s-1 for the NLTE part555In the parameter range of (non-supergiant) O-type stars, a -value of the order of 10 km s-1 seems to be consistent with a variety of investigations (see e.g Repolust et al. 2004, Rivero González et al. 2012, Markova, Puls & Langer 2018, Massey et al. 2013)., and of 5, 7, 10, and 15 km s-1 for the formal integral, to cover the range of estimates derived for B stars in the LMC (see Fig. 5 and references therein).
-
iv)
Potential (micro-)turbulence pressure terms are not accounted for in the calculation of the photospheric structure. This might lead to underestimated surface gravities (by up to 0.1-0.15 dex, see e.g. Markova, Puls & Langer 2018).
| Parameter | Ranges and/or specific values |
|---|---|
| 36 to 16 kK, stepsize of 2 kK | |
| 4.2 to 2.0, stepsize of 0.2 dex | |
| 0.1, 0.15, 0.20 | |
| 7.0, 7.2, 7.4 | |
| 10 km s-1 (atmospheric structure) | |
| 5, 7, 10 and 15 km s-1 (formal integral) | |
| (a) | 14, 13.50, 13.15, 12.80, 12.45 |
| 0.9, 1.0, 1.1, 1.2, 1.3, 1.4, 1.5, 1.6, 2.0, 3.0 |
Notes. (a) Q is calculated following Puls et al. (1996) with in /yr, in and in km s-1 . (b) Different values used for different temperature regimes.
3.2 Spectral line diagnostics and fitting techniques
The FW grid includes 33 lines from H, He, and Si that could be used in a quantitative analysis (Table 3). However, given strong nebular contamination of many of the spectra, weak line transitions, and the limited wavelength coverage of the data, only 17 were available in our analysis (asterisks in Table 3).
| Balmer series | Helium | Silicon |
|---|---|---|
| Hα | He I 4026* | Si II 4128 |
| Hβ | He I 4388* | Si II 4130 |
| Hγ* | He I 4471* | Si II 5041 |
| Hδ* | He I 4713* | Si II 5056 |
| He I 4922* | Si III 4553* | |
| He I 6678* | Si III 4568* | |
| He II 4200* | Si III 4575* | |
| He II 4542* | Si III 4813 | |
| He II 4686* | Si III 4820 | |
| He II 6683 | Si III 4829 | |
| Si IV 4089* | ||
| Si IV 4116* | ||
| Si IV 4212* | ||
| Si IV 4631 | ||
| Si IV 4950 | ||
| Si IV 6668 | ||
| Si IV 6701 | ||
| Si IV 7048 | ||
| Si IV 8957 |
Notes. () Diagnostic lines used in the present analysis.
Spectral line fitting is an optimisation problem where one tries to maximise the correspondence between observed and synthetic profiles by minimising the differences between them. There are two ways to deal with this issue: one may either apply automated fitting techniques such as those used by Sabín-Sanjulián et al. (2014, 2017) and RA17, or use the classical ‘fit-by-eye’ approach where the quality of the fit is estimated by visual inspection of the strategic lines. We opted for the latter approach as our goal was an independent study of the selected objects compared to the results from RA17.
3.3 Determination of physical parameters
The stellar and wind properties of our targets were estimated as follows:
– Effective temperature ( ): This was estimated from the silicon (Si III/IV) ionisation balance, with helium (He I/II) used as a secondary check. The estimates from the two elements generally agreed to within 1000 K, which we adopted as the typical uncertainty, except for the fast rotators ( 150 km s-1 ) where a larger error of 1500 K was estimated. An error of 2000 K was adopted for three stars where we failed to obtain good fits to He II 4686 in parallel with the other lines (see below).
– Equatorial surface gravity ( ): The best gravity diagnostics available in the optical spectra of hot massive stars are the wings of Hδ and Hγ. These appeared to be free of nebular contamination in our sample, but in the late O-type regime they are also contaminated by absorption from weak metal lines. The effects of these metal lines need to be carefully accounted for (particularly at higher ) to obtain robust results (see Fig. 1). With this in mind, we checked each spectrum and found that, even at fast rotation rates, the redward Hδ wing and the blueward Hγ wing are unaffected by metal-line absorption. We therefore gave more weight to these regions when estimating . The typical error on ranges from 0.1 dex for objects with 150 km s-1 to 0.15 dex for those with 150 km s-1 .
– Stellar radius ( ): To estimate the Newtonian gravity, (i.e. the gravity corrected for centrifugal acceleration; see, e.g. Repolust et al. 2004), knowledge of the stellar radius is required. In principle, our approach allows this parameter to be estimated for each star, provided the de-reddened absolute magnitude in the -band is known or can be calculated using corresponding photometry and distances from the literature. The distance and -band magnitudes for our targets are known, but their visual extinction is uncertain in many cases (Maíz Apellániz et al. 2014). Therefore, to calculate the true gravity, we adopted the estimates from RA17 which were based on de-reddened absolute magnitudes in the K-band666These magnitudes have been calculated using observed K-band magnitudes from Rubele et al. (2012), a distance modulus to the Tarantula nebula of 18.5 mag from Evans et al. (2011) and an average K-band extinction of 0.21 mag from Maíz Apellániz et al. (2014). For our sample, these estimates range from 4 to 10 , in perfect agreement with the values expected for low-luminosity, unevolved O stars in the LMC (see Brott et al. 2011).
– Wind parameters: The main diagnostics of for O-type spectra in the optical are Hα and He II 4686, where the former can also be used to constrain . The Hα profiles were strongly contaminated by nebular emission for many of our sample stars. Therefore, for the purposes of the current analysis, we fixed 0.9 (the prototypical value for low-luminosity O-stars) and estimated from the best fit to He II 4686777As pointed out by Puls et al. (1996), the wind-strength parameter is derived directly from the spectroscopic analysis, while the actual can only be determined when and are known. Since is unknown for our targets, we consider in the present analysis.. The typical uncertainty on log , estimated from the quality of the fit to He II 4686 (the small influence of was neglected) ranges from 0.2 to 0.3 dex.
The estimated log values are listed in Col. 8 of Table 4, with only upper limits possible for 11 stars888This is mainly because He II 4686 (and also Hα) becomes insensitive to changes in below a certain value of .. We caution the reader that due to the dependence of on , these estimates are only valid for this specific value of . Three stars are flagged with an asterisk in Col. 1 of Table 4 as we were unable to obtain a good fit to He II 4686 in parallel with the other diagnostic lines in the spectrum: the He II 4686 lines appear asymmetric, weaker than predicted by the best models, and blueshifted compared to the corresponding . Interestingly, similar problems were reported by RA17 for their larger sample. The reasons for this are unclear, but might involve binarity or additional line emission of unknown origin. For these three stars we derived two estimates, representing upper and lower limits to log , the mean of which is given in Table 4.


| VFTS | Classification | Location | (1) | (2) | log | (3) | ||||
| (kK) | (cm s-2) | (cm s-2) | ( ) | (km/s) | (km/s) | |||||
| 346 | O9.7 III | NGC 2070 | 31.4 1.0 | 4.15 0.10 | 4.15 | 6.44 | 12.75 0.20 | 75 | 265 | 7.00 0.20 |
| 412 | O9.7 | NGC 2070 | 31.0 1.0 | 4.00 0.10 | 4.00 | 5.40 | 12.68 0.2 | 80 | 270 | 7.10 0.10 |
| 444 | O9.7 | NGC 2070 | 31.0 1.0 | 4.15 0.10 | 4.16 | 7.22 | 12.57 0.2 | 100 | 265 | 7.10 0.10 |
| 528 | O9.7(n) | NGC 2070 | 30.8 1.0 | 4.15 0.10 | 4.16 | 7.65 | 12.93 0.2 | 150 | 270 | 7.00 0.20 |
| 569 | O9.2 III: | NGC 2070 | 32.6 1.0 | 3.90 0.10 | 3.90 | 7.49 | 12.74 0.20 | 35 | 255 | 7.00 0.10 |
| 571* | O9.5 II-III(n) | NGC 2070 | 32.8 2.0 | 4.25 0.10 | 4.26 | 5.46 | ¡13.22 | 148 | 260 | 6.90 0.20 |
| 607 | O9.7 III | NGC 2070 | 32.0 1.0 | 4.10 0.10 | 4.10 | 5.97 | 12.64 0.20 | 60 | 265 | 7.00 0.15 |
| 615 | O9.5 IIInn | NGC 2070 | 32.0 1.5 | 4.00 0.15 | 4.08 | 10.30 | 12.87 0.20 | 372 | 270 | 7.00 0.20 |
| 620 | O9.7 III(n) | NGC 2070 | 32.0 1.5 | 4.10 0.15 | 4.15 | 4.82 | 13.15 0.20 | 208 | 275 | 7.00 0.20 |
| 622 | O9.7 III | NGC 2070 | 32.0 1.0 | 4.20 0.10 | 4.21 | 4.64 | 12.86 0.20 | 84 | 265 | 7.00 0.10 |
| 070 | O9.7 II | NGC 2060 | 32.0 1.0 | 4.00 0.10 | 4.01 | 5.64 | 13.35 0.15 | 126 | 277 | 7.00 0.20 |
| 077 | O9.5: IIIn | NGC 2060 | 34.0 1.5 | 4.20 0.15 | 4.24 | 5.20 | 13.50 | 225 | 275 | 7.10 0.30 |
| 080 | O9.7 II-III((n)) | NGC 2060 | 32.0 1.5 | 3.85 0.15 | 3.89 | 7.55 | 13.50 | 190 | 275 | 7.00 0.20 |
| 091 | O9.5 IIIn | NGC 2060 | 32.0 1.5 | 3.80 0.15 | 3.88 | 7.98 | 13.50 | 308 | 275 | 7.10 0.30 |
| 113 | O9.7 II/B0 IV? | NGC 2060 | 32.0 1.0 | 4.25 0.10 | 4.25 | 5.19 | 12.89 0.12 | 35 | 275 | 7.00 0.15 |
| 128 | O9.5 III:((n)) | NGC 2060 | 33.0 1.0 | 4.15 0.15 | 4.17 | 5.01 | 13.28 | 180 | 270 | 7.00 0.20 |
| 131 | O9.7 | NGC 2060 | 32.8 1.0 | 4.38 0.10 | 4.39 | 4.49 | 12.87 0.3 | 124 | 275 | 7.10 0.20 |
| 141 | O9.5 II-III((n)) | NGC 2060 | 32.3 1.0 | 4.20 0.15 | 4.21 | 8.44 | 12.87 0.20 | 160 | 275 | 7.00 0.20 |
| 188* | O9.7: III | NGC 2060 | 34.0 2.0 | 4.40 0.10 | 4.40 | 6.42 | 13.22 0.31 | 100 | 275 | 7.00 0.20 |
| 192* | O9.7 II/B0 IV | NGC 2060 | 31.7 2.0 | 4.13 0.10 | 4.13 | 4.85 | 13.05 0.17 | 40 | 270 | 7.10 0.20 |
| 205 | O9.7 II((n))/B0 IV((n)) | NGC 2060 | 31.0 1.0 | 4.30 0.15 | 4.31 | 6.29 | 13.50 | 158 | 265 | 6.90 0.20 |
| 207 | O9.7 II((n)) | NGC 2060 | 31.4 1.0 | 4.20 0.15 | 4.21 | 5.76 | 13.20 0.3 | 160 | 270 | 7.10 0.20 |
| 210 | O9.7 II-III((n)) | NGC 2060 | 32.0 1.0 | 4.00 0.15 | 4.02 | 6.47 | 12.78 0.2 | 162 | 275 | 7.10 0.10 |
| 104 | O9.7 II-III((n)) | Field | 32.0 1.5 | 4.10 0.15 | 4.14 | 5.10 | 13.50 0.30 | 198 | 260 | 7.00 0.20 |
| 226 | O9.7 III | Field | 33.0 1.0 | 4.20 0.10 | 4.20 | 5.31 | 13.50 0.3 | 64 | 190 | 7.10 0.10 |
| 328 | O9.5 III(n) | Field | 33.6 1.5 | 4.15 0.15 | 4.19 | 5.12 | 13.28 | 240 | 300 | 7.00 0.20 |
| 370 | O9.7 III | Field | 32.0 1.0 | 4.00 0.10 | 4.00 | 5.88 | 13.47 | 75 | 230 | 7.00 0.15 |
| 495 | O9.7 II-IIIn | Field | 32.0 1.5 | 4.20 0.15 | 4.22 | 6.44 | 13.50 0.2 | 218 | 270 | 7.00 0.20 |
| 574 | O9.5 IIIn | Field | 32.0 1.5 | 4.10 0.15 | 4.17 | 5.17 | 13.38 | 270 | 270 | 6.90 0.20 |
| 753 | O9.7 II-III | Field | 32.5 1.0 | 4.00 0.10 | 4.00 | 7.74 | 13.50 | 40 | 270 | 7.20 0.10 |
| 787+ | O9.7 III | Field | 32.8 1.0 | 4.35 0.10 | 4.35 | 5.77 | 12.76 0.2 | 40 | 275 | 7.00 0.20 |
| 843 | O9.5 IIIn | Field | 32.0 1.5 | 3.90 0.15 | 4.02 | 6.03 | 13.50 | 318 | 275 | 7.10 0.30 |
– Microturbulence ( ): The classical approach to estimating microturbulent velocities is to eliminate trends in the derived abundance versus equivalent width of lines from a given ion. For B-type stars the Si iii multiplet at 4560 Å has been repeatedly used for this purpose (see e.g. Dufton et al. 2005, Hunter et al. 2007, Fraser et al. 2010).
Unfortunately, for the temperature regime considered here, the Si III lines are weak and lie on or are close to the linear part of the curve of growth (i.e. their line strengths are relatively insensitive to changes in ). The generally low S/N ratio of our spectra (recalling that most were rated BBB in Table 1), combined with the relatively rapid rotation rates of our targets, further complicates the situation as it makes it difficult to robustly constrain from the line-profile fits. Indeed, Sabín-Sanjulián et al. (2014, 2017) noted that the distribution was degenerate in for many of their targets, and RA17 also found that the value for many of their stars was not significantly influenced by the specific values of , as long as it was below 30 km s-1 (Ramírez-Agudelo, priv. comm.).
With this in mind, we used our model grid to put initial constraints on the microturbulent velocity, in parallel to those on , , , and log. In particular, we found that models with = 5 km s-1 (in the formal integrals) most closely reproduced the profiles of strategic HHeSi lines in the spectra of our targets. To simplify the analysis and to reduce the computational effort, we did not attempt to improve the quality of the fit by iterating on this estimate, but adopted it as a final solution for all sample stars. This might influence the estimated chemical abundances (see Sect. 4.4) but we consider this approach as justified given the difficulties of actually deriving for stars at the cooler edge of the O star temperature regime.
– Helium abundance (): In the low-luminosity high-gravity O star regime, He I lines are almost insensitive to changes in , , and , and can therefore be used to estimate the helium abundance (provided is independently fixed, see above). However, this approach was not possible for some of our sample due to nebular contamination in some of the most important He I lines.
In contrast, the He II lines (4200, 4541) do not suffer from nebular contamination in our targets and are also insensitive to changes in and (see Fig. A.1. and Villamariz & Herrero 2000). Although the intensity of He II has a strong dependence on both and , these two parameters were derived independently from the Si ionisation balance and the wings of Hδ and Hγ. We therefore used the He II lines to investigate , with He I as an additional check where possible.
Good fits to He II 4200, 4541, in parallel to those to H and Si, were obtained for all stars using models with 0.1 0.02. When the He I lines were not influenced by nebular emission, they were also reproduced well by the models. As expected, when the He I profiles were contaminated, the models over-predicted the absorption intensities.
– Silicon abundance ( ): This was constrained from the best fit to selected Si lines. For late O-type stars, the Si IV lines are less sensitive to changes in compared to Si III (see Sect. 5), so we used these lines as the primary abundance diagnostic. We gave more weight to the Si IV 4116, 4212 transitions in the analysis because Si IV 4089 is blended with weak metal lines and is also sensitive to (see Fig. A.1). For stars with 100 km s-1 , an error of 0.1-0.15 dex was estimated from the best fit to the corresponding lines; for those with 100 km s-1 , a more conservative error of 0.2-0.3 dex was adopted to account for the larger uncertainty caused by the fast rotation. We remind the reader that these abundances (and also those for He) were estimated given our specific assumptions on , that is, = 10 km s-1 in the NLTE calculations and = 5 km s-1 for the formal integrals. As such, the derived abundances are only valid for these specific values, and we refer to Sect. 4.4.2 for further discussions on this issue.
– Projected rotational velocity and macroturbulence: The rotational properties of our targets were determined by Ramírez-Agudelo et al. (2013) and RA17 by two different methods: use of Fourier transforms (FT) to differentiate between the contributions from rotation and macroturbulent broadening, and direct comparison of observed and synthetic H and He profiles (where the effects of macroturbulence were neglected).
The quality of our spectra and the typically weak metal lines prohibit effective use of the FT approach. Therefore, we employed the second method to fix the rotational properties of our sample, adopting the estimates from RA17 as the initial input to compare between the observed spectra and our model profiles for selected H, He, and Si lines. The initial values were only modified (by more than 1) for four stars to improve the fits (VFTS 412, 569, 753, and 787), which we attribute to the different fitting approach here and the use of Si lines as an additional indicator of compared to RA17.
Comparing our estimates with those from the FT method by Ramírez-Agudelo et al. (2013) we do not see evidence of significant or systematic offsets that might indicate additional broadening from macroturbulence. This is consistent with similar findings for Galactic stars from Simón-Díaz et al. (2017) which indicate that low-luminosity, high-gravity O stars have maximum macroturbulent velocities below the detection threshold of the FT method (see, e.g. their Figs. 4 and 5).
– Radial velocities: Weighted means of the multi-epoch estimates from Sana et al. (2013) were used as a starting value to fit the selected HHeSi lines in the combined spectra of our targets. The majority of these values were adjusted (by less than 3) to optimise the fits. We attribute these differences to the different fitting approach and the use of Si lines as an additional indicator (cf. the original analysis by Sana et al. 2013).
4 Results from model atmosphere analysis
The main stellar and wind parameters are listed in Table 4, along with their corresponding errors derived as described above. The column entries are as follows: (1) VFTS identifier; (2) spectral classification from Walborn et al. (2014); (3-5) derived effective temperature and surface equatorial gravity (effective and Newtonian); (6) stellar radius from RA17; (7) wind strength Q-parameter from this study; (8) ; (9) , and (10) . A helium abundance of 0.1 0.02 was found for all objects.
In the following sections we use these results compared to those from RA17 to investigate four stellar parameters: , , , and .
4.1 Effective temperatures and equatorial surface gravities
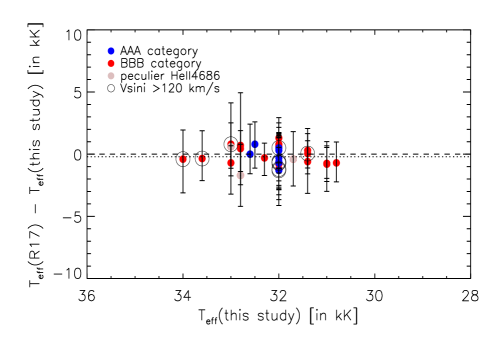
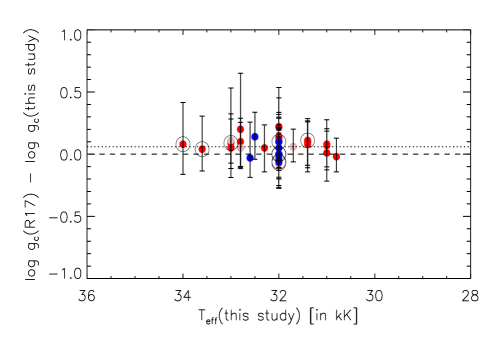
The differences between the current estimates of and (HHeSi FW models, by-eye fits) and those from RA17 (HHe FW models, automated GA fits) are shown in Fig. 2 (as a function of our estimates). There appears to be good agreement between the two sets of results (with differences within the individual uncertainties), with no obvious dependence on , data quality (AAA vs. BBB ratings), or rotational properties.
Weighted means of the differences (RA17 this study) are 0.14 0.31 kK and 0.06 0.04 dex. These are smaller than the typical errors in both studies (1 kK in and 0.1 dex in ), and are therefore statistically insignificant. The small differences probably reflect the different methods used to determine stellar temperatures (including the use of a single value for by RA17 in contrast to our two-value approach) and the weighting used here for the wings of the Balmer lines.
4.2 Helium abundances
As mentioned above, our analysis did not reveal evidence for a significant underabundance of He in the sample stars. Indeed, a good fit was obtained to the He lines for all targets (except for those contaminated by relatively strong nebular emission; see Sect. 3.3) using models with 0.1 0.02. This differs from RA17 who obtained ranging from 0.05 to 0.11.
In addition to the observational factors influencing the data (low S/N, nebular contamination, or continuum dilution via an unresolved companion or composite spectra), microturbulence might also contribute to the large spread in found by RA17. Indeed, as noted in Sect. 3.3, was relatively unconstrained in the RA17 analysis – if overestimated the model atmosphere fits might indicate lower than the true value.
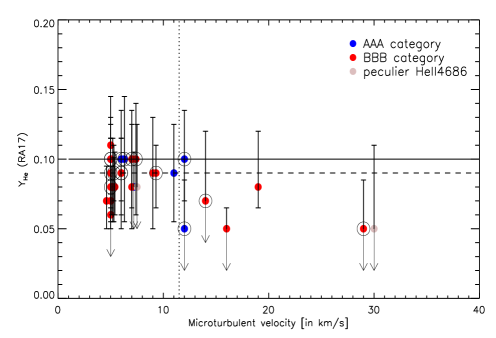
To investigate this further, the – results from RA17 for our targets are shown in Fig. 3 (in which the AAA- and BBB-rated stars and those with peculiar He II 4686 are indicated), revealing several important features:
-
i)
Within the typical error of 0.03-0.04, the helium abundances derived by RA17 agree with our mean value and the 0.09 adopted by Brott et al. (2011) for non-evolved main sequence stars in the LMC.
-
ii)
At 12 km s-1 , RA17 found 0.08 for all six stars (where all but one are upper limits). Such large values of would be unexpected for high-gravity, late O-type stars, suggesting that an overestimate of probably contributed to the low estimates from the HHe model GA fits.
-
iii)
At 12 km s-1 RA17 found a range of for similar values of . We interpret this spread as probably arising from the above observational factors (and noting that seven of the eight stars with 0.08 were BBB-rated).
-
iv)
Fast rotation (indicated by the additional large circles in Fig. 3) does not appear to play a decisive role in the low helium abundances from RA17.
4.3 Wind strength parameter
Our estimates of log spanned from 13.50 to 12.57 dex, comparable to the range of results from RA17 (13.84 log Q 12.54). The differences between the sets of results are smaller than the individual uncertainties, with no clear evidence for a significant systematic offset ( log 0.06 0.37 dex). The new results therefore support the log estimates from RA17, confirming that our targets possess weak stellar winds, typical for low-luminosity O-type dwarfs in 30 Dor (13.5 log Q 12.5 Sabín-Sanjulián et al. 2017).
4.4 Silicon abundances
Silicon abundances (and uncertainties) for our sample are shown in Fig. 4 and listed in Col. 11 of Table 4. The estimates range from 6.9 to 7.1, with only one star (VFTS 753) with 7.2. This spread is comparable to the typical error on our determinations and might therefore be important (see below). Averaging within each of the three spatial subgroups, we found weighted mean abundances of 7.03 0.04 for the stars in NGC 2070, 7.04 0.05 for those in NGC 2060, and 7.07 0.06 for those in the nearby field (where the quoted uncertainties are the errors on the means). The differences between these estimates are smaller than the corresponding errors and are thus insignificant. Comparing our estimates with that for the photospheric abundance of Si in the Sun (7.510.02 dex, see Asplund et al. 2009), we obtain a mean [Si/H] for our sample stars of 0.460.04.
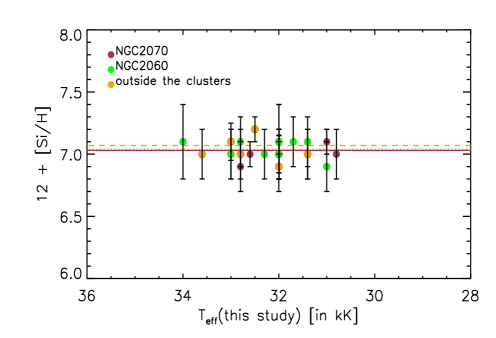
To our knowledge, these are the first Si abundances for O-type stars in the LMC and therefore we compare them with results for early B-type stars in LMC clusters from Korn et al. (2000, 2002, 2005), Trundle et al. (2007, hereafter T07), and Hunter et al. (2007, hereafter H07). The mean Si abundances from these studies are given in Col. 4 of Table 5. Compared to the H07 and T07 results, our (weighted) mean abundances are 0.2 dex lower, but agree well with those from Korn et al.
The series of papers by Korn et al. used the NLTE line formation codes detail and surface (Butler & Giddings 1985) in combination with plane-parallel, fully line-blanketed LTE Kurucz model atmospheres (atlas9, Kurucz 1993) and high-resolution spectroscopy to determine surface chemical abundances for limited samples of main sequence B stars in the young clusters NGC 1818 and NGC 2004.
The H07 and T07 studies employed optical spectroscopy from the FLAMES I survey (Evans et al. 2005, 2006) and the Queen’s University Belfast (QUB) grid of NLTE, plane-parallel, static (i.e. no wind) models calculated with tlusty and synspec (Ryans et al. 2003; Dufton et al. 2005). These latter studies investigated the surface chemical abundances of main sequence B-stars in the young star-forming region N11 (H07) and also in NGC 2004 (T07). We add that the same QUB tlusty grid (and similar methods to H07 and T07) was also used by McEvoy et al. (2015) and Dufton et al. (2018, hereafter D18) to estimate the properties of a large sample of B-type stars from the VFTS, although we note that in these studies the Si abundances were fixed at the value derived by H07 and the Si III triplet (4553, 4568, 4575) was then used to estimate the microturbulence.
| Cluster/Region | Spectral type | Models | Mean (a) | (cm s-2) | Comments |
| NGC 2070 | Late O | fastwind HHeSi | 7.03 0.04 (10) | 3.8-4.4 | This study |
| NGC 2060 | Late O | fastwind HHeSi | 7.04 0.05 (13) | 3.8-4.4 | This study |
| 30 Dor field | Late O | fastwind HHeSi | 7.07 0.06 (9) | 3.8-4.4 | This study |
| N11 | Early to mid B | tlusty/synspec | 7.19 0.07 (30) | 2.1-4.2 | Hunter et al. (2007) |
| NGC 2004 | Early to mid B | tlusty/synspec | 7.21 0.03 (23) | 1.9-4.15 | Trundle et al. (2007) |
| NGC 2004 | Early B | atlas9/detail/surface | 7.00 0.16 (6)(b) | 3.1-4.35 | Korn et al. (2000, 2002) |
| NGC 1818 | Early B | atlas9/detail/surface | 7.03 0.12 (2)(b) | 2.8-4.0 | Korn et al. (2000, 2002) |
| NGC 2004 | Early B(c) | atlas9/detail/surface | 7.07 0.06 (3) | 3.7-4.05 | Korn et al. (2005) |
There are several reasons that might contribute to explain the systematic offset between the silicon abundance estimates obtained here and those from H07 and T07, the most important being different methodologies and/or atomic data (particularly for Si), the effects of microturbulence, and real differences between the studied objects.
4.4.1 Comparison of FASTWIND and TLUSTY results
McEvoy et al. (2015) compared the physical parameters estimated for ten early B-type supergiants and two O9.7 supergiants using the QUB tlusty grid and HHe FW models. The results for , , and nitrogen abundances were generally in good agreement between the two methods (see their Table 6), as also found for two B supergiants in the Small Magellanic Cloud by Dufton et al. (2005).
As a first comparison of results from the different codes for the stars with unexpected gravities, RA17 compared their results from FW with preliminary estimates from the QUB tlusty grid for six of the O9.7-type giants/bright giants in the current sample (VFTS 113, 192, 226, 607, 753, and 787). The FW results showed that these latter objects were typically slightly hotter, with a mean temperature difference of nearly 2 000 K.
Briefly, the two codes and analysis methods broadly lead to consistent results, although small systematic differences in and cannot be excluded. To investigate this further we analysed three of the early B-type dwarfs (VFTS 119, 313, 623) from D18 with the new HHeSi FW models. Provided for the formal integrals agrees to within 1 km s-1 , the two methods give estimates of and that agree within the respective uncertainties, although FW again leads to slightly hotter temperatures ( [FW tlusty] 0.50 0.87 kK) and marginally larger gravities ( [FW tlusty] 0.03 0.03 dex). Interestingly, the FW analysis also resulted in lower estimates of than those from Dufton et al., where [FW tlusty] 0.11 0.03.
While differences in the atomic data/models for Si cannot be excluded as the cause, we suggest that differences in the microturbulent velocity may contribute to the small offset between the FW and tlusty solutions for , and for late O- and early B-type stars in the LMC.
Indeed, as outlined in Sect. 3.3, for computational reasons we adopted microturbulent velocities of 10 and 5 km s-1 in the NLTE and formal integral calculations, respectively, for the analysis of our sample. In contrast, the studies of B-type stars by H07, T07, McEvoy et al. (2015), and D18 adopted one single value for this quantity, where it was estimated from a comparison with observations via two methods: the classical approach based on curve-of-growth analysis of the Si III triplet ( 4553, 4568, 4675), and an alternative approach where was adjusted for each target so that the derived was consistent with the corresponding derived (H07, T07) or adopted (McEvoy et al. 2015; Dufton et al. 2018) cluster average.
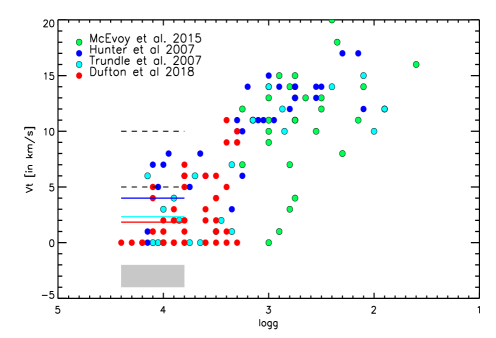
The estimates from the second approach are shown in Fig. 5 as a function of . Typical uncertainties are 0.1 dex and 3-5 km s-1 . As already noted in previous studies (e.g. Daflon, Cunha & Butler 2004, H07, Mokiem et al. 2007), for low-gravity stars ( 3.2 dex) there is a clear trend of increasing with decreasing gravity. For the high-gravity stars ( 3.8 dex) there is little evidence of a correlation.
To compare the microturbulent velocities adopted in the present study with the estimates in Fig. 5, we calculated mean values from the published samples, including only those stars with gravities that span the same range as our targets (indicated by the grey rectangle). These means are indicated in the figure using horizontal solid lines and the same colours as in the legend: H07 (dark blue), 4.0 3.6 km s-1 (7 stars); T07 (cyan), 2.3 2.1 km s-1 (6 stars); Dufton et al. (2018, red), 1.9 2.3 km s-1 (34 stars).
Our adopted values of 10 and 5 km s-1 (indicated by the dashed horizontal lines in Fig. 5) are, in part, significantly larger than the corresponding results from H07, T07, and D18. With all other parameters fixed, higher values of would be expected to yield lower Si abundances, suggesting that differences in the microturbulent velocities adopted for the NLTE and the formal integral calculations might contribute to the small offset between the FW and tlusty solutions for , , and for late O and early B-stars in the LMC (see following section).
4.4.2 Effect of microturbulence on Si line diagnostics: Theoretical considerations
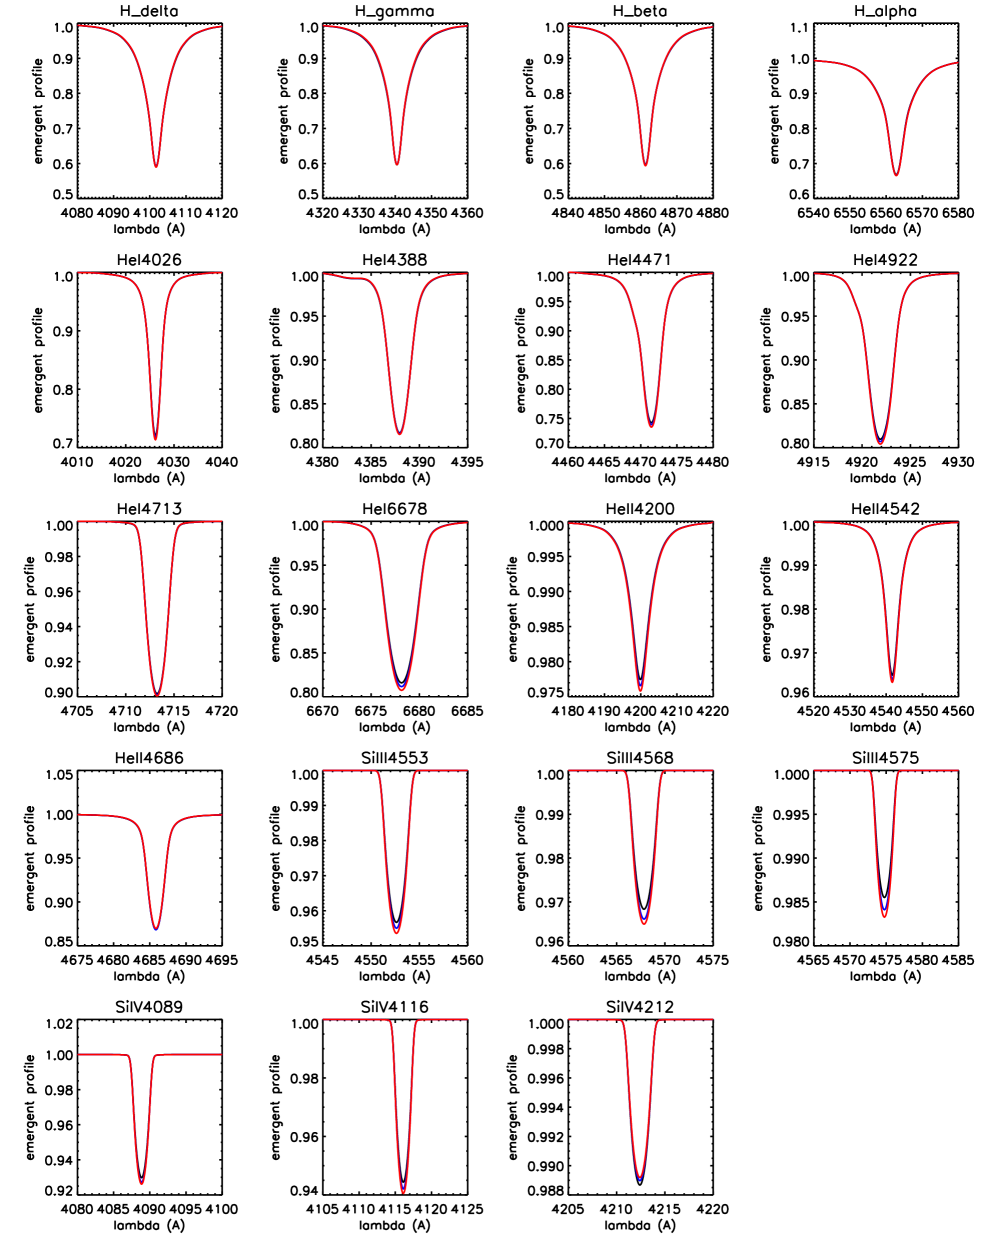
The effect of microturbulence on the line formation calculations of H and He lines in the optical spectra of O and early-B stars of solar metallicity was explored in detail by Smith & Howarth (1998) using the tlusty/surface codes, and by Villamariz & Herrero (2000) and Lyubimkov, Rostopchin & Lambert (2000) using the detail/surface codes. The main outcome of these analyses was that only the He I and He II 4686 lines are affected by changes in this parameter (both in the NLTE and the formal integral), and that the impact of these changes on the derivation of , , and is small or comparable to the adopted uncertainties.
To investigate the effect of microturbulence on the Si lines used in the present study (see Table 3), we used models with typical parameters for our targets: 32 kK, 4.1 dex, 0.1, =7.0 dex, and log 13.5. In order to disentangle the relative influence of changes in the NLTE occupation numbers and the formal integral, two sets of computations were carried out: in the first set, the value of used in the NLTE calculations, that is, (NLTE), was varied while that for the formal integral was fixed at 5 km s-1 (see Sect. 3.3); in the second set, for the formal integral was varied whilst that for the NLTE computations was fixed at 10 km s-1 , as adopted by us throughout our analysis of the current sample (see Sect. 3.1).
Results from the first set of computations are illustrated in Fig. 9 which compares selected HHeSi lines calculated with (NLTE) = 5, 10, and 15 km s-1 . By visual inspection of the profiles, only the Si III lines are significantly sensitive to changes in this quantity (11 to 17% increase in EWs when increasing (NLTE) from 5 to 15 km s-1 ). In contrast, the Balmer lines are not affected, and the He and Si IV lines are only marginally affected (with typical increases in EW of for He and between 6 and 7% for Si IV).
The impact of these changes on the outcome of our analysis is minimal, and in particular smaller than the typical uncertainties. Specifically, a decrease from 10 km s-1 (present study) to 5 km s-1 ( a value similar to used by H07 to analyse B-type dwarfs, see Fig. 5) leads to effective temperatures that are 300 K cooler, logarithmic gravities that are 0.03 dex lower, and Si abundances that are 0.05 dex larger. These predictions are qualitatively consistent with the differences between the FW and tlusty analyses of common stars (see previous section), supporting our suggestion that the value adopted in the NLTE calculation can affect the outcome of model-atmosphere analyses when using the Si lines as diagnostics of , , and . Similar calculations using cmfgen (Hillier & Miller 1998) have shown that the formation of specific infrared lines in O-type stars with very thin winds, namely Brα and Pfγ, is also sensitive to the value of adopted for the model-atmosphere calculations (Najarro et al. 2011).
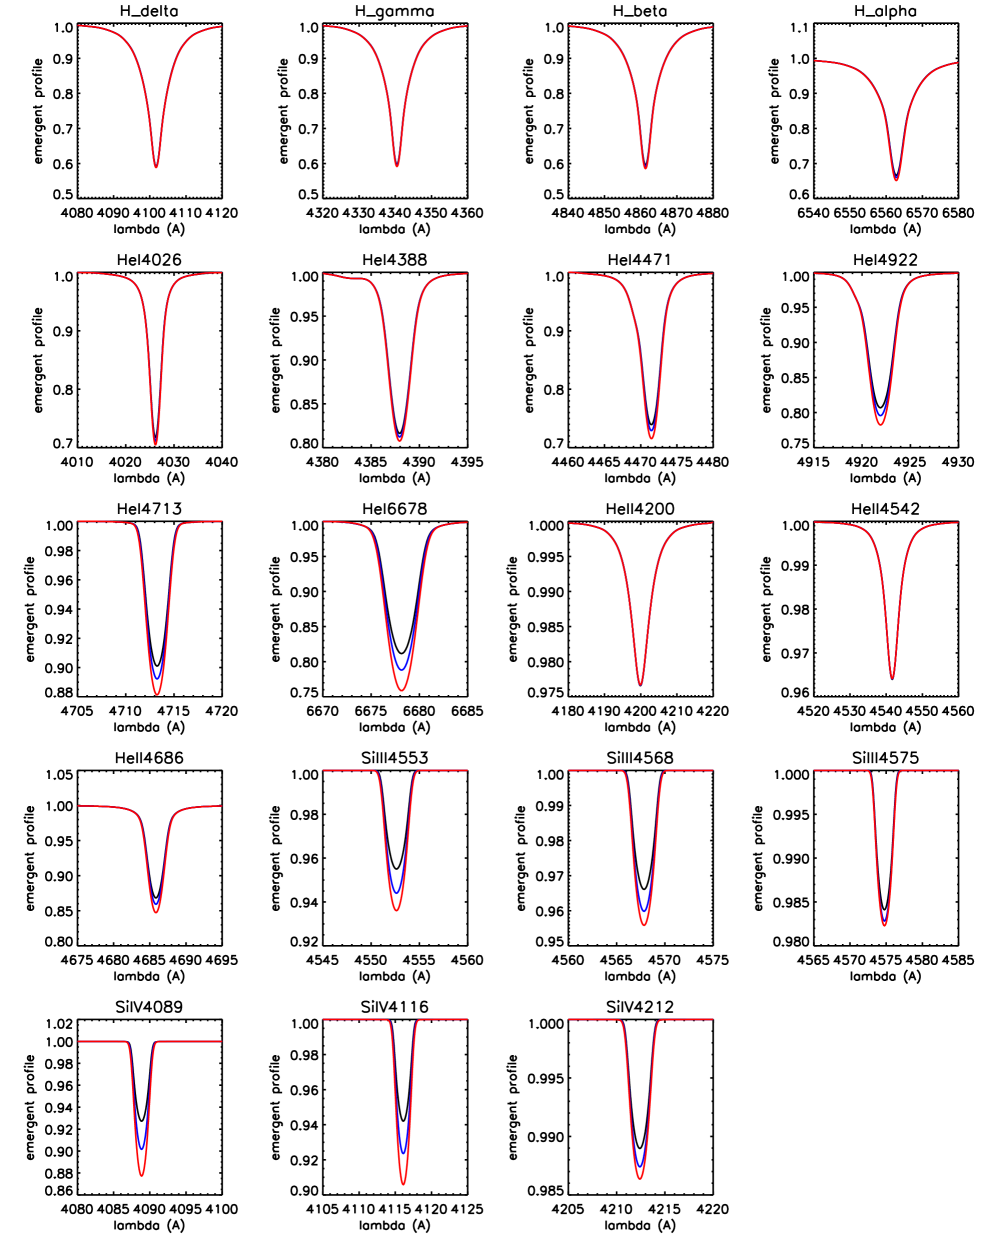
The effect of microturbulence on the emergent HHeSi profiles is visualised in Fig. 10, where line profiles computed with different values in the formal integral (5, 10, and 15 km s-1 ) are compared. From these synthetic spectra, one can see that Si lines are most sensitive to changes in this quantity, with Si IV being more affected than Si III (with typical EW variations of 18-68% for the former, and 7-34% for the latter). For the He lines, the situation is more complex, with the He I lines showing modest variations, with a typical EW increase between a few and 26% (when varying (formal) between 5 and 15 km s-1 ). The He II lines at 4200, 4542 are almost insensitive, while the Pickering line 4686 exhibits a 13% increase in EW. An interesting point to be noted here is that, as in the case established for early B-type stars (see Lyubimkov, Rostopchin & Lambert 2000), He I 6678 Å is most strongly affected by changes in (formal). Therefore, also in the low-luminosity high-gravity O star regime, this line cannot serve as a reliable diagnostic to determine stellar properties.
Further test calculations showed that a decrease in (formal) from 5 km s-1 (present study) to 3 km s-1 (the average value used to analyse B-type dwarfs by H07, T07, and Dufton et al. 2018, see Fig 5) leads to an increase in by 0.10 dex ( and are not affected). Using the same version of the FW code, Rivero González et al. (2012) estimated that for O stars in the LMC, a 5 km s-1 decrease in for the formal integral leads to a 0.05-0.07 dex increase in nitrogen abundances.
In summary, for the Balmer and He lines the FW predictions outlined above are in good qualitative agreement with similar findings from Smith & Howarth (1998), Villamariz & Herrero (2000), and Lyubimkov, Rostopchin & Lambert (2000); see also Martins, Schaerer, & Hillier (2002). For Si, our studies and predictions have, for the first time, revealed that in the low-luminosity, high-gravity O star regime, Si III is more sensitive to changes in (NLTE) than Si IV, whereas the opposite effect (i.e. Si IV more strongly affected than Si III) is found when (formal) is changed. With regard to the microturbulent velocities used in our analysis (see Sect. 3.3), variations of 5 km s-1 for the NLTE and of 2 km s-1 for the formal integral calculations have no significant consequences for the derivation of and . In contrast, is expected to be significantly modified, with variations of 0.05 dex for (NLTE) 5 km s-1 and by 0.10 dex for (formal) 2 km s-1 .
The main implication of these theoretical considerations is that the reconciliation of the estimates derived for low-luminosity late O-type dwarfs (present study) with those derived for early-B stars (H07, T07) would require the atmospheres of the former to be (almost) free of microturbulent motions, at least in the line-forming region of Si ( 5 km s-1 for both the NLTE and the formal integral calculations). However, such low values are not typical for O-stars in the Galaxy (e.g. Martins et al. 2012, 2015, Mahy et al. 2015, Markova, Puls & Langer 2018) or the Magellanic Clouds (see e.g. Bouret et al. 2013, Massey et al. 2009, 2013, Shenar et al. 2015, 2016, Ramachandran et al. 2018).
Therefore, we conclude that while different assumptions in corresponding FW and tlusty analyses (particularly the microturbulent velocities used in the NLTE and the formal integral calculations) can contribute, it is unlikely that they alone can explain the differences in the estimated Si abundances from H07 and T07 compared to our results.
4.4.3 Revisting the low Si abundances for some LMC stars.
Large spreads in individual Si abundances ( of up to 0.5-0.6 dex) were reported by H07, T07, and D18 when following the classical approach to determine for the formal integral. These spreads were significantly reduced using the alternative approach (adjusting this value to obtain values that are consistent with the corresponding cluster average; see Sect. 4.4.1) to determine . But even this approach failed for a non-negligible number of objects (generally dwarfs in NGC 2060 and NGC 2070) since the maximum possible Si abundance (for 0 km s-1 ) turned out to be smaller than the corresponding cluster averages of 7.2 dex, by 0.2-0.3 dex.
Following a similar approach, McEvoy et al. (2015) found 10 km s-1 for a number of their targets (see Fig. 5). This is unexpectedly low for B-type supergiants, and in some cases deviates by more than 3 from the apparent – trend. If these values were increased to the values expected for their gravities, these would also lead to further B stars with 7.2 dex located in NGC 2060 and NGC 2070.
If not due to limitations in the method and/or models, the above discussion suggests that B stars with as low as 6.9–7.0 dex are present in the LMC, especially in the NGC 2060 and NGC 2070 clusters in 30 Dor. As for the late O-dwarfs in those clusters, a mean 7.05 0.03 was also derived in the present study, leading us to speculate that the clusters in 30 Dor might be somewhat more metal (or at least Si) deficient compared to N 11 and NGC 2004.
The existence of a large spread in metallicity in the younger stellar populations of the LMC is well known (see e.g. Piatti et al. 2019 and references therein), but a careful reanalysis of the larger samples of late-O and early-B stars observed in the VFTS and FLAMES I survey is required to more critically investigate the possibility of such differences in metal enrichment.
5 Spectral classification for late O-type stars
From the above results it seems clear that our targets have physical properties (particularly , , and log ) similar to those typical for O-type dwarfs in the LMC. With this in mind, we further investigated the second hypothesis proposed in Sect. 1, namely that intricacies in spectral classification might be responsible for the unexpected results from atmospheric analysis of our targets with respect to their morphological types.
5.1 Classification of the VFTS sample
A new atlas for spectral classification of Galactic O-type spectra was presented by Sota et al. (2011), including updated spectral standards. Among other refinements, the late-O/early-B spectral types were redefined, including the introduction of the O9.7 spectral type at lower luminosity classes (V through to III); previously, it had been defined only for classes I and II (see Table 6). The adopted principal luminosity criterion for late O-types was the ratio of He II 4686/He I 4713 (see Table 7), which is expected to decrease with increasing luminosity due to infilling of He II 4686 by emission. This contrasts with earlier studies that used the Si IV 4089/He I 4026 ratio as the primary diagnostic (e.g. Walborn & Fitzpatrick 1990).
| Spectral | He II/He I(a) | Si III/He II(b) |
|---|---|---|
| Type | 4542/4388 | 4553/4542 |
| 4200/4144 | ||
| O8.5 | N/A | |
| O9 | ||
| O9.5 | ||
| O9.7 | to | |
| B0 |
Notes. (a) primary criterion; (b) secondary criterion.
| Lum. | He II/He I(a) | Si IV/He I(b) |
|---|---|---|
| Class | 4686/4713 | 4089/4026 |
| Ia | 0 | N/A |
| Iab | to | to |
| Ib | ||
| II | ||
| III | to | |
| V |
Extending these criteria to lower-metallicity environments such as the LMC is not trivial. In addition to the Si lines weakening, the strengths of the He lines are also expected to depend on the metal content (see Markova et al. 2009). To account for this Walborn et al. (2014) classified each VFTS spectrum as if it were a Galactic star using the criteria in Tables 6 and 7, while also paying attention to differences between the estimated absolute visual magnitudes and those expected given the classification121212Larger than expected luminosities could also arise from binarity as well as anomalous classifications. Although our sample is made up of single stars to the best of our current knowledge, an inability to obtain satisfactory fits for the selected H, He, and Si lines with a single set of parameters might indicate previously undetected binaries and/or composite spectra..
In general this was successful but there were a number of stars with a notable discrepancy, and which ultimately led to the sample in the current study. The He II 4686/He I 4713 ratio in the spectra of these stars suggested a giant or bright giant luminosity class, but their Si IV 4089 lines were too weak for a giant and were more appropriate for a dwarf (generally noted as ‘Si weak’ by Walborn et al.).
As noted earlier, the quality of the spectra may be an issue131313Stars flagged as Si weak by Walborn et al. (2014) comprised about 7% of the AAA-rated O stars from the VFTS, and 18% of the BBB-rated spectra. For the subsample analysed here, the corresponding fractions are 12% and 88%, respectively., but Walborn et al. (2014) also suggested that the metallicity dependence of the Si III 4553/He II 4542 ratio for late O types, as well as the rapid decline of the luminosity-dependent infilling of He II 4686 with advancing type (such that He II 4686/He I 4713 has similar values near unity at O9.7 II and B0 IV), might also contribute. Interestingly, Sota et al. (2011) noticed a similar problem for some of their Galatic objects and tentatively attributed it to unresolved binarity.
To maximise the usefulness of morphological classifications of hot massive stars, it is vital that we understand how they are influenced by physical properties. Spectral type most closely follows the stellar temperature, while luminosity class is more influenced by gravity (or, if is known, luminosity over the stellar mass). With this in mind we used the new HHeSi FW grids to investigate the sensitivity of six of the diagnostic lines used in classification of late O-type stars to changes in key stellar properties. In particular, we measured the relative intensity at the core of each line and followed its variation as a function of , , and log . The synthetic profiles were degraded to a resolving power () of 4 000, as used to classify the VFTS targets, and convolved with a rotational broadening profile corresponding to 100 km s-1 . Thus, the discussion below is strictly valid for these specific values of and (for more information see Markova et al. 2011) and for microturbulent velocities as discussed in Sect. 3.3. Models with 7.0 and 7.2 dex were considered.
5.2 Predicted behaviour of luminosity criteria
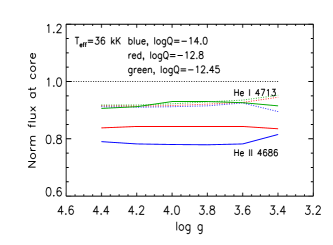
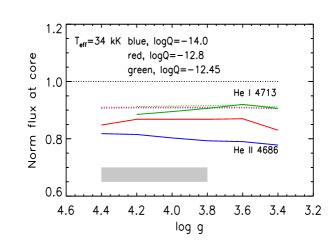
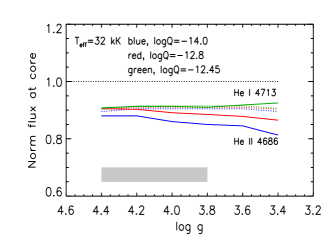
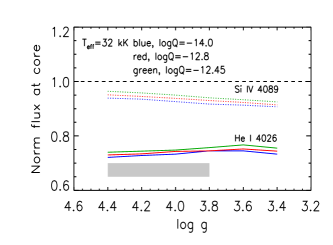
Intensity predictions from the FW models for the line pairs used as luminosity criteria in late O-type stars are shown in Fig. 6. Over the parameter space of the models, the upper panels show that the depth of He I 4713 does not react strongly to changes in , , and log , while the intensity of He II 4686 is strongly sensitive to variations in these parameters. In particular, at 36 kK (upper-left panel) the intensity of He II 4686 is (almost) exclusively sensitive to the wind strength, as suggested by Sota et al. (2011); the stronger the wind, the weaker the line. For these hotter temperatures and for the values typical for unevolved O-stars (marked by the grey rectangle), the ratio of He II 4686 to He I 4713 is predicted to decrease monotonically from 2.8 for log 14.0 to 2.1 for log 12.8, and to about unity for log 12.45, suggesting luminosity classes of V, III, and II, respectively 141414As the criteria listed in Tables 6 and 7 are qualitative but not quantitative, we performed a direct comparison to the standard stars from Sota et al. (2011) to connect the FW predictions with the corresponding spectral type or luminosity class..
For 36 kK (middle and right-hand panels of Fig. 6), in addition to the wind density the central depth of He II 4686 is also sensitive to changes in and , with the line weakening at cooler temperatures. At 34 kK, the He II 4686/He I 4713 intensity ratio is still controlled by emission filling in the He II line and, as for the 36 kK models, it can discriminate between luminosity class II (log 12.45), III (log 12.85), and V (log 14.0). In the latter case, due to the effects of gravity, a luminosity classification of III or IV (instead of V) is suggested for 4.2 4.4 dex. Different behaviour is seen for 34 kK, where the depth of the He II 4686 line can be equal to or slightly deeper than that of He I 4713, implying a luminosity classification of II or III for all models, irrespective of their wind strength or equatorial surface gravity. Interestingly, Martins (2018) also warned that the He II 4686/He I 4713 ratio is basically the same for V, IV, and III luminosity classes in his sample of late O-type (O9-O9.7) Galactic stars.
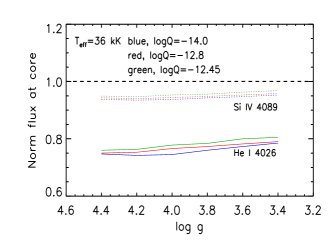
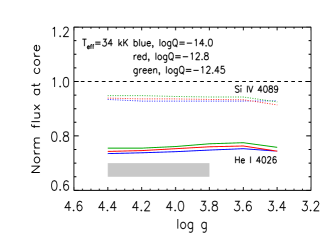
The lower panels of Fig. 6 show results for a similar comparison of the predicted intensities for the lines in the secondary luminosity diagnostic (i.e. the intensity ratio of Si IV 4089 to He I 4026). The central depths of both lines are insensitive to changes in and log (with variations of 3%), but are (weakly) sensitive to gravity. In the models with 32 kK the Si IV 4089/He I 4026 ratio decreases monotonically with gravity, suggesting a luminosity class of IV or V for values comparable to those of our targets (and class III for 3.4-3.6 dex).
Two consequences of the above results at the cool edge of the O-type temperature regime ( 34 kK) are as follows:
-
i)
Use of the He II 4686/He I 4713 criterion can lead to a lack of class IV/V objects with 34 kK, and the appearance of stars classified as class II/III stars but that have equatorial surface gravities that are typical for dwarfs (class V). For many of the latter, the so-called ‘Si IV weak’ phenomenon can emerge.
-
ii)
At least for metallicity of the LMC, the intensity ratio of Si IV 4089/He I 4026 appears to provide more reliable luminosity classes (in the sense that the gravity of the star is traced more reliably when combined with other information such as estimated absolute luminosities) compared to those originating from the He II 4686/He I 4713 ratio.
5.3 Predicted behaviour of spectral type criteria
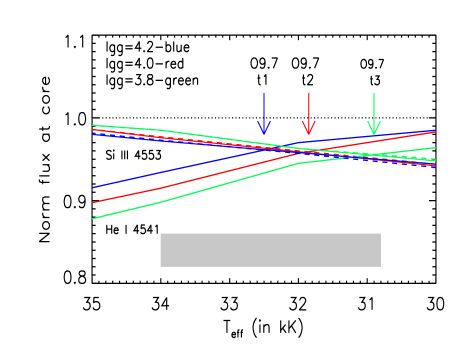
The predicted behaviour of the lines involved in the Si III 4553/He II 4542 ratio, the classical spectral type diagnostic in the late O star regime (see Table 6), is shown in Fig. 7 as a function of and . Evidently, over the parameter space covered by our sample, both lines are strongly temperature dependent – the central intensity of Si III 4553 strengthens towards cooler with the opposite trend for the He II 4542 line. Additionally, they are both sensitive to changes in gravity where the variability patters are again of an opposite nature to each other with Si III 4553 being less responsive than He II 4542.
The main implication of these predictions is that for different ( , ) pairs, the same Si III 4553/He II 4542 ratio can be observed. For example, and as indicated in Fig. 7, this ratio is equal to unity at: 32.5 kK for 4.2 dex, 31.85 kK for 4.0 dex, and 30.9 kK for 3.8 dex. These temperatures fall within the range of values derived for our sample (grey area in Fig. 7), so we conclude that the classification of our targets as O9.5–O9.7 stars is compatible with their estimated and values. Indeed, the – results for our sample (Fig. 8) are in better agreement with those reported for other late O-type stars than with those found for early B-type stars. Their temperatures are in the range of those derived for late O-type dwarfs in the LMC by Rivero González et al. (2012) and Sabín-Sanjulián et al. (2017), in contrast to the cooler temperatures (and generally lower gravities) obtained for early B-type (B0-B2) dwarfs from H07 and D18. Thus, it appears that, at least for our sample, the morphological criteria used to assign spectral type (Table 6) have not led to spurious results due to the lower metallicity of the LMC.
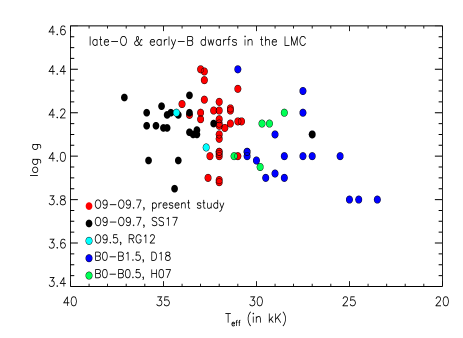
From Fig. 8 we also comment that our targets have comparable gravities but are actually slightly cooler than the results from Sabín-Sanjulián et al. (2017), with a maximum difference of 2 to 3 kK for the latest-type spectra (O9.7). Given that the same version of FW was used in both analyses, we tentatively attribute these differences to the adopted diagnostic lines (HHe vs. HHeSi) and fitting techniques (iacob-gbat vs. by-eye fits). Lastly, we note that the outcome of the predictions summarised above do not change significantly if considering FW models with 7.2 dex instead of 7.0 dex.
6 Summary
Our motivation was to understand the properties of 32 late O-type stars from the VFTS that were classified as giants or bright giants by Walborn et al. (2014), but for which the model-atmosphere analysis of RA17 found gravities that were more consistent with dwarf (or subdwarf) stars. For many stars in the sample there was also a morphological discrepancy between the He II 4686/He I 4713 and the Si IV 4089/He I 4026 line ratios used to assign luminosity classes (with respect to Galactic standards), which had led Walborn et al. to flag them as Si weak.
Our analysis employed new HHeSi fastwind models and a by-eye fitting approach to revisit the physical properties of this intriguing subset of late O-type stars. Our main conclusions can be summarised as follows:
-
•
Our estimated physical parameters for the 32 stars are in good agreement with those from RA17 (aside from the He content). These results support the suggestion that these should be considered as low-luminosity, late O-type dwarfs (or subgiants) rather than giants or bright giants, as classified from their spectral morphology (i.e., using Galactic standards).
-
•
A reasonable fit to the helium lines was obtained for all stars using models with 0.10 0.02 (and taking into account nebular contamination of He I where relevant). This differs from RA17 where 0.08 was derived for 22% of the sample (seven stars). Differences in the adopted microturbulent velocities used in both studies as well as weak or residual nebular contamination in the He I lines (which might not have been fully taken into account during the automated fitting) may explain the previous estimates (see Sect. 4.2).
-
•
Silicon abundances estimated for our sample range from 6.9 to 7.2 dex, with weighted means of 7.03 0.04 (NGC 2070), 7.04 0.05 (NGC 2060) and 7.07 0.06 dex (local field). These estimates are 0.1–0.2 dex lower than those from tlusty for B-type stars in two other clusters in the LMC, namely N 11 (H07) and NGC 2004 (T07). Aside from potential differences in atomic data and/or models, other contributing factors could be the different assumptions in the corresponding FW and tlusty analyses, particularly regarding the microturbulent velocities (see Sects. 4.4.1 and 4.4.2), and/or real differences between the OB stars located in NGC 2060 and NGC 2070 in the 30 Dor region, and those in N 11 and NGC 2004 (see Sect. 4.4.3).
Prompted by these new results, we also investigated the predicted behaviour of the spectral lines used to classify late O-type stars (Tables 6 and 7), which resulted in the following findings.
-
•
At 34 kK the strong dependence of the He II 4686 line on and (in addition to log ) can lead to a He II 4686/He I 4713 ratio for a late O-star in the LMC that mimics a luminosity class of II or III, even for stars with high gravities and weak winds. Similar investigation of the Si IV 4089/He I 4026 ratio showed that it suggests luminosity class V for our targets, in better agreement with their physical properties from the model-atmosphere analysis.
-
•
The temperatures derived from our analysis are consistent with the expected values for stars classified as O9.5-O9.7. Additionally, their – distribution agrees with that of B-dwarfs (observed by both the VFTS and the FLAMES I survey), in the sense that they constitute a sequence of objects with monotonically increasing temperatures and gravities. This indicates that the Si III 4553/He II 4542 ratio used to assign spectral type in Galactic stars can also provide reliable results for late O-type stars in the LMC (see Sect. 5.3).
These tests of the spectral diagnostics have provided insights into several puzzling issues revealed within the VFTS, namely: i) the deficit of O-type dwarfs with 33 kK (Sabín-Sanjulián et al. 2017); ii) the appearance of late O-type giants or bright giants with surface gravities more typical of dwarfs (Ramírez-Agudelo et al. 2017), and iii) the discrepancy between the primary and the secondary luminosity diagnostics for the O9–O9.7 subtypes, leading to the ‘Si weak’ stars from Walborn et al. (2014).
Finally, although significantly improved, the classification scheme proposed by Sota et al. (2011) is still qualitative and is therefore prone to various complications. In particular, classification of new stars requires a direct comparison with standards in order to assess the strength of specific lines and line ratios used as diagnostics of spectral type and luminosity class. However, there are a number of processes (e.g. mass loss, stellar rotation, microturbulence, metallicity, and spectral resolving power) that can affect the strength of those lines and line ratios (see e.g. Markova et al. 2009, 2011), which can make classification of new stars difficult (even in the Galaxy). To circumvent such complications, Martins (2018) recently quantified several classification criteria based on archival spectra for 105 O-type Galactic stars. A similar study for O stars in the LMC would be highly valuable, and will be the subject of a future study using the VFTS spectra.
Acknowledgements.
Based on observations at the European Southern Observatory Very Large Telescope in programme 182.D-0222. NM acknowledges financial support from the Bulgarian NSF (grant numbers DN08/1/13.12.2016 and DN 18/13/12.12.2017).References
- Almeida et al. (2017) Almeida, L. A., Sana, H., Taylor, W. et al. 2017, A&A 598, 84.
- Asplund et al. (2009) Asplund, M., Grevesse, N., Sauval, A. J. & Scott, P. 2009, ARA&A, 47, 481
- Bestenlehner et al. (2011) Bestenlehner, J. M., Vink, J. S., Gräfener, G. et al. 2011, A&A, 530, 14
- Brott et al. (2011) Brott, I., de Mink, S. E., Cantiello, M., et al. 2011, A&A, 530, 115
- Bouret et al. (2013) Bouret, G.-C., Lanz, T., Martins, F. et al. 2013 ApJ 595, 1182
- Butler & Giddings (1985) Butler, K. & Giddings, J. R. 1985, CCP7 Newsletter 9, 7
- Cantiello et al. (2009) Cantiello, M., Langer, N., Brott, I. et al. A&A 499, 279
- Charbonneau (1995) Charbonneau, P. 1995, ApJS, 101, 309
- Crowther et al. (2002) Crowther, P. A., Hillier, D. J., Evans, C. J. et al. 2002, ApJ, 579, 774
- Crowther et al. (2010) Crowther, P. A, Schnurr, O., Hirschi, R. et al. 2010, MNRAS, 408,731
- Daflon, Cunha & Butler (2004) Daflon, S., Cunha, K. & Butler, K. 2004, ApJ, 604, 362
- Dufton et al. (2005) Dufton, P. L., Ryans, R. S. I., Trundle, C., et al., 2005, A&A, 434, 1125
- Dufton et al. (2018) Dufton, P. L., Thompson, A., Crowther, P. A. et al. 2018, A&A, 615, 101 [D18]
- Fraser et al. (2010) Fraser, M., Dufton, P. L., Hunter, I., & Ryans, R. S. I. 2010, MNRAS, 404, 1306
- Evans et al. (2005) Evans, C. J., Smartt, S. J., Lee, J.-K. et al., 2005 A&A 437, 467
- Evans et al. (2006) Evans, C. J., Lennon, D. J., Smartt, S. J. & Trundle, C, 2006, A&A, 456, 623
- Evans et al. (2011) Evans, C. J., Taylor, W. D., Hénault-Brunet, V., et al. 2011, A&A, 530, 108
- Hillier & Miller (1998) Hillier, D. J. & Miller, D. L., ApJ, 1998, 496, 407
- Hunter et al. (2007) Hunter, I., Dufton, P. L., Smartt, S. J. et al, 2007, A&A, 466, 277 [H07]
- Kurucz (1993) Kurucz, R. L. 1993, CDROM-13 (Cambridge: SAO)
- Maíz Apellániz et al. (2014) Maíz Apellániz, J., Evans, C. J., Barbá, R. H. et al. 2014, 564, 63
- McEvoy et al. (2015) McEvoy, C. M., Dufton, P. L., Evans, C. J. et al. 2015, A&A, 575, 70
- Korn et al. (2000) Korn, A. J., Becker, S. R., Gummersbach, C. A. & Wolf, B., 2000 A&A, 353, 655
- Korn et al. (2002) Korn, A. J., Keller, S. C., Kaufer, A. et al, 2002, A&A, 385, 143
- Korn et al. (2005) Korn, A. J., Nieva, M.-F., Daflon, S. & Cunha, K., 2005, AJ, 633, 899
- Lyubimkov, Rostopchin & Lambert (2000) Lyubimkov, L.S., Rostopchin, S.I & Lambert, D.L. 2002, MNRAs, 351, 745
- Mahy et al. (2015) Mahy, L., Rauw, G., De Becker, M. et al. 2015, A&A 577, 23
- Markova & Puls (2008) Markova, N. & Puls, J. 2008, A&A, 478, 823
- Markova, Puls & Langer (2018) Markova, N., Puls, J. & Langer, N. 2018, A&A, 613, 12
- Markova et al. (2009) Markova, N., Bianchi, L., Efremova, B. et al. 2009, BlgAJ 12, 21
- Markova et al. (2011) Markova, N., Puls, J. Scuderi, S. et al. 2011, A&A, 530, 11
- Martins, Schaerer, & Hillier (2002) Martins, F., Schaerer, D. & Hillier, D.J. 2002, A&A, 382, 999
- Martins et al. (2012) Martins, F., Mahy, L., Hillier, D.J. et al. 2012, A&A 538, 39
- Martins et al. (2015) Martins, F., Hervé, A., Bouret, J.-C. et al. 2015, A&A 575, 34
- Martins (2018) Martins, F. 2018 A&A, 616, 135
- Massey et al. (2004) Massey, P., Bresolin, F., Kudritzki, R.-P. et al., 2004, AJ, 608,1001
- Massey et al. (2005) Massey, P., Puls, J., Pauldrach, A. W. A. et al., 2005, AJ, 627, 477
- Massey et al. (2009) Massey, Ph. Zangari, A.M., Morrell, N.I. et al. 2009, ApJ 692, 618
- Massey et al. (2013) Massey, P., Neugent, K. F., Hillier, D. J. et al. 2013, ApJ, 768, 6
- McEvoy et al. (2014) McEvoy, C. M., Dufton, P. L., Evans, C. J. et al. 2015, A&A, 575, 70
- Mokiem et al. (2005) Mokiem, M. R., de Koter, A., Puls, J., et al. 2005, A&A, 441, 711
- Mokiem et al. (2007) Mokiem, M. R., de Koter, A., Evans, C. J., et al. 2007, A&A, 465, 1003
- Najarro et al. (2011) Najarro, F., Hanson, M. M., Puls, J. 2011, A&A 535, 32
- Pauldrach et al. (1994) Pauldrach, A. W. A, Kudritzki, R.-P., Puls, J. et al. 1994, A&A 283, 523
- Piatti et al. (2019) Piatti, A. E., Pietrzynski, G., Narloch, W. et al. 2019 MNRAS 483, 4766
- Puls et al. (1996) Puls, J., Kudritzki, R.-P., Herrero, A., et al. 1996, A&A, 305, 171
- Puls et al. (2005) Puls, J., Urbaneja, M. A., Venero, R., et al. 2005, A&A, 435, 669
- Ramachandran et al. (2018) Ramachandran, V., Hamann, W.-R., Hainich, R. et al. 2018, A&A 615,40
- Ramírez-Agudelo et al. (2013) Ramírez-Agudelo, O. H., Simón-Díaz, S., Sana, H., et al. 2013, A&A, 560, 29
- Ramírez-Agudelo et al. (2017) Ramírez-Agudelo, O. H., Sana, H., de Koter, A., et al. 2017, A&A, 600, 81
- Repolust et al. (2004) Repolust, T., Puls, J. & Herrero, A. 2004, A&A, 415, 349
- Rivero González et al. (2012) Rivero González, J. G., Puls, J., Najarro, F. et al. 2012, A&A, 537, 79
- Ryans et al. (2003) Ryans, R. S. I., Dufton, P. L., Mooney, C. J. et al. 2003, A&A, 401, 1119
- Rubele et al. (2012) Rubele, S., Kerber, L., Girardi, L., et al. 2012, A&A, 537, 106
- Sabín-Sanjulián et al. (2014) Sabín-Sanjulián, C., Simón-Díaz, S., Herrero, A., et al. 2014, A&A, 564, 39
- Sabín-Sanjulián et al. (2017) Sabín-Sanjulián, C., Simón-Díaz, S., Herrero, A., et al. 2017, A&A, 601, 79
- Sana et al. (2013) Sana, H., de Koter, A., de Mink, S. E., et al. 2013, A&A, 550, A107
- Santolaya-Rey, Puls & Herrero (1997) Santolaya-Rey, A. E., Puls, J., & Herrero, A. 1997, A&A, 323, 488
- Schneider et. (2018) Schneider, F. R. N., Sana, H., Evans, C. J. et al. 2018, Sci. 359, 69
- Simón-Díaz et al. (2011) Simón-Díaz, S., Castro, N., Herrero, A. et al. 2011, JPhCS.328a2021
- Simón-Díaz et al. (2017) Simón-Díaz, S., Godart, M., Castro, N. et al. 2017, A&A, 597, 22
- Shenar et al. (2015) Shenar, T., Oskinova, O., Hamman, W.-R. et al. 2015 ApJ 809, 135
- Shenar et al. (2016) Shenar, T., Hainich, R., Todt, H. et al. 2016 A&A 591, 22
- Smith & Howarth (1998) Smith, K. C.; Howarth, I. D. 1998, MNRAS, 299, 1146
- Sota et al. (2011) Sota, A., Maíz-Apellániz, J., Walborn, N. R. et al. 2011, ApJS, 193, 24
- Torres-Flores et al. (2013) Torres-Flores, S., Barbá, R., Maíz Apellániz, J., Rubio, M. et al. 2013, A&A, 555, 60
- Trundle et al. (2007) Trundle, C., Dufton, P. L., Hunter, I., et al. 2007, A&A, 471, 625 [T07]
- Villamariz & Herrero (2000) Villamariz, M.R. & Herrero, A. 2000, A&A, 357, 597
- Vrancken et al. (2000) Vrancken, M., Lennon, D. J., Dufton, P. L. & Lambert, D. L. 2000, A&A, 358, 632
- Urbaneja et al. (2005) Urbaneja, M. A., Herrero, A., Kudritzki, R.-P. et al. 2005, ApJ, 635, 311
- Walborn & Fitzpatrick (1990) Walborn, N. & Fitzpatrick, E. 1990, PASP, 102, 379
- Walborn et al. (2014) Walborn, N. R., Sana, H., Simón-Díaz, S., Maíz Apellániz, J. et al. 2014, A&A, 564, 40
Appendix A Effects of microturbulent velocity on the diagnostic HHeSi lines
As noted in Sect. 3.3, the adopted microturbulence impacts the diagnostic HHeSi lines that were used to investigate our stellar sample at the cool edge of the O star domain. It affects both the NLTE occupation numbers (via a modified line-radiation field) and the emergent profiles via its direct impact on the formal integral. In our new models these two effects are treated separately. The two examples shown in Figs. 9 and 10 illustrate the impact of the different values on the resulting line profiles.