Applying Noether’s theorem to matter in the Milky Way: evidence for external perturbations and non-steady-state effects from Gaia Data Release 2
Abstract
We apply Noether’s theorem to observations of main-sequence stars from the Gaia Data Release 2 archive to probe the matter distribution function of the Galaxy. That is, we examine the axial symmetry of stars at vertical heights , kpc, to probe the quality of the angular momentum as an integral of motion. The failure of this symmetry test would speak to a Milky Way, in both its visible and dark matter, that is not isolated and/or not in steady state. The left-right symmetry-breaking pattern we have observed, north and south, reveals both effects, with a measured deviation from symmetry of typically 0.5%. We show that a prolate form of the gravitational distortion of the Milky Way by the Large Magellanic Cloud, determined from fits to the Orphan stream by Erkal et al. (2019), is compatible with the size and sign of the axial-symmetry-breaking effects we have discovered in our sample of up to 14.4 million main-sequence stars, speaking to a distortion of an emergent, rather than static, nature.
1 Introduction
The stars of isolated galaxies in steady state have distribution functions (DFs) that obey the Poisson and collisionless Boltzmann (Vlasov) equations and are controlled by particular integrals of motion, as dictated by Jeans theorem (Jeans, 1915; Binney & Tremaine, 2008). In axisymmetric galaxies these integrals include the total energy and the component of angular momentum parallel to the symmetry axis , and the axially symmetric DFs are also reflection symmetric about the galactic mid-plane (An et al., 2017). The ubiquity of flat galactic rotation curves (Sofue & Rubin, 2001) are commonly interpreted as galaxies embedded in a spherical halo of dark matter (DM), for which and are also integrals of motion. Here we scrutinize how these expectations are borne out in our Galaxy using observations of stars from Gaia Data Release 2 (DR2) (Prusti et al., 2016; Brown et al., 2018).
In our Galaxy, the estimated stellar relaxation time is far longer than the age of the universe, making the neglect of stellar collisions an excellent approximation. This, in turn, allows us to model the collection of its stars as a continuous mass distribution, as essential to the use of the DF formalism. The continuous symmetries of that mass distribution become key probes of its dynamics, for Noether’s theorem links the existence of an integral of motion to that of a continuous symmetry (Noether, 1918; Olver, 1993). Thus to test the extent to which the angular momentum serves as an integral of motion, we can study whether the stellar mass distribution is axially symmetric. Of course the Galaxy possesses features that break axial symmetry, such as spiral arms (Chen et al., 2019; Reid et al., 2019) or dust (Rezaei Kh. et al., 2018), so that to test axial symmetry we select regions so as to minimize such effects. For example, we avoid the immediate Galactic mid-plane ( region, choosing stars at vertical heights with kpc, noting that the the dust has a vertical scale height of pc at the Sun’s location (Drimmel & Spergel, 2001)111This result is two times smaller than what one would extract from Table 1 of Drimmel & Spergel (2001), because we define the vertical scale height from the behavior of the dust density, , as grows large. — and the latest three-dimensional dust map considers pc (Rezaei Kh. et al., 2018). With this, and our other selections, we also avoid vertical structure in the spiral arms (Camargo et al., 2015). That our selection is also north-south reflection symmetric is important to establishing the origin of the symmetry-breaking effects we find. We test axial and reflection symmetry by comparing the number of stars “left” and “right” of the anti-center line at a Galactocentric azimuth of , running from the Galactic Center (GC) through the sun, so that “left (right)” refers to with , and we do this both for stars in the north () and south (). The appearance of axial-symmetry breaking would reveal that the matter in the Milky Way (MW) is subject to external and/or time-varying forces. By comparing axial symmetry breaking in the north and south we can separate time-varying forces from external ones. Particularly, we find that the axial symmetry breaking of the north and south combined is much smaller than that of their difference. Since An et al. (2017) have shown that an axially symmetric galaxy in steady state must be north-south symmetric, it is the breaking of axial symmetry as a north-south difference that emerges as a predominantly non-steady-state effect. Indeed, from our study we discover a correlated left-right, north-south asymmetry in stellar number counts. We interpret the smaller left-right axial symmetry breaking in the combination of star counts, north and south, as evidence of external or non-isolating forces, though that such forces may also be time dependent is not excluded.
Considerable evidence exists for imperfections throughout the Galactic disk. The disk is warped and flared in HI gas (Levine et al., 2006; Kalberla et al., 2007) and in stars (Alard, 2000; Ferguson et al., 2017), with striking evidence for the latter emerging recently from three-dimensional maps of samples of 1339 and 2431 Cepheids, respectively (Chen et al., 2019; Skowron et al., 2019). Rings (Newberg et al., 2002; Morganson et al., 2016) and ripples (Price-Whelan et al., 2015; Xu et al., 2015) have been noted, and vertical, wave-like asymmetries have been observed in main-sequence stars near the Sun’s location from the Sloan Digital Sky Survey (SDSS) (Widrow et al., 2012; Yanny & Gardner, 2013; Ferguson et al., 2017) and from Gaia DR2 (Bennett & Bovy, 2018). Evidence for axial-symmetry breaking of out-of-plane main-sequence stars in the north with SDSS has also been observed (Ferguson et al., 2017). Studies of the DF have been greatly enriched by the astrometry of Gaia DR2 (Prusti et al., 2016; Brown et al., 2018). Notably, Antoja et al. (2018) have discovered striking “snail shell and ridge” correlations within the position and velocity components of the DF that speak to both axially asymmetric and non-steady-state behavior, and, as they note, is attributable to the existence of the Galactic bar, spiral arms, as well as external perturbations.
The particular origins of these various effects are not well-established. Galactic warps have been thought to have a dynamical origin, appearing and disappearing on time scales short compared to the age of the universe, due to interactions with the halo and its satellites (Nelson & Tremaine, 1995; Shen & Sellwood, 2006), though it has also been suggested that the warp in HI gas is due to the presence of the Large Magellanic Cloud (LMC) (Weinberg & Blitz, 2006). The vertical asymmetries in the stellar density may be due to an ancient impact, possibly by the Sagittarius (Sgr) dwarf galaxy (Widrow et al., 2012), with support for the impact hypothesis coming not only from theoretical investigations (Purcell et al., 2011; Gómez et al., 2012a), but also from an observed vertical wave in mean metallicity (An, 2019), inferred from SDSS photometry, with features similar to the observed density wave. The novel phase-space structures noted by Antoja et al. (2018) also offer support to the impact hypothesis, as such features had been predicted as a consequence (Purcell et al., 2011; Gómez et al., 2012b; D’Onghia et al., 2016; Fux, 2001). Recently, too, the discovery of stars with retrograde motion in the disk has led to determination of a previously unidentified ancient impact, from Gaia-Enceladus (or the Gaia-Sausage) in the inner halo (Helmi et al., 2018; Belokurov et al., 2018). Also Koppelman et al. (2018) have noted significant merger debris and streams in the halo, which are also an expected consequence of ancient impacts — and a stellar stream has been discovered in the solar neighborhood as well (Necib et al., 2019). The velocity ellipsoid (Hagen et al., 2019) and DM distribution (Posti & Helmi, 2019) are not spheroidal either, with the evidence favoring a prolate matter distribution. Studies of flaring HI gas in the outer galaxy also support a prolate DM distribution (Banerjee & Jog, 2011); these authors note that a prolate halo can support long-lived warps (Ideta et al., 2000), which would help to explain why they are commonly seen (Banerjee & Jog, 2011). It has also been suggested that some of these features could arise from a dynamically active disk (Chequers et al., 2018) in isolation. Others note that ridges in phase-space may also connect to the Galactic bar (Mühlbauer & Dehnen, 2003; Fragkoudi et al., 2019).
Recent studies of the Orphan stream appear to challenge but also perhaps clarify much of this picture. It has been shown that stars in that stream have velocities that misalign with the stream track (Koposov et al., 2019; Fardal et al., 2019), and Erkal et al. (2019) have shown that it is possible to explain these offsets by the gravitational interaction with the LMC system if its mass (including an associated LMC DM halo) is , some 30 times more massive than its mass in stars (van der Marel, 2011) and 10 times more massive than an analysis of its rotation curve would suggest (van der Marel & Kallivayalil, 2013) — though other authors have also noted the need for a more massive LMC (Peñarrubia et al., 2015; Laporte et al., 2018; Moster et al., 2013; Behroozi et al., 2013) from very different viewpoints. Erkal et al. (2019) have also used the motion of stars within the Orphan stream to fit for the distorted shape of the matter DF in the MW from the interaction with the LMC. In contrast to the distributions discussed earlier (Banerjee & Jog, 2011; Posti & Helmi, 2019) — the shapes they determine are axially asymmetric, with some preference for a prolate geometry.
We note the phase-space studies of Antoja et al. (2018) were made from a sample of some 6 million stars. In this paper we consider a sample of up to 14.4 million stars, carefully selected for sensitive studies of the axial and vertical symmetry breaking patterns, to enable a determination of the most likely origin of the observed effects. Remarkably, we find that the distorted matter DFs found by Erkal et al. (2019) and the asymmetries that we determine in our stellar data set can confront and discriminate between their offered solutions. In particular, we find strong preference for a prolate form, in loose agreement with earlier work (Helmi, 2004; Banerjee & Jog, 2011), yet stemming from a completely different origin.
2 Theory
Noether’s theorem reveals that each continuous symmetry of a Hamiltonian system has an associated integral of motion (Noether, 1918). In this paper we evaluate the extent to which MW stars out of the Galactic mid-plane region are axially symmetric, with the implication that axial-symmetry breaking would speak to the violation of the conditions under which holds as an integral of motion. Strictly speaking, this association requires that the converse of Noether’s theorem holds (that, specifically, if is an integral of motion, then the system is invariant under rotations about the axis). This holds here, noting Theorem 5.58 of Olver (1993), with explicit demonstrations extant in the context of the stellar DF. For example, an isolated stellar system with an ergodic DF — so that is a non-negative function of — is spherical (Binney & Tremaine, 2008). Here non-zero, would imply that rotational symmetry about the direction should be manifest. Thus, if axial symmetry is broken, external, and possibly time dependent, forces must be at work.
In contrast, testing axial symmetry above and below the Galactic plane probes time-dependent interactions. That is, Theorem 6 of An et al. (2017) states that an axially symmetric galaxy in steady state must have north-south reflection symmetry, where we note Schulz et al. (2013) for a slightly less general proof of north-south symmetry in steady state. Thus, a symmetry-breaking pattern in which axial symmetry is broken differently above and below the Galactic plane speaks to the existence of non-steady-state effects within and possibly on the MW. To test axial symmetry, we count the number of stars on either side of , the anti-center line with the Galactocentric longitude, and compute the asymmetry parameter :
| (1) |
where and are defined as the number of stars at , left and right of the anti-center line, respectively. The functions subsume integrals over regions in the in-plane radial coordinate from the GC and the vertical distance from the mid-point of the Galactic plane. We note that Eq. (1) implies that for the north plus south sample is not given by sum of the asymmetry in the north and that in the south. For a perfectly axially symmetric system, .
2.1 External Torques from Nearby Masses
Our Galaxy possesses very massive satellite galaxies and is in the Local Group. The torques exerted by these external bodies could cause to be appreciably time dependent, spoiling axial symmetry. Non-steady-state forces could also exist within our sample, but in this section we consider torques stemming from forces external to it. In order to determine the most important contributions, we estimate the torques from the most massive and nearby objects beyond the MW, such as the Large and Small Magellanic Clouds (LMC and SMC) and the M31 (Andromeda) galaxy, as well as the Galactic bar, as it is not axially symmetric. We treat the Magellanic Clouds as a single system because they are bound together if the mass is in excess of (Kallivayalil et al., 2013), and, moreover, its mass appears to be DM dominated, though we shall usually refer to this system as the LMC henceforth in this work. We also evaluate the impacts of a few other prominent objects and show them to be relatively negligible. We assume the external sources are faraway point masses, ignoring the corrections that come from their finite extent. For the Galactic bar/bulge system we must be more careful. If the center of the MW is co-located with the center of mass (CM) of the bar/bulge, symmetry constrains the torque from the CM to be zero. If its CM is at the mid-point of its length, its net dipole moment vanishes, yet it can still exert a non-zero torque because it has a small tilt with respect to the anti-center line. To compute the torques, we use the object locations tabulated in SIMBAD (Wenger et al., 2000). The Sun is taken to be at (-8,0,0) kpc in Galactocentric -coordinates. The Galactic bar/bulge system consists of a box/peanut-shaped bulge and a long bar (Bland-Hawthorn & Gerhard, 2016), and we assume that the torque it exerts is dominated by the first, more massive object. Portail et al. (2015) have found its dynamical mass to be within a box of in volume. The bar angle made by its semi-major axis with respect to the anti-center line has been found from a study of red-clump giants to be (Wegg & Gerhard, 2013), noting that the near side of that axis points in the first quadrant, (Wegg & Gerhard, 2013; Bland-Hawthorn & Gerhard, 2016). This crudely implies that the half length of the peanut bulge is 1.4 kpc long, and for reason of estimate we suppose a quarter of the dynamical mass is associated with the end of that half length. This gives our numerical value for the torque. We compile these results in Table 1, where is the mass of the external source, or perturber; is the distance of its CM from the Sun, which is the approximate center of our sample; and is the torque exerted by the CM on the Sun in the direction. Our estimate for the Galactic bar is admittedly crude, but it should suffice for our rough rank ordering.
| Object | Mass () | distance (kpc) | (pc) | (pc-1) |
| LMC (and SMC) | 222Erkal et al. (2019) | 52(2) 333Panagia (1999) | 51 | 340,000 |
| M31 | 444Peñarrubia et al. (2015) | 772(44) 555Ribas et al. (2005) | 2 | -14,000 |
| Triangulum | 666Within 17 kpc from center as per Corbelli (2003) | 839(28) 777Gieren et al. (2013) | 0.1 | -420 |
| Galactic Bar/bulge | 888Portail et al. (2015) | 8 999Assumed | 288 | -47,000 |
| Sagittarius | 101010Law & Majewski (2010) | 28 10 | 0.3 | -240 |
| Fornax | 111111Łokas (2009) | 138(8) 11 | 0.01 | 23 |
| Carina | 11 | 101(5) 11 | 16 | |
| Sextans | 11 | 86(4) 11 | 0.01 | 29 |
| Sculptor | 11 | 79(4) 11 | 0.01 | 5 |
| Gaia-Enceladus | 121212Helmi et al. (2018); Belokurov et al. (2018) | - | - | - |
From Table 1, it is apparent that the largest effect comes from the LMC system. Other significant perturbers include the Galactic bar and M31, though the uncertainties are such that their relative roles could be reversed. The net torque from these sources impacts both the shape and magnitude of . Nevertheless our particular accounting shows that the LMC system grossly outweighs the other perturbers. However, if the shape of does not match that expected from the LMC, say, then this could speak to matter effects, possibly from DM, that clandestinely torque our sample. Conversely, if we can account for the shape of we may well be able to constrain such structures. Thus far we have focused on external perturbations, which act to break the axial symmetry of our stellar sample, north plus south. However, non-steady-state effects within our sample may also exist and stem from different sources, such as from the passage of ancient satellites that perturb and excite the disk. Indeed, the interaction of the Sgr dwarf spheroidal (dSph) with the Galactic disk has been suggested as the origin (Widrow et al., 2012; Gómez et al., 2013) of the vertical, wave-like perturbations we noted earlier (Widrow et al., 2012; Yanny & Gardner, 2013; Bennett & Bovy, 2018), and the effect can also give rise (Darling & Widrow, 2019; Laporte et al., 2019) to the Gaia phase-space spiral (Antoja et al., 2018).
3 Data Selection and Analysis
We use data from the European Space Agency’s Gaia space telescope, via the online Gaia archive (Prusti et al., 2016; Brown et al., 2018). The success of our analysis demands that we select stars, left and right, north and south, in a very balanced way. Our selections were made from stars with measured parallaxes (Lindegren et al., 2018), though we choose to apply an intermediate offset of 0.07 mas (noting evidence for Gaia DR2 parallax zero-points ranging from -0.029 to -0.083 mas depending on reference population in Zinn et al. (2019); Stassun & Torres (2018); Lindegren et al. (2018)), to add to all parallax measurements. With the shift applied, we keep only stars with measured parallaxes, mas, though this shift is a trivial one for our data set, because no stars are added as a result. We also require to avoid the extinction effects characteristic of lower latitudes. To avoid selection bias, we remove all stars in the directions of the LMC and SMC, as well as their reflections across the mid-plane, across the anti-center line, and across both the mid-plane and anti-center line. The LMC and SMC are removed by requiring , and , respectively. The other six box cuts are constructed with suitable reflections. Considering the completeness of our data set in magnitude, color, , and we see no clear evidence of incompleteness or of obvious, systematic biases if we choose mag, mag, kpc, , mas, and kpc. If we choose , these cuts yield a sample of 14.4 million stars. The key cuts which ensure completeness are restricting the Gaia data sample to brighter limits () and avoiding crowded low latitude regions. Tests involving restrictions to an even brighter limit , while lowering significance with a smaller sample, does not change our asymmetry findings (see Figure 1) and gives us confidence that we are not probing incomplete Gaia DR2 samples as a function of azimuth. We defer more discussion of the completeness studies that motivate these choices to a future paper (Hinkel et al., 2019, in preparation), though we find it pertinent to highlight a key result of that work: as a result of our selections in -band magnitude and color, we find the average relative parallax error of our stars to be reduced to some 10%, even though we have not directly restricted that parameter, because the distance distributions would become skewed as a result (Luri et al., 2018; Bailer-Jones et al., 2018). Moreover, noting Fig. 7 of Arenou et al. (2018), we have also explicitly studied the impact of more crowded fields on our results. We find, e.g., that making additional restrictions on our data set in the direction of the GC has a negligible impact on the results we report here.
Table 2 shows that our data selections are well matched, north and south, as well as left and right, showing no sign that spatial asymmetries in the dust observed in the mid-plane region (Schlegel et al., 1998) impact our results. The left and right samples, north and south, are matched to within about 0.06%. The larger, but still very small, number count asymmetries we observe in the north or south turn out to match more poorly, but its source may stem from the physics that makes so much larger. As the dependence of is our key result, we have also studied completeness within the plane carefully to determine that we should limit for our selection, implying, roughly, that we choose a reach in and in that is about of the Sun’s location, yielding a sample of 11.7 million stars.
| Left | Right | Asymmetry (%) | |
|---|---|---|---|
| North | 3,376,969 | 3,471,980 | -1.39 |
| South | 3,815,477 | 3,729,647 | 1.14 |
| TOTAL: | 7,192,446 | 7,201,627 | -0.06 |
3.1 Data Analysis
The results of our asymmetry analysis of star counts left-right of the anti-center line are shown in Fig. 1, with panel a) revealing that axial symmetry in the north plus south (N+S) sample (blue diamonds) is significantly broken at a level up to out to angles , though the symmetry breaking effects in the north (N) only (black up triangles) or south (S) only (red down triangles) samples can be much larger. Remarkably the N and S left-right asymmetries are also anti-correlated in sign, so that the difference in the N and S asymmetries can be grossly larger than that of the N+S sample as shown in Fig. 1b. This comparison shows that the symmetry-breaking effects from non-steady-state interactions within and beyond the Galaxy are grossly larger than those resulting from a steady, external perturbation. In panels c) and d) we reinforce the results of panel a) by noting that the asymmetry trend persists when only keeping stars with (panel c) and when making a very conservative faint end cut, keeping stars with (panel d). Luri et al. (2018) note that the Gaia DR2 catalog is “essentially complete between and mag,” though it also extends significantly beyond mag. Parallax measurements are, however, quite incomplete for in Gaia DR2, and Luri et al. (2018) also remark that the faint end limit is “fuzzy” in that it can depend on object density and on the filtering on data quality prior to publication. Nevertheless, we do not observe any significant changes in our results with changes in the G-band selection so long as we choose magnitude cuts. Thus we opt for the largest selection we can make. If we restrict to a brighter limit than , then substantially decreased number counts do more strongly begin to compromise the significance of especially N (only) and S (only) studies of the asymmetry.
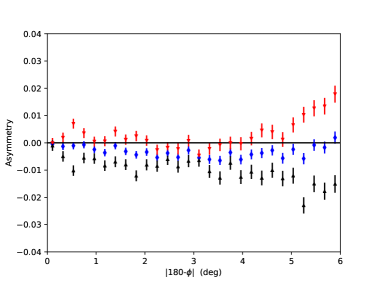
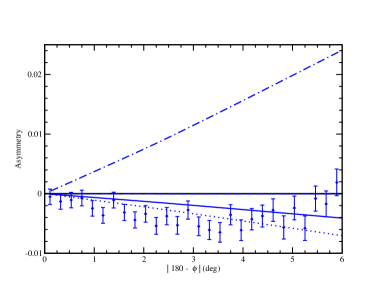
Although the asymmetries we have found are small, they are nevertheless significant. For the N+S result shown in Fig. 1a, a linear fit to the data shows that both the constant and linear term are non-zero beyond significance: . The N+S asymmetry is larger than the aggregate raw number count asymmetry of our data selection, shown in Table 2. Were we to repeat the raw number count comparison for a maximum value of we would find a value of -0.0032, so that our fit result is also significantly different from that. It is thus apparent that none of the asymmetries — N, S, or N+S — are constant with . Moreover, an anti-correlation of the asymmetries N and S is also present, noting that at values of and (Fig. 1b), an increase in the asymmetry in the N is matched by a more negative asymmetry in the . We comment on these smaller scale asymmetries briefly below.
3.2 Asymmetries from Mass Distribution Models Deduced from Orphan Stream Fits
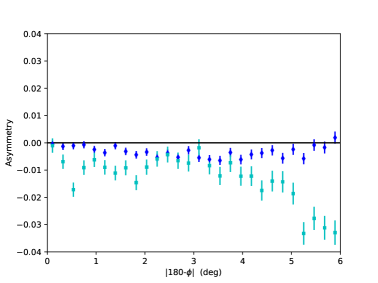
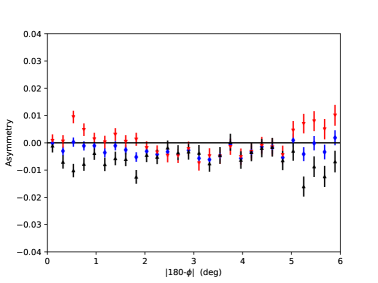
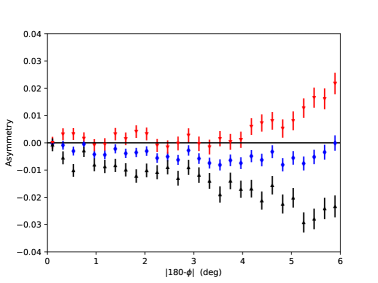
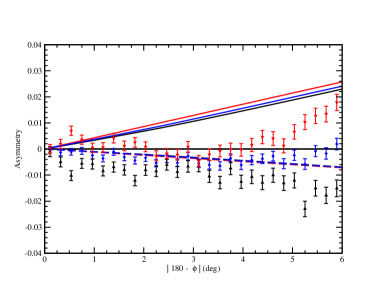
Erkal et al. (2019) have computed the relative likelihoods of several different MW mass distribution models that were used to fit out-of-stream velocities in the entire Orphan stream in the presence of the LMC. They adopt a generalized form of “MWPotential2014” from Bovy (2015), which consists of bulge, disk, and halo components, though they keep the bulge and disk components fixed and allow only the mass and shape of the halo to vary. Erkal et al. (2019) find that the LMC induces a flattening of the halo in a direction away from the axis, though they caution against interpreting this as an intrinsic property of the disk; we revisit this in the face of our asymmetry results below. The distortion of the halo, which they assume is of NFW form (Navarro et al., 1997), yields either an oblate or prolate shape, and they allow for the reflex motion of the MW in the presence of the LMC, though they have not allowed the shape of the LMC itself to vary. (For reference, we note that the scale height in their disk model is 280 pc (Miyamoto & Nagai, 1975).) We have taken the various best fit parameters from Table A1 of Erkal et al. (2019) and have computed an additional observable: the asymmetry in the left-right star counts versus Galactocentric azimuth (in N, S, and N+S versions) that would result from each of the distorted halo models that they tabulate in their Table A1 — oblate, prolate, and with and without the reflex action of the MW halo. We have not used their spherical halo solution, which their fits strongly disfavor, because that would yield a vanishing left-right asymmetry. That we expect these asymmetries to be pertinent to our asymmetry results stem from the torques estimated in Table 1 — it is apparent that the LMC must dominate any N+S asymmetry today. Moreover, although (Erkal et al., 2019) fit for a distorted halo only, the outcome of their work is a distorted matter distribution, which we probe near the Sun through the distribution of stellar number counts. The results of these analytical computations are shown in straight lines in Figure 2, overlaid with the star-count results from Figure 1.
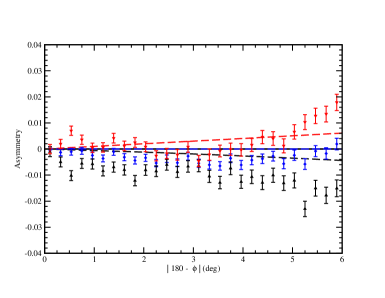
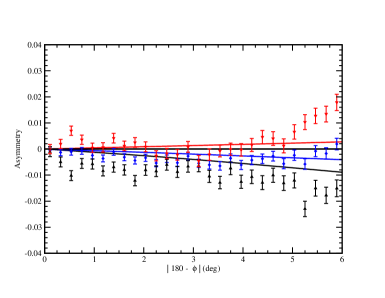
The data in panel a) of Fig. 2 clearly show a significant large scale trend in the left-right asymmetry of combined N+S star counts (blue diamonds) extending from the anti-center line to left or right. Evaluating the statistic for these computed models compared with the data, noting that the Erkal et al. (2019) fits contain five parameters: the halo mass and scale radius, and the magnitude and orientation (in ) of the flattening, we find for our 28 data points that is 3.64 (reflex prolate, solid blue with a downward tilt), 6.40 (oblate, dotted with downward tilt), 7.11 (prolate, solid, hugging ), and 201 (reflex oblate, dotted-dashed, upward tilt). Although no one model describes the N+S asymmetry data well, the preference for the reflex prolate or possibly the oblate (though see below) description is clear. That is, of the models considered by Erkal et al. (2019), an LMC torque which distorts the halo of the MW, while accounting for its reflex motion, into a prolate ellipsoid with its major axis aligned roughly along the line between the GC and the LMC provides the best match to our solar-neighborhood star-count asymmetries. An oblate model that is not corrected for reflex motion can also fit the combined data, but once we consider the N and S samples separately the oblate halo models are clearly ruled out. All the models are more strongly distinguished once the N and S results are also considered, and we show these comparisons in panels b), c), and d) of Fig. 2. There we compare our asymmetry count results with those of the model fits in the N, S, and N+S, where we consider oblate (dashed) and reflex oblate (solid) in b), prolate in c) and reflex prolate in d). The problem with matching the data to an oblate model becomes apparent when looking at the N, S, and N+S asymmetries in Fig. 2 b): the three curves are nearly coincident, but the order of the lines is reversed, with S slightly below N in the model calculations, whereas the N-only asymmetry is much more negative than the S-only in the data counts, in clear contradiction with the data. Additionally, the split in N-only and S-only tracks is not reflected in the nearly coincident model lines. Comparing with the reflex oblate model, we see that the N, S, and N+S asymmetries split slightly, but they all very much diverge from the data. In panels c) and d), we see that the prolate and reflex prolate models have asymmetries that strongly differentiate N and S, as do the data points from Fig. 1. The prolate model has a near null N+S asymmetry; this results because its major axis points very nearly in the direction, so that in summing N and S there is no left-right asymmetry. We thus see that the reflex prolate model describes the data better. These conclusions are very much born out by a analysis; for N, S, and N+S, respectively, is 15.8, 21.2, and 6.40 (oblate); 143, 88.7, 201 (reflex oblate); 18.7, 12.2, 7.11 (prolate), and 15.0, 9.82, 3.64 (reflex prolate). We thus conclude that a oblate shape in which the flattened direction is in the orbital plane of the LMC, needed to fit the Orphan stream data (Erkal et al., 2019) is ruled out. Thus, by showing that a prolate, reflex halo model is best fit (amongst the small set of models here) and by ruling out oblate models, we demonstrate the power of asymmetries to make new and significant constraints on the distribution of DM in and around our MW.
While tying this overall trend in to the influence of a massive LMC and demonstrating its influence on the DM halo of our MW, distorting it into a prolate spheroid, is our main result, we also note several smaller scale “blips” in the asymmetries of Fig. 2b) which may be attributed to some of the other substructures listed in Table 1. We discuss this further in § 4.2.
4 Results
4.1 Evidence for External Perturbations
The LMC appears to be the dominant external influence on the Galaxy. Erkal et al. (2019) find a galactic potential that incorporates the LMC (and SMC)’s effect on the MW, and we note that it explicitly breaks axial symmetry. Upon integrating their models over the same volume of space as that used in Fig. 2 a), we find that the “reflex prolate” model of Erkal et al. (2019) is the most consistent with the observed axial asymmetries.
While detailed model explanations are beyond the scope of this work, we note three further possible connections between the LMC and non-axisymmetric structure in the disk and halo, which have already been suggested in the literature:
1. As first pointed out in Law & Majewski (2010), the pole of the Magellanic stream is aligned within of the tilted triaxial MW halo needed to reproduce the orbit of the Sgr stellar stream. Increasing the mass by a factor of a few, as suggested by Erkal et al. (2019), makes the apparent unusual alignment and shape of the MW halo compared with its disk quite plausible.
2. An analysis by Iorio & Belokurov (2018) of the distribution of RR Lyrae associated with the Gaia-Enceladus structure (Helmi et al., 2018; Belokurov et al., 2018) have been shown to point to a MW halo elongated in the direction to the LMC.
3. The line of anti-nodes for bending modes in the HI gas disk (Levine et al., 2006) is at and for the Cepheid-traced outer stellar disk (Skowron et al., 2019; Chen et al., 2019) is in the range , not far from . The orientation of the long axis of the prolate halo geometry we favor coincides with this direction as well and could support this bending mode as suggested by Dekel & Shlosman (1983), Sparke & Casertano (1988), and Ideta et al. (2000), helping to explain its long-lived nature (Ideta et al., 2000). Linking the LMC to the warp also supports the results of Weinberg & Blitz (2006).
4.2 Evidence for Non-steady-state Effects
We argue that the largest MW perturber is a heavy LMC system having some 10% of the MW’s mass (Erkal et al., 2019). That system, assumed to be on first passage by the MW, has a typical median infall time of 1.4 Gyr for MW and LMC masses similar to what we assume here (Patel et al., 2016). This timescale is long enough to be considered quasi-steady-state and results in unobservably slow adiabatic changes (Binney & Tremaine, 2008). Nevertheless, we regard the observed distortions not as long-term properties of the disk, keeping in mind that it is difficult to realize a stellar disk that is misaligned with the halo (Debattista et al., 2013; Erkal et al., 2019), but rather as a response to the LMC infall. Yet, there are regions where the left-right asymmetry is much larger, particularly if we consider the asymmetry N-S rather than N+S, as in Fig. 1b) near . According to Theorem 6 from An et al. (2017), the approximate azimuthal symmetry here means than the north-south difference we see is indicative of a departure from steady-state dynamics on smaller time — and length — scales.
Given that the effect that causes these “blips” should be appreciably time dependent, the Galactic bar is a great candidate, with a pattern speed known to be roughly (Portail et al., 2016). This pattern speed corresponds to a period of roughly 160 Myr, much shorter than the dynamical timescale of the LMC infall and is comparable with the crossing time near the solar neighborhood ( Myr). This hypothesis is bolstered by the fact that the Outer Lindblad Resonance is thought to be near the solar circle (Dehnen, 2000), where we also note Fragkoudi et al. (2019).
Generally, the emergence of features that differentiate N from S supports our interpretation of the halo distortion, which we also observe through axial asymmetries in our stellar sample, as a response to the LMC infall.
5 Summary
We have discovered statistically significant left-right and north-south asymmetries in Gaia DR2 star counts in the solar neighborhood, which are all consistent with a large scale perturbation caused primarily by the LMC system — and its associated DM. Previous discussions of the relative influence of the LMC on MW disk asymmetries (Hunter & Toomre, 1969) would underestimate the LMC’s relative influence due to early, lower-mass estimates of the LMC and tidal force approximations, which may not work well when the larger LMC/MW mass ratio of some 10% is used. Now, recent work by Erkal et al. (2019), with its significantly larger and more accurate LMC mass, gives significant credence to the suggestion by Weinberg & Blitz (2006) that the LMC could in fact be nearly entirely responsible for the long observed HI gas warp of the MW disk. Moreover, when then modeling the LMC’s influence, a non-reflex model which assumes , is insufficient, and one that can include reflex reactions of the MW due to the LMC, such as that in Erkal et al. (2019), is more appropriate. We find now, that not only can the LMC’s influence explain the HI gas warp, but it also appears to induce a substantial asymmetry in the star counts left vs. right and north vs. south in the solar neighborhood of the correct sign and magnitude. Looking at other possible perturbers, the effect of the LMC is dominant compared to that of the Galactic bar (in most scenarios), the Sgr dwarf and stream, and finally also the more massive but much more distant perturbers, such as M31 (see Table 1). The odd, tipped triaxial shape of the MW’s dark halo suggested by Law & Majewski (2010) based on the orbit of the Sgr stream and the elongation of the Gaia-Enceladus structure (Helmi et al., 2018; Belokurov et al., 2018) can also both be potentially more simply understood by the gravitational interaction with the LMC — though detailed modeling remains to confirm that these additional suggestions do operate in detail.
Deviations from symmetry in the case of star counts near the sun (at only the sub-percent level), combined with results related to Noether’s theorem associating a conserved angular momentum with rotational symmetry are shown here to be powerful probes of the influence of satellite torques on the overall distribution of mass in and around the MW.
References
- Alard (2000) Alard, C. 2000, arXiv preprint astro-ph/0007013
- An (2019) An, D. 2019, The Astrophysical Journal Letters, 878, L31
- An et al. (2017) An, J., Evans, N., & Sanders, J. 2017, Monthly Notices of the Royal Astronomical Society, 467, 1281
- Antoja et al. (2018) Antoja, T., Helmi, A., Romero-Gómez, M., et al. 2018, Nature, 561, 360
- Arenou et al. (2018) Arenou, F., Luri, X., Babusiaux, C., et al. 2018, A&A, 616, A17, doi: 10.1051/0004-6361/201833234
- Bailer-Jones et al. (2018) Bailer-Jones, C. A. L., Rybizki, J., Fouesneau, M., Mantelet, G., & Andrae, R. 2018, AJ, 156, 58, doi: 10.3847/1538-3881/aacb21
- Banerjee & Jog (2011) Banerjee, A., & Jog, C. J. 2011, The Astrophysical Journal Letters, 732, L8
- Behroozi et al. (2013) Behroozi, P. S., Wechsler, R. H., & Conroy, C. 2013, ApJ, 770, 57, doi: 10.1088/0004-637X/770/1/57
- Belokurov et al. (2018) Belokurov, V., Erkal, D., Evans, N., Koposov, S., & Deason, A. 2018, Monthly Notices of the Royal Astronomical Society, 478, 611
- Bennett & Bovy (2018) Bennett, M., & Bovy, J. 2018, Monthly Notices of the Royal Astronomical Society, 482, 1417
- Binney & Tremaine (2008) Binney, J., & Tremaine, S. 2008, Galactic Dynamics (Princeton, NJ: Princeton Univ. Press)
- Bland-Hawthorn & Gerhard (2016) Bland-Hawthorn, J., & Gerhard, O. 2016, ARA&A, 54, 529, doi: 10.1146/annurev-astro-081915-023441
- Bovy (2015) Bovy, J. 2015, ApJS, 216, 29, doi: 10.1088/0067-0049/216/2/29
- Brown et al. (2018) Brown, A., Vallenari, A., Prusti, T., et al. 2018, Astronomy & astrophysics, 616, A1
- Camargo et al. (2015) Camargo, D., Bonatto, C., & Bica, E. 2015, MNRAS, 450, 4150, doi: 10.1093/mnras/stv840
- Chen et al. (2019) Chen, B. Q., Huang, Y., Hou, L. G., et al. 2019, MNRAS, 487, 1400, doi: 10.1093/mnras/stz1357
- Chen et al. (2019) Chen, X., Wang, S., Deng, L., et al. 2019, Nature Astronomy, 3, 320
- Chequers et al. (2018) Chequers, M. H., Widrow, L. M., & Darling, K. 2018, Monthly Notices of the Royal Astronomical Society, 480, 4244
- Corbelli (2003) Corbelli, E. 2003, Monthly Notices of the Royal Astronomical Society, 342, 199
- Darling & Widrow (2019) Darling, K., & Widrow, L. M. 2019, MNRAS, 484, 1050, doi: 10.1093/mnras/sty3508
- Debattista et al. (2013) Debattista, V. P., Roškar, R., Valluri, M., et al. 2013, MNRAS, 434, 2971, doi: 10.1093/mnras/stt1217
- Dehnen (2000) Dehnen, W. 2000, The Astronomical Journal, 119, 800
- Dekel & Shlosman (1983) Dekel, A., & Shlosman, I. 1983, IAU Symp. 100 in Internal Kinematics and Dynamics of Galaxies, ed. E. Athanassoula (Cambridge: Cambridge University Press), 187.
- D’Onghia et al. (2016) D’Onghia, E., Madau, P., Vera-Ciro, C., Quillen, A., & Hernquist, L. 2016, The Astrophysical Journal, 823, 4
- Drimmel & Spergel (2001) Drimmel, R., & Spergel, D. N. 2001, ApJ, 556, 181, doi: 10.1086/321556
- Erkal et al. (2019) Erkal, D., Belokurov, V., Laporte, C., et al. 2019, Monthly Notices of the Royal Astronomical Society, 487, 2685
- Fardal et al. (2019) Fardal, M. A., van der Marel, R. P., Sohn, S. T., & del Pino Molina, A. 2019, Monthly Notices of the Royal Astronomical Society, 486, 936
- Ferguson et al. (2017) Ferguson, D., Gardner, S., & Yanny, B. 2017, The Astrophysical Journal, 843, 141
- Fragkoudi et al. (2019) Fragkoudi, F., Katz, D., Trick, W., et al. 2019, Monthly Notices of the Royal Astronomical Society, 488, 3324
- Fux (2001) Fux, R. 2001, Astronomy & Astrophysics, 373, 511
- Gieren et al. (2013) Gieren, W., Górski, M., Pietrzyński, G., et al. 2013, The Astrophysical Journal, 773, 69
- Gómez et al. (2013) Gómez, F. A., Minchev, I., O’Shea, B. W., et al. 2013, MNRAS, 429, 159, doi: 10.1093/mnras/sts327
- Gómez et al. (2012a) Gómez, F. A., Minchev, I., O’Shea, B. W., et al. 2012a, Monthly Notices of the Royal Astronomical Society, 429, 159
- Gómez et al. (2012b) Gómez, F. A., Minchev, I., Villalobos, Á., O’Shea, B. W., & Williams, M. E. 2012b, Monthly Notices of the Royal Astronomical Society, 419, 2163
- Hagen et al. (2019) Hagen, J. H., Helmi, A., de Zeeuw, P. T., & Posti, L. 2019, arXiv preprint arXiv:1902.05268
- Helmi (2004) Helmi, A. 2004, Monthly Notices of the Royal Astronomical Society, 351, 643
- Helmi et al. (2018) Helmi, A., Babusiaux, C., Koppelman, H. H., et al. 2018, Nature, 563, 85
- Hunter & Toomre (1969) Hunter, C., & Toomre, A. 1969, The Astrophysical Journal, 155, 747
- Ideta et al. (2000) Ideta, M., Hozumi, S., Tsuchiya, T., & Takizawa, M. 2000, Monthly Notices of the Royal Astronomical Society, 311, 733
- Iorio & Belokurov (2018) Iorio, G., & Belokurov, V. 2018, Monthly Notices of the Royal Astronomical Society, 482, 3868
- Jeans (1915) Jeans, J. H. 1915, Monthly Notices of the Royal Astronomical Society, 76, 70, doi: 10.1093/mnras/76.2.70
- Kalberla et al. (2007) Kalberla, P., Dedes, L., Kerp, J., & Haud, U. 2007, Astronomy & Astrophysics, 469, 511
- Kallivayalil et al. (2013) Kallivayalil, N., van der Marel, R. P., Besla, G., Anderson, J., & Alcock, C. 2013, ApJ, 764, 161, doi: 10.1088/0004-637X/764/2/161
- Koposov et al. (2019) Koposov, S., Belokurov, V., Li, T., et al. 2019, Monthly Notices of the Royal Astronomical Society, 485, 4726
- Koppelman et al. (2018) Koppelman, H., Helmi, A., & Veljanoski, J. 2018, The Astrophysical Journal Letters, 860, L11
- Laporte et al. (2019) Laporte, C. F., Minchev, I., Johnston, K. V., & Gómez, F. A. 2019, Monthly Notices of the Royal Astronomical Society, 485, 3134
- Laporte et al. (2018) Laporte, C. F. P., Gómez, F. A., Besla, G., Johnston, K. V., & Garavito-Camargo, N. 2018, MNRAS, 473, 1218, doi: 10.1093/mnras/stx2146
- Law & Majewski (2010) Law, D. R., & Majewski, S. R. 2010, The Astrophysical Journal, 714, 229
- Levine et al. (2006) Levine, E. S., Blitz, L., & Heiles, C. 2006, The Astrophysical Journal, 643, 881
- Lindegren et al. (2018) Lindegren, L., Hernandez, J., Bombrun, A., et al. 2018, Astronomy & Astrophysics, 616, A2
- Łokas (2009) Łokas, E. L. 2009, Monthly Notices of the Royal Astronomical Society: Letters, 394, L102
- Luri et al. (2018) Luri, X., Brown, A., Sarro, L., et al. 2018, Astronomy & Astrophysics, 616, A9
- Miyamoto & Nagai (1975) Miyamoto, M., & Nagai, R. 1975, PASJ, 27, 533
- Morganson et al. (2016) Morganson, E., Conn, B., Rix, H.-W., et al. 2016, The Astrophysical Journal, 825, 140
- Moster et al. (2013) Moster, B. P., Naab, T., & White, S. D. M. 2013, MNRAS, 428, 3121, doi: 10.1093/mnras/sts261
- Mühlbauer & Dehnen (2003) Mühlbauer, G., & Dehnen, W. 2003, Astronomy & Astrophysics, 401, 975
- Navarro et al. (1997) Navarro, J. F., Frenk, C. S., & White, S. D. 1997, The Astrophysical Journal, 490, 493
- Necib et al. (2019) Necib, L., Ostdiek, B., Lisanti, M., et al. 2019, arXiv preprint arXiv:1907.07190
- Nelson & Tremaine (1995) Nelson, R. W., & Tremaine, S. 1995, Monthly Notices of the Royal Astronomical Society, 275, 897
- Newberg et al. (2002) Newberg, H. J., Yanny, B., Rockosi, C., et al. 2002, The Astrophysical Journal, 569, 245
- Noether (1918) Noether, E. 1918, NWGot, 1918, 235, http://eudml.org/doc/59024
- Olver (1993) Olver, P. J. 1993, Applications of Lie groups to differential equations (2nd ed.; Berlin: Springer)
- Panagia (1999) Panagia, N. 1999, in Symposium-International Astronomical Union, Vol. 190, Cambridge University Press, 549–554
- Patel et al. (2016) Patel, E., Besla, G., & Sohn, S. T. 2016, Monthly Notices of the Royal Astronomical Society, 464, 3825
- Peñarrubia et al. (2015) Peñarrubia, J., Gómez, F. A., Besla, G., Erkal, D., & Ma, Y.-Z. 2015, Monthly Notices of the Royal Astronomical Society: Letters, 456, L54
- Portail et al. (2016) Portail, M., Gerhard, O., Wegg, C., & Ness, M. 2017, Monthly Notices of the Royal Astronomical Society, 465, 1621
- Portail et al. (2015) Portail, M., Wegg, C., Gerhard, O., & Martinez-Valpuesta, I. 2015, MNRAS, 448, 713, doi: 10.1093/mnras/stv058
- Posti & Helmi (2019) Posti, L., & Helmi, A. 2019, Astronomy & Astrophysics, 621, A56
- Price-Whelan et al. (2015) Price-Whelan, A. M., Johnston, K. V., Sheffield, A. A., Laporte, C. F., & Sesar, B. 2015, Monthly Notices of the Royal Astronomical Society, 452, 676
- Prusti et al. (2016) Prusti, T., De Bruijne, J., Brown, A. G., et al. 2016, Astronomy & Astrophysics, 595, A1
- Purcell et al. (2011) Purcell, C. W., Bullock, J. S., Tollerud, E. J., Rocha, M., & Chakrabarti, S. 2011, Nature, 477, 301
- Reid et al. (2019) Reid, M. J., Menten, K. M., Brunthaler, A., et al. 2019, ApJ, 885, 131, doi: 10.3847/1538-4357/ab4a11
- Rezaei Kh. et al. (2018) Rezaei Kh., S., Bailer-Jones, C. A. L., Hogg, D. W., & Schultheis, M. 2018, A&A, 618, A168, doi: 10.1051/0004-6361/201833284
- Ribas et al. (2005) Ribas, I., Jordi, C., Vilardell, F., et al. 2005, The Astrophysical Journal Letters, 635, L37
- Schlegel et al. (1998) Schlegel, D. J., Finkbeiner, D. P., & Davis, M. 1998, ApJ, 500, 525, doi: 10.1086/305772
- Schulz et al. (2013) Schulz, A. E., Dehnen, W., Jungman, G., & Tremaine, S. 2013, MNRAS, 431, 49, doi: 10.1093/mnras/stt073
- Shen & Sellwood (2006) Shen, J., & Sellwood, J. 2006, Monthly Notices of the Royal Astronomical Society, 370, 2
- Skowron et al. (2019) Skowron, D. M., Skowron, J., Mróz, P., et al. 2019, Science, 365, 478
- Sofue & Rubin (2001) Sofue, Y., & Rubin, V. 2001, Annual Review of Astronomy and Astrophysics, 39, 137, doi: 10.1146/annurev.astro.39.1.137
- Sparke & Casertano (1988) Sparke, L. S., & Casertano, S. 1988, Monthly Notices of the Royal Astronomical Society, 234, 873
- Stassun & Torres (2018) Stassun, K. G., & Torres, G. 2018, The Astrophysical Journal, 862, 61
- van der Marel (2011) van der Marel, R. P. 2011, in The Local Group as an Astrophysical Laboratory, ed. M. Livio & T. M. Brown
- van der Marel & Kallivayalil (2013) van der Marel, R. P., & Kallivayalil, N. 2013, The Astrophysical Journal, 781, 121
- Wegg & Gerhard (2013) Wegg, C., & Gerhard, O. 2013, MNRAS, 435, 1874, doi: 10.1093/mnras/stt1376
- Weinberg & Blitz (2006) Weinberg, M. D., & Blitz, L. 2006, The Astrophysical Journal Letters, 641, L33
- Wenger et al. (2000) Wenger, M., Ochsenbein, F., Egret, D., et al. 2000, Astronomy and Astrophysics Supplement Series, 143, 9
- Widrow et al. (2012) Widrow, L. M., Gardner, S., Yanny, B., Dodelson, S., & Chen, H.-Y. 2012, The Astrophysical Journal Letters, 750, L41
- Xu et al. (2015) Xu, Y., Newberg, H. J., Carlin, J. L., et al. 2015, The Astrophysical Journal, 801, 105
- Yanny & Gardner (2013) Yanny, B., & Gardner, S. 2013, The Astrophysical Journal, 777, 91
- Zinn et al. (2019) Zinn, J. C., Pinsonneault, M. H., Huber, D., & Stello, D. 2019, The Astrophysical Journal, 878, 136