Sensitive Probing of Exoplanetary Oxygen via Mid Infrared Collisional Absorption
Published in Nature astronomy on 06/01/2020)
Abstract
The collision-induced fundamental vibration-rotation band at is the most significant absorption feature from O2 in the infrared (Timofeyev & Tonkov, 1978; Rinsland et al., 1982, 1989), yet it has not been previously incorporated into exoplanet spectral analyses for several reasons. Either CIAs were not included or incomplete/obsolete CIA databases were used. Also, the current version of HITRAN does not include CIAs at with other collision partners (O2-X). We include O2-X CIA features in our transmission spectroscopy simulations by parameterizing the O2-N2 CIA based on Rinsland et al. (1989) and the O2-CO2 CIA based on Baranov et al. (2004). Here we report that the O2-X CIA may be the most detectable O2 feature for transit observations. For a potential TRAPPIST-1e analogue system within 5 pc of the Sun, it could be the only O2 detectable signature with JWST (using MIRI LRS) for a modern Earth-like cloudy atmosphere with biological quantities of O2. Also, we show that the O2–X CIA would be prominent for O2-rich desiccated atmospheres (Luger & Barnes, 2015) and could be detectable with JWST in just a few transits. For systems beyond 5 pc, this feature could therefore be a powerful discriminator of uninhabited planets with non-biological ”false positive” O2 in their atmospheres - as they would only be detectable at those higher O2 pressures.
Main
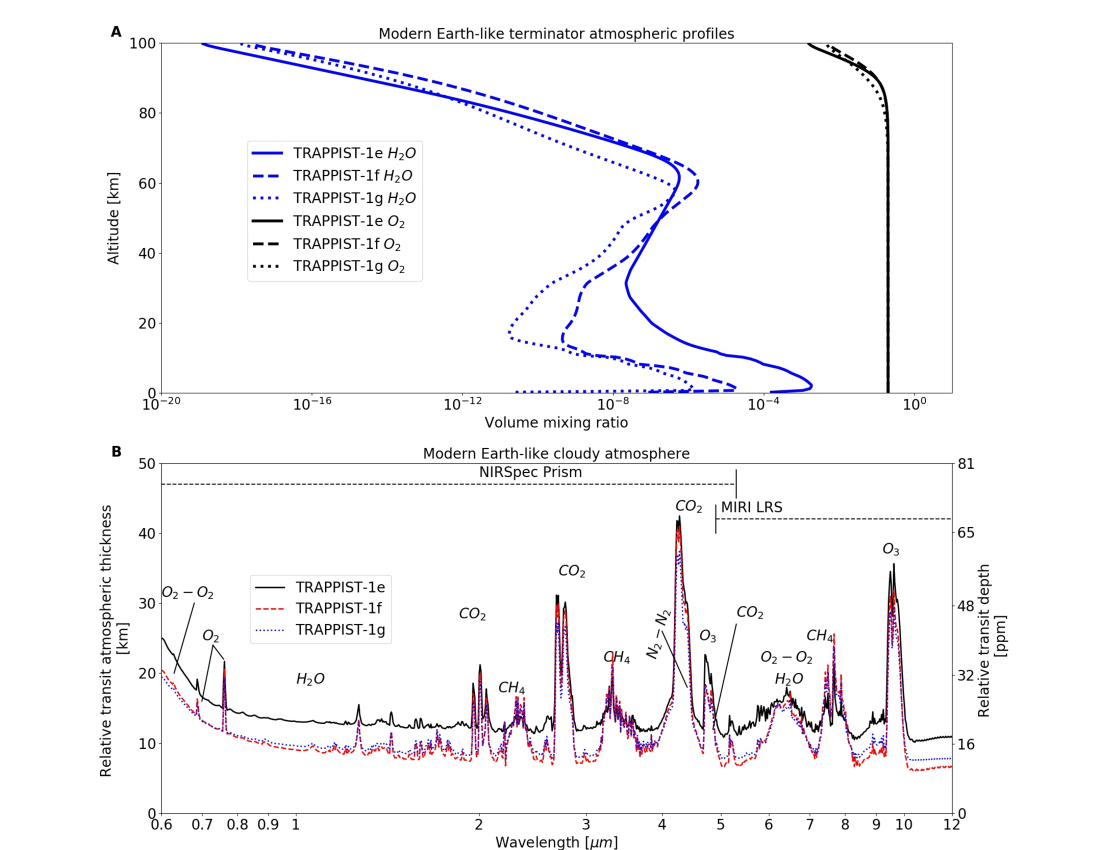
We study the strength of the O2-X CIA spectral signatures in exoplanets by computing synthetic spectra for various Earth-like atmospheres with the Planetary Spectrum Generator (PSG Villanueva et al. (2018)). The atmospheres are created with the LMD-G (Wordsworth et al., 2011) general circulation model (GCM) coupled with the Atmos (Arney et al., 2016) photochemical model (see Methods for details). We focus in particular on planets around M dwarfs such as TRAPPIST-1e. In fact, For modern Earth atmospheric conditions, the region is overlapped by a wide H2O absorption band. However, for a modern Earth-like atmosphere on a tidally locked planet in the HZ of an M dwarf, the terminator region is predicted to be fairly dry (see Supplementary Figure 2). Also, water is mostly confined in a small portion of the atmosphere near the surface and which is under the refraction limit and hidden by clouds (as on Earth, where the troposphere is wet and the stratosphere is dry). Near TOA, H2O is highly photodissociated (Supplementary Figure 2). The H2O signature in the transmission spectra of a habitable planet is therefore expected to be very weak (Lincowski et al., 2018; Lustig-Yaeger et al., 2019). While some trace gases such as NO2 and N2O also produce opacity in this spectral region, their concentrations are predicted to be orders of magnitude lower than those that would generate confounding impacts on the simulated spectra.
The TRAPPIST-1 system (Gillon et al., 2017), consisting of seven Earth-sized planets orbiting an ultra-cool dwarf star, will be a favorite target for atmospheric characterization with JWST due to its relatively close proximity to the Earth and the depth and frequency of its planetary transits. Therefore, we use TRAPPIST-1e as a case study for our simulated spectra. We employed the LMD-G (Wordsworth et al., 2011) general circulation model (GCM) and the Atmos photochemical model (Arney et al., 2016) to simulate TRAPPIST-1e with boundary conditions similar to modern Earth (Lincowski et al., 2018).
Figure 1 shows TRAPPIST-1e transmission spectra from 0.6 to 10 for various Earth-like atmospheres simulated with the Planetary Spectrum Generator (PSG, Villanueva et al. (2018)). The top panel shows the impact of cloud coverage on spectral features: clouds diminish the strength of all absorption features, but impact the strength of the O2-X feature much less strongly than they impact shorter wavelength O2 features like the O2 A–band or the 1.06 and 1.27 O2 CIA used in Misra et al. (2014) (who considered only clear-sky atmospheres). This is because water cloud opacity is stronger at short wavelengths. The middle panel compares the strength of the O2-X CIA band to the overlapping H2O absorption band near for a cloudy atmosphere. O2-X CIA strongly dominates the absorption in this wavelength range. The bottom panel shows how the strengths of O2 monomer and CIA absorption features scale as a function of the O2 atmospheric abundance for O2 levels ranging from 0.1 times the present atmospheric level of O2 (PAL) to 2 times PAL.
Our results show that the CIA feature appears to be about three times stronger than the 1.27 O2 CIA feature and is therefore the strongest O2 signature across the VIS/NIR/MIR spectrum.
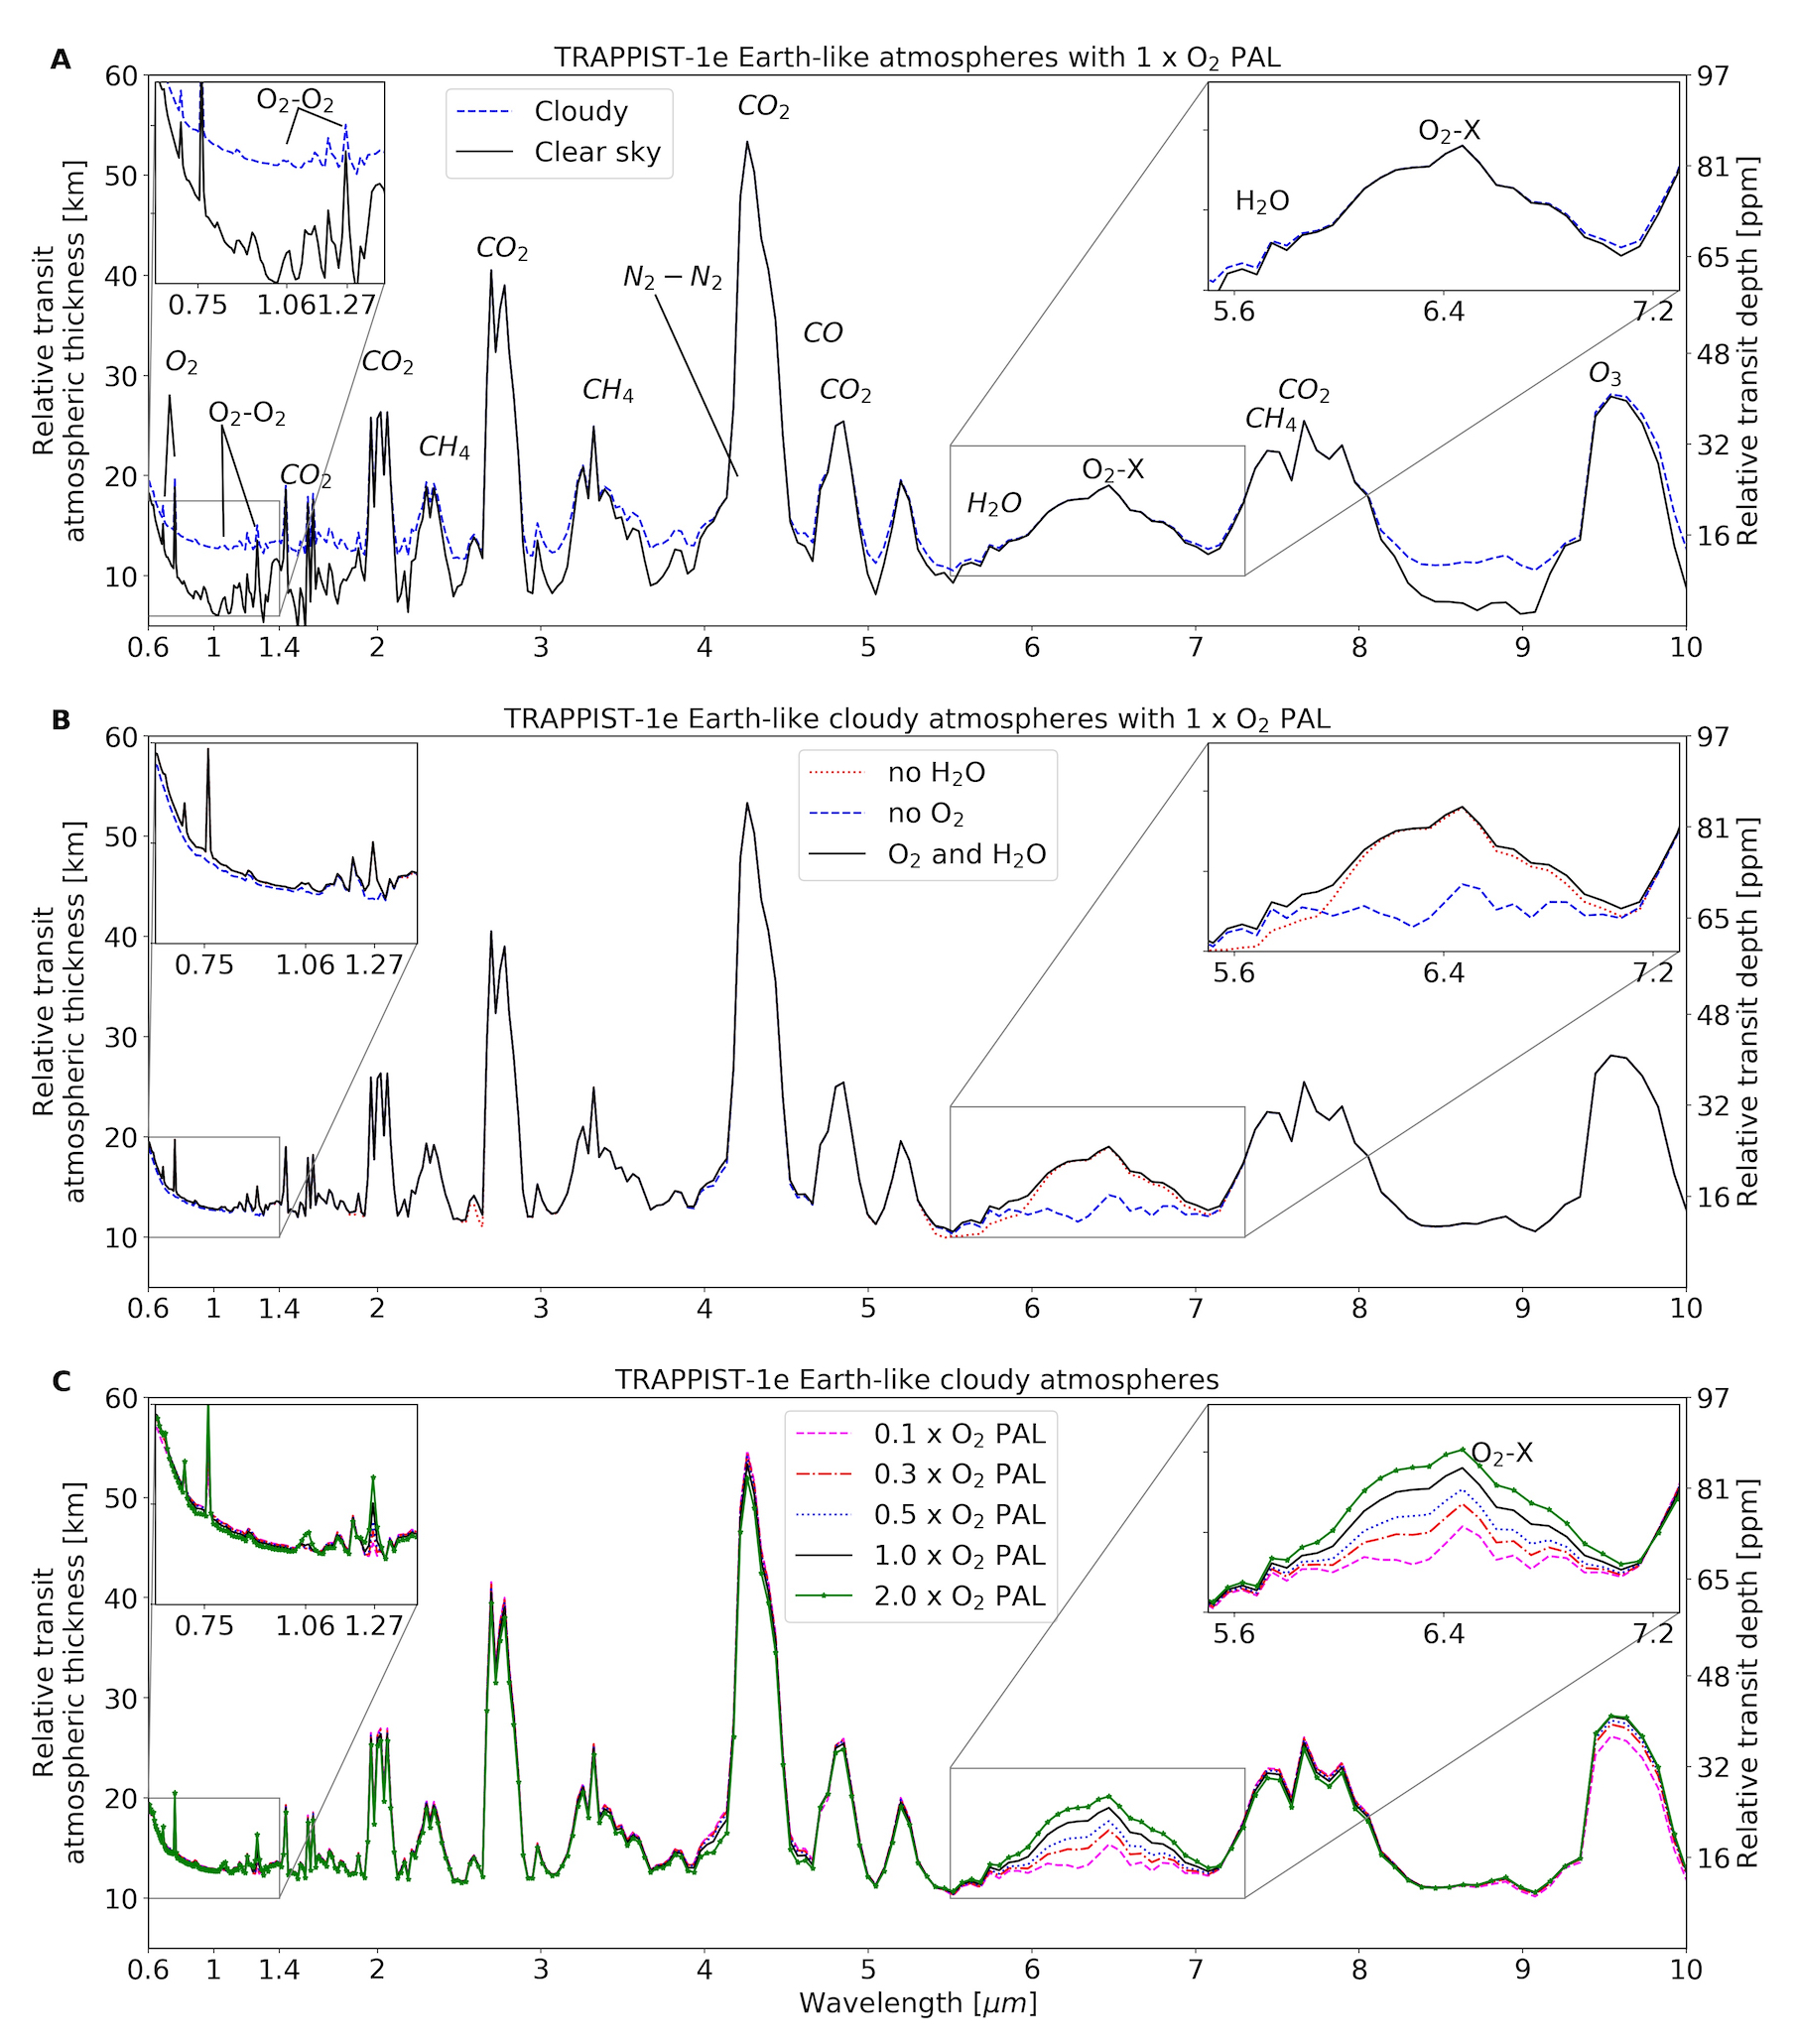
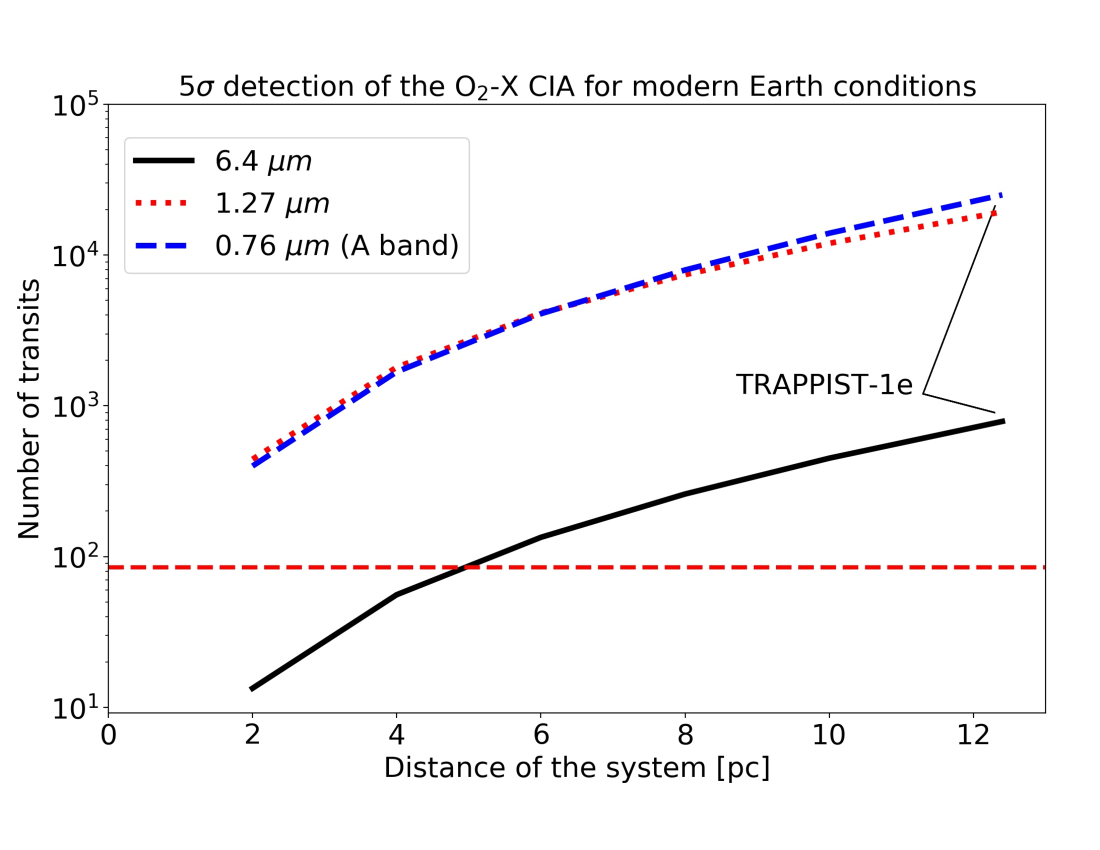
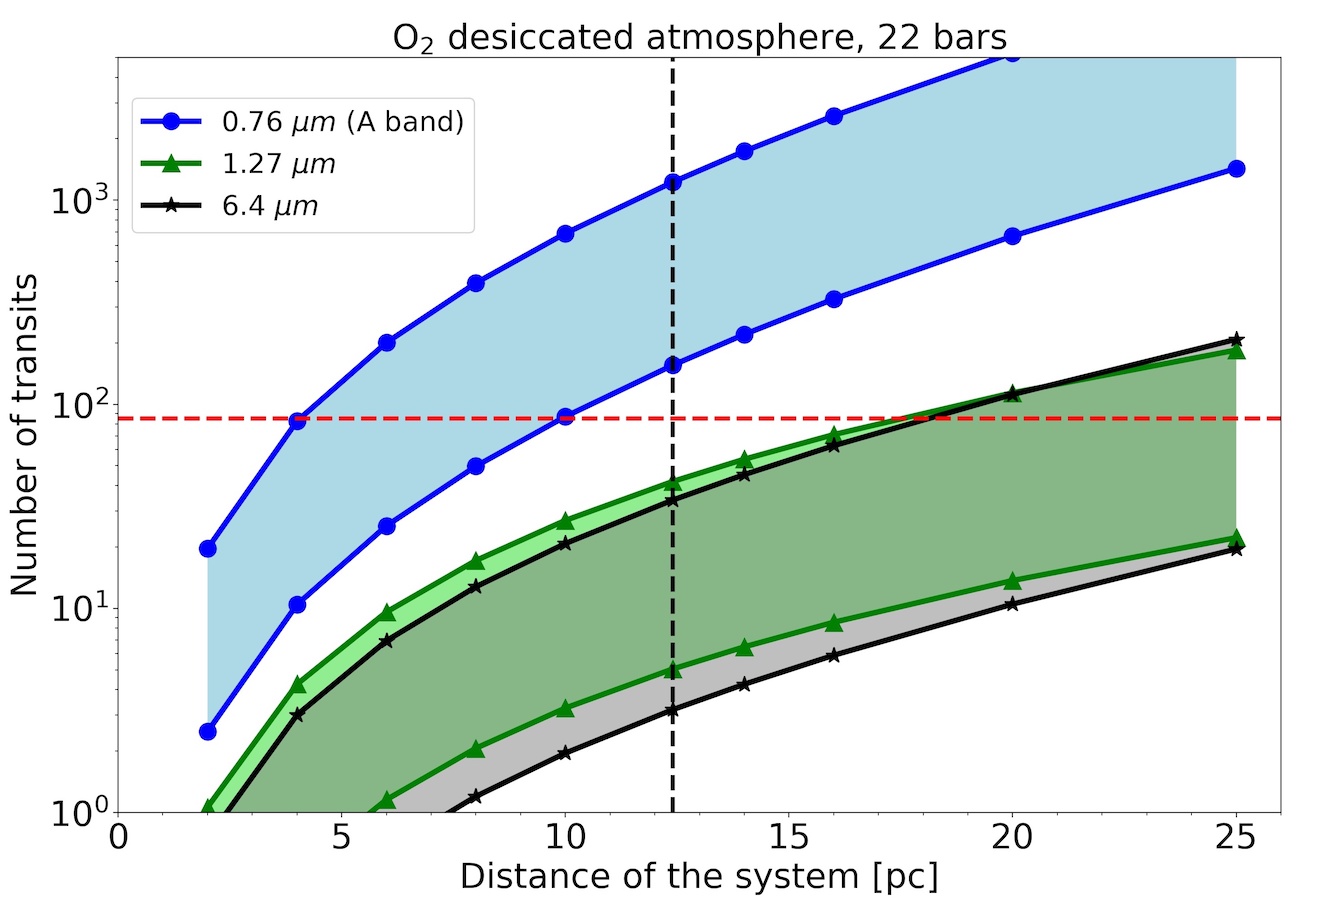
Figure 2 shows the number of TRAPPIST-1e transits needed to detect the O2 A–band, the O2-O2 CIA feature at 1.27 and the O2-X CIA feature at 6.4 features at a confidence level with JWST for a modern Earth-like cloudy atmosphere on TRAPPIST-1e orbiting a TRAPPIST-1-like star at distances from Earth ranging from TRAPPIST-1’s true distance (12.1 pc) down to 2 pc. We can see that the 6.4 O2-X CIA feature requires an order of magnitude fewer transits than the two other O2 features because of the stronger intrinsic O2-X CIA absorption at 6.4 and because cloud opacity is stronger at shorter VIS/NIR wavelengths. The horizontal dashed red line represents the 85 transits that will occur for TRAPPIST-1e during the 5.5 year nominal lifetime of JWST, thus sets up an upper limit on the number of transits observable. Because TRAPPIST-1e orbits a very small M8 star, it offers one of the best SNR a habitable planet can have and therefore represents a best-case scenario in terms of detectability. However, even in this context, none of the O2 features are detectable at at the distance of the TRAPPIST-1 system. However, the 6.4 O2-X CIA feature could be detectable at for an analogue system at star-Earth distance closer than 5 pc. Therefore, this simulation shows that the 6.4 O2-X CIA could be the only oxygen feature detectable with JWST for a cloudy modern Earth-like atmosphere for nearby hypothetical TRAPPIST-1 analogue systems.
The O2-X feature for oxygen could also potentially be used to detect non-habitable conditions, such as a desiccated atmosphere rich in bars of abiotic O2 generated from massive ocean loss (Wordsworth & Pierrehumbert, 2014; Luger & Barnes, 2015; Schwieterman et al., 2016; Meadows, 2017; Meadows et al., 2018; Lustig-Yaeger et al., 2019). Lincowski et al. (2018) have shown that for an assumed original water content of 20 Earth oceans (by mass), the TRAPPIST-1e, f and g planets may have lost between 3 to 6 Earth oceans resulting in atmospheres with 22 and 5,000 bars of O2.
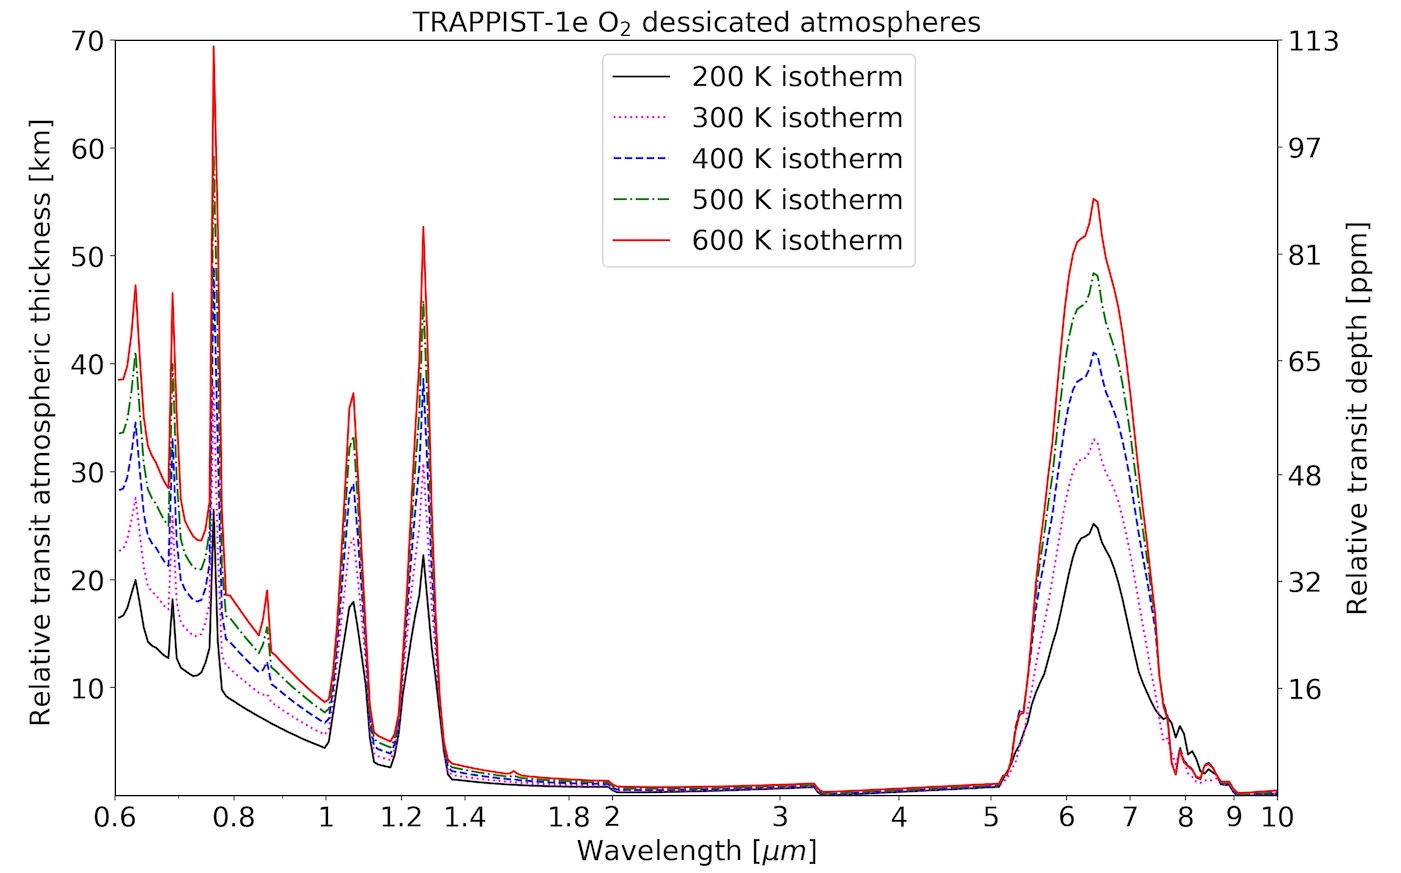
Figure 3 shows transit spectra for TRAPPIST-1e assuming conservative 1 bar O2-only desiccated and isothermal atmospheres ranging from 200 to 600 K. Relative transit depth (ppm, left Y-axis) is the transit depth produced by the atmosphere itself, which can be converted into relative transit atmospheric thickness (km, right Y-axis). These isothermal profiles allow us to test the sensitivity of oxygen spectral features on atmospheric temperature. The atmospheric scale height increases with temperature, and the largest features are seen for the highest temperatures. Note that O2-O2 CIA opacities in HITRAN are only provided in the 193 K–353 K temperature range. Therefore, for the isothermal profiles beyond 353 K we used the 353-K CIA coefficients.
We can see that the O2-O2 CIA feature is broad () and strong (40 to 90 ppm). The O2–O2 CIA feature reaches a similar relative transit depth but is comparatively narrower (widths of ). In addition, the continuum level for the shorter wavelengths is raised by Rayleigh scattering slope, reducing the NIR CIA relative transit depths to 50 to 80 ppm, respectively. Similarly, the O2 A–band reaches very high transit depths (up to 110 ppm) but on a high continuum, which reduces its relative strength down to 95 ppm.
The larger width of the O2-X CIA feature at allows us to bin down the data to a lower resolving power, improving the SNR and therefore compensating for a higher noise floor in the MIRI LRS range. Supplementary Table 1 presents the relative transit depth, 1 transit SNR and number of transits for 3 and 5 detections for TRAPPIST-1e assuming 1 and 22 bar desiccated atmosphere on TRAPPIST-1e and Supplementary Figure 3 is similar to Fig. 2 but for the 22 bar O2 desiccated and isothermal atmospheres.
Interpreting an O2 detection via the O2-O2 CIA band at will be strengthened by constraining the concentration of O2, and placing its presence in a broader atmospheric context. For HZ planets with a planet/star contrast comparable to TRAPPIST-1e and within 5 pc from the Sun, next-generation MIR observatories could detect O2 in concentrations similar to modern Earth using the O2-X feature. In combination with detections of other MIR features from CH4, H2O, or N2O, this would represent a strong biosignature with no known non-biological explanations (Des Marais et al., 2002). Note that there are 50 red dwarfs within 5 pc from the Sun (http://www.recons.org/TOP100.posted.htm).
For systems farther than about 5 pc and/or HZ planet orbiting earlier M dwarfs, JWST or future MIR observatories may be able to detect the O2-X feature only for O2 concentrations orders of magnitude higher than those on modern-day Earth that would be indicative of a desiccated, O2-rich, uninhabitable planet. Detection of this feature for planets within the habitable zone (Kasting et al., 1993; Kopparapu et al., 2013, 2014) will test the hypothesis that the high luminosity pre-main sequence phase M dwarfs endure can render even current HZ planets uninhabitable (Luger & Barnes, 2015). Finally, detection of this feature would answer the question of whether planets around M dwarfs can sustain an atmosphere.
Methods
Parameters for TRAPPIST-1e
Monomer and CIA pressure sensitivity
Monomer and CIA optical depths can be expressed by the following equations (Misra et al., 2014):
| (1) |
| (2) |
with and representing the monomer and CIA differential optical depths, respectively; and are the monomer and CIA cross sections, respectively; is the number density of the gas; P is the pressure; T is the temperature; and is the path length. is proportional to P and to , and this difference of sensitivity may be used to estimate the atmospheric pressure (Misra et al., 2014).
The atmospheric modeling
We use the Atmos (Arney et al., 2016) photochemical model to self-consistently simulate Earth-like atmospheres with a variety of O2 partial pressures on TRAPPIST-1e. The terminator temperature, gas mixing ratio, vapor and condensed water (liquid and ice) profiles have been provided from the LMD-G (Wordsworth et al., 2011) global climate model (GCM) simulations of a 1 bar TRAPPIST-1e modern Earth atmosphere. In Atmos, some of the N2 has been swapped for O2 to obtain various O2 PAL as shown in Fig. 1, both gases having no greenhouse effect except through pressure broadening or CIA, and 10,000 ppm of CO2 and 10 ppm of CH4 have been assumed. Due to the terminator atmospheric profiles varying with latitude, Atmos was used to calculate profiles for 98 latitude points, determined by the LMD-G latitude resolution.
Transmission spectra simulations
The planetary spectrum generator (PSG, Villanueva et al. (2018)) has been used to simulate JWST transmission spectra. PSG is an online radiative-transfer code that is able to compute planetary spectra (atmospheres and surfaces) for a wide range of wavelengths (UV/Vis/near-IR/IR/far-IR/THz/sub-mm/Radio) from any observatory, orbiter or lander and also includes a noise calculator.
To compute the noise, PSG takes into account the noise introduced by the source itself (Nsource), the background noise (Nback) following a Poisson distribution with fluctuations depending on with the mean number of photons received (Zmuidzinas, 2003), the noise of the detector (ND) and the noise introduced by the telescope (Noptics). The total noise being then . This represents therefore a photon limited situation where Nsource will largely dominate .
For the Earth-like atmospheres, spectra were obtained for each of the 98 Atmos photochemical simulations and an average spectrum was computed. For the 1 and 22 bar O2 desiccated atmospheres, isothermal profiles from 200 to 600 K were set up with 100% of O2, ignoring photochemistry. To calculate the SNR and the number of transits needed for 3 and 5 detection the resolving power has been optimized by adjusting the binning for each O2 feature to maximize its SNR. SNR is calculated using the highest value in the band minus the nearest continuum value (this value therefore differ between the VIS (Rayleigh slope), NIR and MIR). The number of transits needed to achieve a X detection is computed as the following equation:
| (3) |
with the confident level of value , Ni is the initial number of transit at which SNRi is computed. If SNRi is estimated from 1 transit then and the Eq. 3 could be simplified as:
| (4) |
O2-X collision-induced absorption at .
This feature is associated with the fundamental band of O2, and O2 collisions with other partners (e.g. N2, CO2) can produce additional absorption at these wavelengths. This collision with other gases can be generally written as O2-X, where ”X” refers to the collision partner. Laboratory measurements (Timofeyev & Tonkov, 1978; Thibault et al., 1997) and atmospheric analysis using Sun occultations (Rinsland et al., 1989) have revealed that nitrogen, the major constituent of modern Earth’s atmosphere at in volume, produces an O2–N2 absorption feature of a similar intensity as O2–O2 in the region. Carbon dioxide (CO2) can also produce an O2–CO2 feature at these wavelengths, though this feature is weak for modern Earth-like CO2 atmospheric abundances (approx. 400 ppm) but can be strong for exoplanets with CO2 rich atmospheres (Baranov et al., 2004). O2-X CIA can also be produced with H2O (Hopfner et al., 2012) as the collision partner due to the large electric dipole moment of H2O, but no laboratory measurements exist for this feature.
Parameterization of the 6.4 feature
While the region is known as the fundamental vibration-rotation band of O2, only the O2-O2 CIA band is included in HITRAN (Gordon et al., 2017). Knowing that Earth’s atmosphere is mostly composed of N2 and that the O2-N2 CIA have been shown to produce similar absorption to O2-O2 (Timofeyev & Tonkov, 1978; Rinsland et al., 1989; Thibault et al., 1997), it is important to include it in our simulations. We have parameterized the O2-N2 CIA in PSG assuming the same absorption efficiency as O2-O2 CIA (Rinsland et al., 1989) (see Supplementary Figure 1). For O2-CO2 CIA at , we used experimental data of Baranov et al. (2004) to include that feature in PSG.
References
- Arney et al. (2016) Arney, G., Domagal-Goldman, S. D., Meadows, V. S., et al. 2016, Astrobiology, 16, 873
- Baranov et al. (2004) Baranov, Y. I., Lafferty, W., & Fraser, G. 2004, J MOL SPECTROSC, 228, 432 , special Issue Dedicated to Dr. Jon T. Hougen on the Occasion of His 68th Birthday. http://www.sciencedirect.com/science/article/pii/S0022285204001390
- Des Marais et al. (2002) Des Marais, D. J., Harwit, M. O., Jucks, K. W., et al. 2002, Astrobiology, 2, 153
- Fauchez et al. (2017) Fauchez, T., Rossi, L., & Stam, D. M. 2017, ASTROPHYS J, 842, 41
- Gillon et al. (2017) Gillon, M., Triaud, A. H. M. J., Demory, B.-O., et al. 2017, Nature, 542, 456–460. https://doi.org/10.1038/nature21360
- Gordon et al. (2017) Gordon, I., Rothman, L., Hill, C., et al. 2017, J QUANT SPECTROSC RA, 203, 3 , hITRAN2016 Special Issue. http://www.sciencedirect.com/science/article/pii/S0022407317301073
- Grimm et al. (2018) Grimm, S. L., Demory, B.-O., Gillon, M., et al. 2018, ASTRON ASTROPHYS, 613, A68
- Hopfner et al. (2012) Hopfner, M., Milz, M., Buehler, S., Orphal, J., & Stiller, G. 2012, GEOPHYS RES LETT, 39, https://agupubs.onlinelibrary.wiley.com/doi/pdf/10.1029/2012GL051409
- Kasting et al. (1993) Kasting, J. F., Whitmire, D. P., & Reynolds, R. T. 1993, Icarus, 101, 108 . http://www.sciencedirect.com/science/article/pii/S0019103583710109
- Kopparapu et al. (2014) Kopparapu, R. K., Ramirez, R. M., SchottelKotte, J., et al. 2014, ASTROPHYS J, 787, L29. https://doi.org/10.1088%2F2041-8205%2F787%2F2%2Fl29
- Kopparapu et al. (2013) Kopparapu, R. K., Ramirez, R., Kasting, J. F., et al. 2013, ASTROPHYS J, 765, 131. http://stacks.iop.org/0004-637X/765/i=2/a=131
- Lincowski et al. (2018) Lincowski, A. P., Meadows, V. S., Crisp, D., et al. 2018, ASTROPHYS J, 867, 76
- Luger & Barnes (2015) Luger, R., & Barnes, R. 2015, Astrobiology, 15, 119
- Lustig-Yaeger et al. (2019) Lustig-Yaeger, J., Meadows, V. S., & Lincowski, A. P. 2019, ASTRON J, 158, 27. https://doi.org/10.3847%2F1538-3881%2Fab21e0
- Meadows (2017) Meadows, V. S. 2017, Astrobiology, 17, 1022, pMID: 28443722. https://doi.org/10.1089/ast.2016.1578
- Meadows et al. (2018) Meadows, V. S., Reinhard, C. T., Arney, G. N., et al. 2018, Astrobiology, 18, 630, pMID: 29746149. https://doi.org/10.1089/ast.2017.1727
- Misra et al. (2014) Misra, A., Meadows, V., Claire, M., & Crisp, D. 2014, Astrobiology, 14, 67
- Pallé et al. (2009) Pallé, E., Zapatero Osorio, M. R., Barrena, R., Montañés-Rodríguez, P., & Martín, E. L. 2009, Nature, 459, 814
- Rinsland et al. (1982) Rinsland, C. P., Smith, M. A. H., Seals Jr., R. K., et al. 1982, J GEOPHYS RES-OCEANS, 87, 3119
- Rinsland et al. (1989) Rinsland, C. P., Zander, R., Namkung, J. S., Farmer, C. B., & Norton, R. H. 1989, J GEOPHYS RES-ATMOS, 94, 16303
- Schwieterman et al. (2016) Schwieterman, E. W., Meadows, V. S., Domagal-Goldman, S. D., et al. 2016, ASTROPHYS J, 819, L13
- Snellen et al. (2013) Snellen, I. A. G., de Kok, R. J., le Poole, R., Brogi, M., & Birkby, J. 2013, ASTROPHYS J, 764, 182. https://doi.org/10.1088%2F0004-637x%2F764%2F2%2F182
- Thibault et al. (1997) Thibault, F., Menoux, V., Doucen, R. L., et al. 1997, APPL OPTIC, 36, 563. http://ao.osa.org/abstract.cfm?URI=ao-36-3-563
- Timofeyev & Tonkov (1978) Timofeyev, Y., & Tonkov, M. 1978, lzv. Acad. Sci. USSR Atmos. Ocean. Phys., Engl. Transl., 14, 614
- Villanueva et al. (2018) Villanueva, G. L., Smith, M. D., Protopapa, S., Faggi, S., & Mandell, A. M. 2018, J QUANT SPECTROSC RA, 217, 86
- Wordsworth & Pierrehumbert (2014) Wordsworth, R., & Pierrehumbert, R. 2014, ASTROPHYS J, 785, L20
- Wordsworth et al. (2011) Wordsworth, R. D., Forget, F., Selsis, F., et al. 2011, ASTROPHYS J LETT, 733, L48
- Zmuidzinas (2003) Zmuidzinas, J. 2003, APPL OPTIC, 42, 4989. http://ao.osa.org/abstract.cfm?URI=ao-42-25-4989
Data availability
The data that support the plots within this paper and other findings of this study are available from the corresponding author upon reasonable request.
Code availability
Atmos (Arney et al., 2016) is available upon request from Giada Arney (giada.n.arney@nasa.gov); LMD-G (Wordsworth et al., 2011) is available upon request from Martin Turbet (martin.turbet@lmd.jussieu.fr); PSG (Villanueva et al., 2018) is available on https://psg.gsfc.nasa.gov/.
Acknowledgements
T. Fauchez, G. Villanueva, G. Arney, R. Kopparapu, A. Mandell and S. Domagal-Goldman acknowledge support from GSFC Sellers Exoplanet Environments Collaboration (SEEC), which is funded in part by the NASA Planetary Science Divisions Internal Scientist Funding Model.
This project has received funding from the European Union’s Horizon 2020 research and innovation program under the Marie Sklodowska-Curie Grant Agreement No. 832738/ESCAPE.
This work was also supported by the NASA Astrobiology Institute Alternative Earths team under Cooperative Agreement Number NNA15BB03A and the NExSS Virtual Planetary Laboratory under NASA grant number 80NSSC18K0829. E.W.S. is additionally grateful for support from the NASA Postdoctoral Program, administered by the Universities Space Research Association. We thank Ha Tran for useful discussions related to O2-X CIAs. Finally, we would like to thank the two anonymous referees for comments that greatly improved our manuscript.
Author contributions
T.J.F. led the photochemistry and transmission spectroscopy simulations. G.L.V, E.W.S and M.T. derived parameterizations of the O2-N2 and O2-CO2 CIAs bands. T.J.F and G.A. wrote most of the manuscript. Every author contributed to the discussions and to the writing of the manuscript.
Reviewer information
The authors declare no competing financial interests. Readers are welcome to comment on the online version of the paper.
Competing interest
The authors declare no competing financial interests.
Supplementary materials
Overview of previous works on O2 spectral features for exoplanet’s studies.
Because O2 is one of the most detectable and robust indicators of global biological activity, concepts for telescopes that would attempt to search for life on exoplanets all include the ability to detect O2 or its photochemical byproduct, O3. O2 absorbs at several wavelengths in the visible (VIS) at 0.63, 0.69 and 0.76 and near-infrared (NIR) at 1.27 . The O2 A–band at 0.76 has often been considered the most viable spectral feature for oxygen detection in transmission (Snellen et al., 2013) and reflectance spectra (Fauchez et al., 2017). Snellen et al. (2013) showed that it could be possible to detect the O2 A–band in the atmosphere of an Earth twin with the future Extremely Large Telescopes (ELTs). However large unknowns remain to disentangle the exoplanet O2 signal the from the telluric O2. Meanwhile, Pallé et al. (2009) showed that O2–O2 collision induced absorption (CIA) features at 1.06 and 1.27 were present in Earth’s transmission spectrum during lunar eclipse and produce more absorption than the O2 A–band monomer feature. CIA features are produced through inelastic collisions in a gas. In the case of the O2–O2 CIA features, the two O2 molecules interact forming transient multipole-induced dipoles producing broad spectral features distinct from the individual underlying O2 molecule. Misra et al. (2014) showed that the 1.06 and 1.27 O2–O2 CIA features may be detectable (for SNR 3) with the James Webb Space Telescope (JWST) for an Earth analogue orbiting an M5V star at a distance of 5 pc. Schwieterman et al. (2016) proposed that the 1.06 and 1.27 transit features could be used to identify the high O2 partial pressures predicted to be associated with abiotic O2 atmospheres, which should be significantly higher than for the modern Earth case. More recently, Lustig-Yaeger et al. (2019) have shown that the 1.06 and 1.27 O2 CIA features could be detectable with JWST at a SNR of 5 in just few transits for the TRAPPIST-1 planets with O2 desiccated and dense (10 and 100 bars) atmospheres.
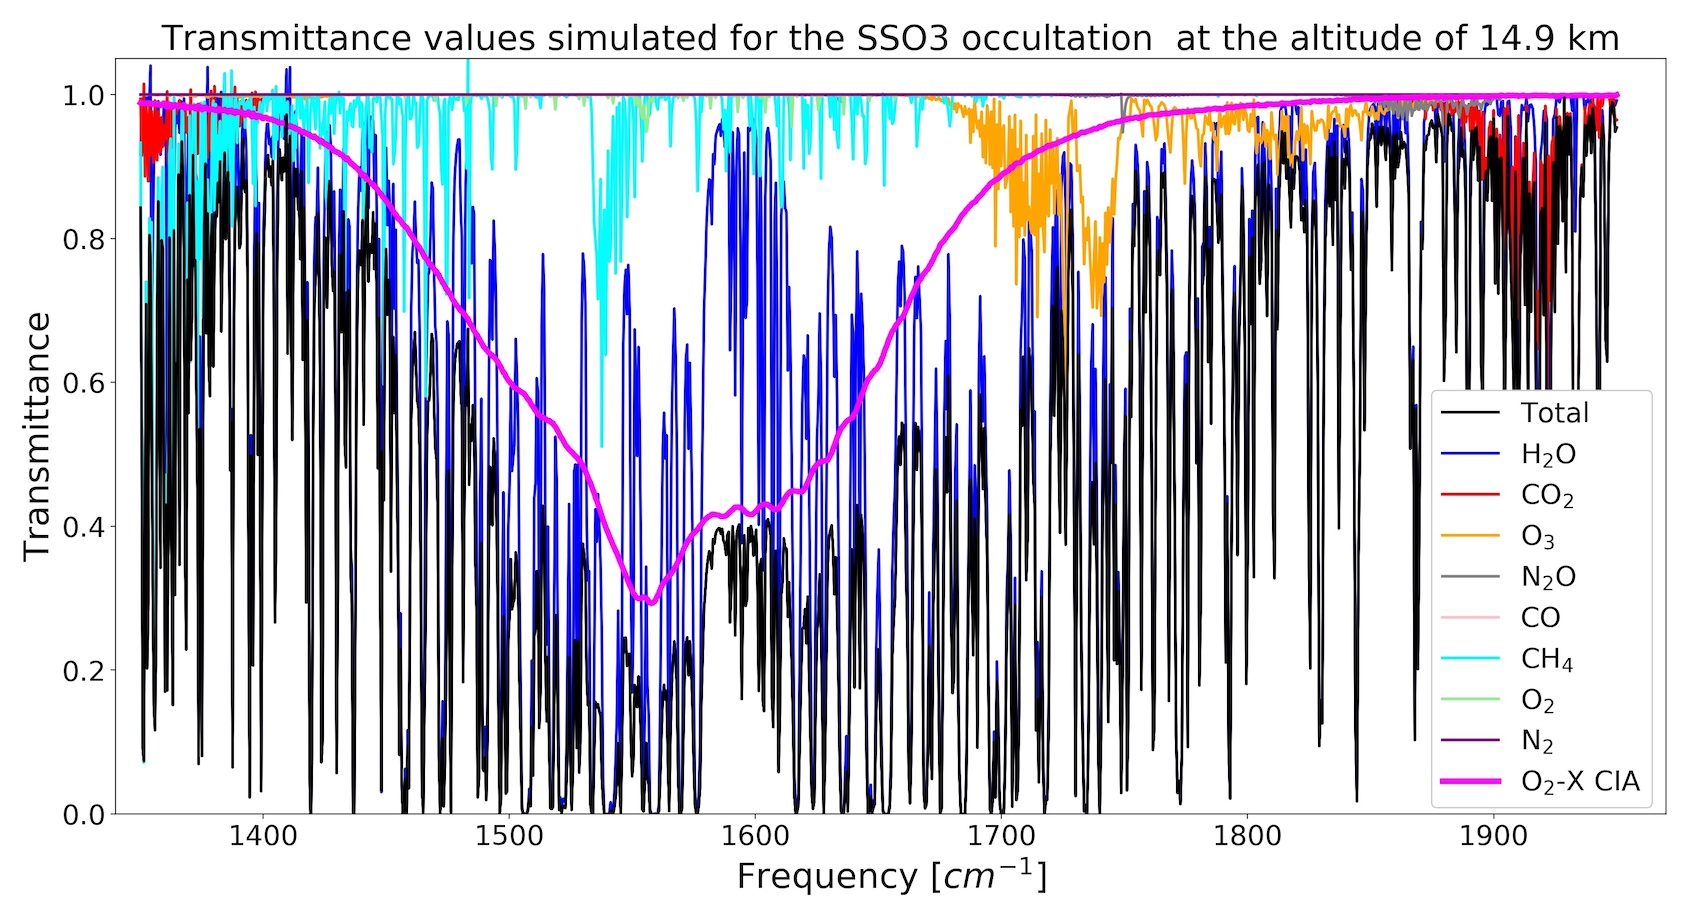
Supplementary Figure 1 shows the simulation of the Sun occultation SSO3 observed by Rinsland et al. (1989) (figure 3) on April 30, 1985, at an altitude of 14.9 km (13 km over the Himalayas). Our simulation and the observation data are in very good agreement, showing the validity of our O2-X CIA parameterization at 6.4 .
Supplementary Figure 2 shows the terminator H2O and O2 atmospheric profiles with a modern Earth-like atmosphere composition for TRAPPIST-1 planets in the habitable zone, namely 1e, 1f and 1g (top panel) and their transmission spectrum with clouds included (bottom panel). Boundary conditions for the photochemistry are those described in Lincowski et al. (2018) Table 8. We can see that the terminator region is very dry, with volume mixing ratios near the surface reaching the maximum value for TRAPPIST-1e decreasing down to for 1g. However, as we can see in the spectra this region of maximum H2O concentration is below the continuum level because of clouds and atmospheric refraction. Note that above km H2O is strongly photodissociated. As a results, the contribution of H2O at is very largely dominated by the O2-X CIA and this domination increase for dryer planets TRAPPIST-1f and 1g.
Supplementary Figure 3 is similar to Fig. 2 but for the 22 bar O2 desiccated and isothermal atmospheres presented in Table 1. We can see that the O2-O2 CIA and O2-X CIA features require significantly fewer transits than the O2 A–band monomer band and would be detectable at up to about 25 pc (except for the coldest isothermal atmosphere beyond 20 pc). Note that in the case of a desiccated, O2-rich planet with aerosols, the band would require significantly fewer transits than the for the same reasons as for the habitable case.
Supplementary Table 1 presents the relative transit depth, 1 transit SNR and number of transits for 3 and 5 detections for TRAPPIST-1e assuming 1 and 22 bar desiccated atmosphere on TRAPPIST-1e. 22 bars is based on a conservative estimate of O2 retention by Lincowski et al. (2018). We can see that the difference in transit depth between the 1 and 22 bar cases increase with temperature (because the refraction limit is at higher pressures) and that the strength of O2 A–band is relatively insensitive to pressure. The O2-X CIA feature at 6.4 requires fewer transits to achieve 3 or 5 detection and is therefore the most promising indicator of a massive O2 desiccated atmosphere potentially observable with JWST.
| Feature | A–band | O2-O2 | O2-O2 | O2-X |
|---|---|---|---|---|
| Wavelength [] | 0.76 | 1.06 | 1.27 | 6.4 |
| R | 100 | 40 | 20 | 10 |
| Temperature | 200 K | |||
| Depth [ppm] | 44–44 | 38–37 | 42–41 | 67–66 |
| SNR-1 | 0.25–0.25 | 0.66–0.65 | 1.16–1.14 | 1.33–1.31 |
| N transits () | (-) | 57–59 | 19–19 | 14–15 |
| N transits () | (-) | 21–21 | 7–7 | 5–5 |
| Temperature | 300 K | |||
| Depth [ppm] | 68–68 | 52–62 | 57–71 | 88–107 |
| SNR-1 | 0.39–0.39 | 0.90–1.07 | 1.59–1.98 | 1.75–2.13 |
| N transits () | (-) | 31–22 | 10–7 | 8–6 |
| N transits () | 59–59 | 11–8 | 4–3 | 3–2 |
| Temperature | 400 K | |||
| Depth [ppm] | 91–99 | 63–88 | 71–107 | 110–162 |
| SNR-1 | 0.52–0.57 | 1.10–1.54 | 1.97–2.97 | 2.18–3.22 |
| N transits () | 93–77 | 21–11 | 6–3 | 5–2 |
| N transits () | 33–28 | 7–4 | 2–1 | 2–1 |
| Temperature | 500 K | |||
| Depth [ppm] | 114–127 | 74–108 | 83–132 | 129–197 |
| SNR-1 | 0.65–0.73 | 1.28–1.88 | 2.31–3.65 | 2.56–3.91 |
| N transits () | 59–47 | 15–7 | 5–2 | 4–2 |
| N transits () | 21–17 | 6–3 | 2–1 | 1–1 |
| Temperature | 600 K | |||
| Depth [ppm] | 137–156 | 83–136 | 95–174 | 147–264 |
| SNR-1 | 0.79–0.89 | 1.44–2.37 | 2.63–4.83 | 2.93–5.23 |
| N transits () | 40–32 | 12–5 | 4–1 | 3–1 |
| N transits () | 14–12 | 4–2 | 1 | 1–1 |
References
- Fauchez et al. (2017) Fauchez, T., Rossi, L., & Stam, D. M. 2017, ASTROPHYS J, 842, 41
- Lincowski et al. (2018) Lincowski, A. P., Meadows, V. S., Crisp, D., et al. 2018, ASTROPHYS J, 867, 76
- Lustig-Yaeger et al. (2019) Lustig-Yaeger, J., Meadows, V. S., & Lincowski, A. P. 2019, ASTRON J, 158, 27. https://doi.org/10.3847%2F1538-3881%2Fab21e0
- Misra et al. (2014) Misra, A., Meadows, V., Claire, M., & Crisp, D. 2014, Astrobiology, 14, 67
- Pallé et al. (2009) Pallé, E., Zapatero Osorio, M. R., Barrena, R., Montañés-Rodríguez, P., & Martín, E. L. 2009, Nature, 459, 814
- Rinsland et al. (1989) Rinsland, C. P., Zander, R., Namkung, J. S., Farmer, C. B., & Norton, R. H. 1989, J GEOPHYS RES-ATMOS, 94, 16303
- Schwieterman et al. (2016) Schwieterman, E. W., Meadows, V. S., Domagal-Goldman, S. D., et al. 2016, ASTROPHYS J, 819, L13
- Snellen et al. (2013) Snellen, I. A. G., de Kok, R. J., le Poole, R., Brogi, M., & Birkby, J. 2013, ASTROPHYS J, 764, 182. https://doi.org/10.1088%2F0004-637x%2F764%2F2%2F182