Nematic correlation length in iron-based superconductors probed by inelastic x-ray scattering
Abstract
Nematicity is ubiquitous in electronic phases of high- superconductors, particularly in the Fe-based systems. We used inelastic x-ray scattering to extract the temperature-dependent nematic correlation length from the anomalous softening of acoustic phonon modes in FeSe, underdoped Ba(Fe0.97Co0.03)2As2 and optimally doped Ba(Fe0.94Co0.06)2As2. In all cases, we find that is well described by a power law extending over a wide temperature range. Combined with the previously reported Curie-Weiss behavior of the nematic susceptibility, these results point to the mean-field character of the nematic transition, which we attribute to a sizable nemato-elastic coupling that is likely detrimental to superconductivity.
The lowering of a high-temperature crystal structure symmetry from tetragonal (fourfold) to orthorhombic (twofold) can be driven by a lattice instability, by a density-wave, or by electronic correlations. In the latter case, since translational symmetry is preserved, the orthorhombic phase is called nematic, in analogy with liquid crystals Fradkin et al. (2010). Even though in this case the lattice is not the driving force behind nematicity, it responds to nematic order and nematic fluctuations due to the coupling to the electronic degrees of freedom Bohmer_Electronicnematicsusceptibility-2016; Fernandes et al. (2014). Indeed, the lowering of the symmetry of the electronic state from fourfold to twofold leads to an orthorhombic atomic lattice distortion, while nematic fluctuations soften the relevant elastic constants Fernandes et al. (2010). In many Fe-based superconductors, such as doped BaFe2As2, nematicity is believed to arise as a vestigial order of the stripe spin-density wave state that sets in at a lower temperature and selects one of two orthogonal wave-vectors related by a rotation Fang et al. (2008); Xu et al. (2008); Paglione and Greene (2010); Fernandes et al. (2012). An exception may be FeSe, where nematic order sets in at 90K, but magnetic order does not form at any temperature at ambient pressure McQueen et al. (2009); Mizuguchi and Takano (2010); Johnston (2010), although antiferromagnetic (AFM) order appears under pressure Böhmer et al. (2019). The origin of nematic order in FeSe remains a topic of intense debate Baek et al. (2015); Böhmer et al. (2015); Wang et al. (2016); Fanfarillo et al. (2016); Chen et al. (2019).
The impact of the electron-phonon coupling on the electronic orders of Fe-based superconductors has been investigated in different contexts. Density functional theory predicts weak coupling of phonons to electronic charge fluctuations, but significant magnetoelastic coupling of some optic phonons Boeri et al. (2008); Yin et al. (2008). Experiments showed weaker effects but agreed qualitatively with these predictions Reznik et al. (2009); Murai et al. (2016). Transverse acoustic (TA) phonons dispersing in the [100] direction exhibit the strongest experimentally observed electron-phonon coupling. They soften with temperature () on approach to the orthorhombic distortion of the atomic lattice in the nematic phase Niedziela et al. (2011). Quantitative analysis of this softening allows extracting the nematic correlation length Weber et al. (2018). In optimally-doped Ba(Fe0.94Co0.06)2As2 increases upon cooling in the tetragonal phase but is suppressed inside the superconducting phase of the optimally doped compound Weber et al. (2018). However, in previous work only small reduced wavevector () phonons were considered and due to the tilted and broad resolution ellipsoid of the neutron scattering experiments, a more quantitative analysis of the dependence of was not possible. Furthermore, that study focused only on one compound, not addressing universality of the observed behavior.
Here we compare the T-dependence of in FeSe and underdoped Ba(Fe1-xCox)2As2 (UD Ba-122), whose doping level () was chosen such that its structural transition temperature was close to that of FeSe. In addition, we performed detailed measurements of an optimally-doped Ba(Fe0.94Co0.06)2As2 (OP Ba-122) sample, reaching larger wave-vectors than in the previous study. To achieve better wave-vector resolution with larger scattering intensity, we used inelastic x-ray scattering instead of neutron scattering. We find a striking similarity between all three compounds, despite their rather different ground states. Most importantly, we find that the T-dependence of in FeSe and underdoped and optimally doped Ba(Fe1-xCox)2As2 is very well described by . Combined with the Curie-Weiss behavior observed in , our results point to a mean-field behavior with fluctuations extending to rather high temperatures above the structural transition temperature, . We attribute this mean-field behavior to the coupling to the lattice, which is known theoretically to change the universality class of the nematic transition from Ising-like to mean-field due to the long-range nematic interactions mediated by strain fluctuations. The implications of our results for the emergence of superconductivity are discussed.
Measurements were performed on the RIKEN BL43LXU beamline at SPring-8, Japan Baron (2010) and on the 30-ID HERIX beamline at the Advanced Photon Source (APS), Argonne National Laboratory, USA Toellner et al. (2011); Said et al. (2011); Sinn (2001). At SPring-8 the photon energy used was 21.747 keV, while at APS the photon energy was 23.724 keV. A 2-Dimensional analyzer array at BL43LXU allowed parallel measurement of multiple transverse momentum transfers (see discussions in Refs. Baron (2019, 2009), see also Ref. Baron (2015)). See supplementary material for further experimental details.
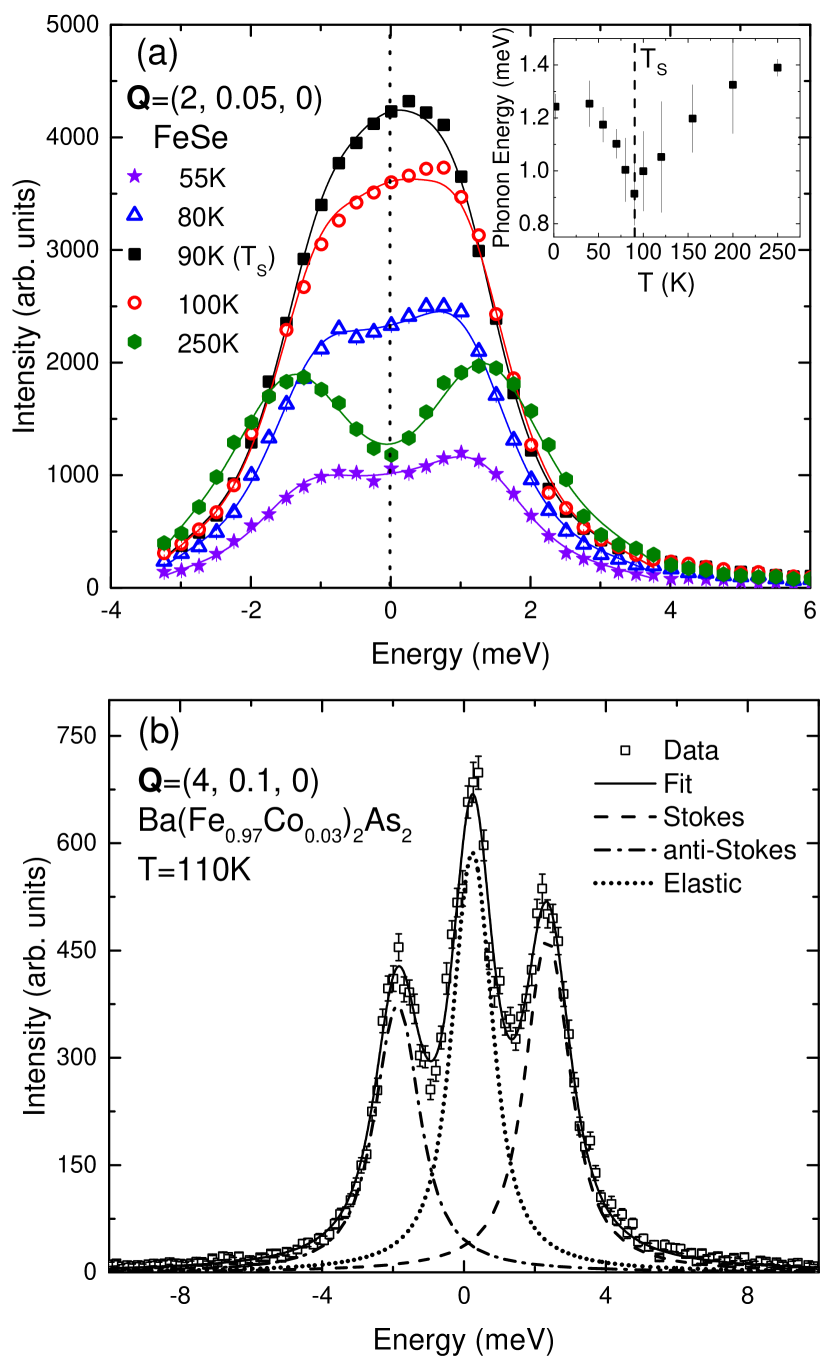
The phonon softening is clearly seen in figure 1a as the separation between energy loss and energy gain peaks decreases and the intensity increases upon cooling towards . The trend reverses upon further cooling. For quantitative analysis the three free fit parameters were: The phonon peak intensity, the elastic intensity (not shown and not used in our analysis), and the phonon energy. At the phonon intensity was fixed by taking the intensity at the same temperature at and using the relationship that the Bose factor corrected intensity of small acoustic phonons is inversely proportional to the phonon energy Shirane et al. (2002). This left only two fitting parameters, which allowed us to fit low data where the peaks are not visibly separated. Fig. 1 shows examples of overall fits at each temperature. Figure 1b, where the peaks are well-separated, shows the individual contributions of the elastic peak plus the Stokes and anti-Stokes phonon peaks. The phonon energy at in FeSe as a function of temperature is similar to the expected behavior of the shear modulus from mean field theory Bohmer_Electronicnematicsusceptibility-2016 (inset of Fig. 1a), which cannot otherwise be observed below by 3-point bending or resonant ultrasound experiments due to twinning in the sample.
As shown in Ref. Weber et al. (2018), the phonon energy as a function of momentum transfer, , is related to the nematic correlation length according to:
| (1) |
Here, is the density of the material, the bare shear modulus is given by and the renormalized shear modulus by . The latter is related to the former according to , where is the nemato-elastic coupling constant and is the uniform (i.e. ) nematic susceptibility Fernandes et al. (2010). The function is the unrenormalized dispersion, which must vanish linearly with as . To fit the data over a wider region of the Brillouin zone, we here use the phenomenological form . The fitting parameter controls the periodicity of the sine function used for a generic acoustic phonon dispersion. It is fixed by fitting the dispersion at high temperature, where there is little -dependent phonon softening. In the long wavelength limit, , as used in Ref. Weber et al. (2018).
For our fitting procedure, the renormalized shear modulus, is taken from previously reported Young’s modulus normalized to its high temperature value at 250 K (FeSe) and 293 K (UD Ba-122) Böhmer et al. (2015). The temperature dependence of is dominated by that of if the latter is small, which is the case near the nematic-structural phase transition Böhmer et al. (2014).
Extracting the bare shear modulus is more complicated, because it requires a complete absence of nematic fluctuations, which is rarely the case in samples displaying a structural transition. Indeed, in SrFe2As2, lattice softening closely match magnetic fluctuations, which persist well above Parshall et al. (2015). Similarly, the measured shear modulus in Ba(Fe1-xCox)2As2 varies significantly with doping Yoshizawa et al. (2012). From these observations we conclude that nematic fluctuations in both materials may significantly affect the phonon energy even at room temperature.
To circumvent this issue, we use the shear modulus reported for highly overdoped Ba(Fe0.745Co0.245)2As2 in Ref. Yoshizawa et al. (2012) to fix the bare shear modulus, , for the UD Ba-122 sample. Thus, we are assuming that the highly overdoped sample does not manifest significant nematic fluctuations at any temperature. We take the renormalized shear modulus, , from the 3.7% Co-doped sample reported in the same reference, which is the closest doping level to our sample reported in Ref. Yoshizawa et al. (2012).
Because for FeSe there is, to our knowledge, no equivalent sample from which to estimate the bare shear modulus, we use the same bare shear modulus as that of Ba(Fe0.745Co0.245)2As2 in Ref. Yoshizawa et al. (2012) and fix the ratio by taking the reported data for Ba(Fe0.963Co0.037)2As2. To extend this to the general for FeSe, we use the reported data on FeSe presented in Ref. Böhmer et al. (2015) (see Ref. Weber et al. (2018) for a discussion of the relation between and ). This procedure fixes both the bare and the renormalized shear modulus at all temperatures above . Thus, all parameters are fixed except the nematic correlation length .
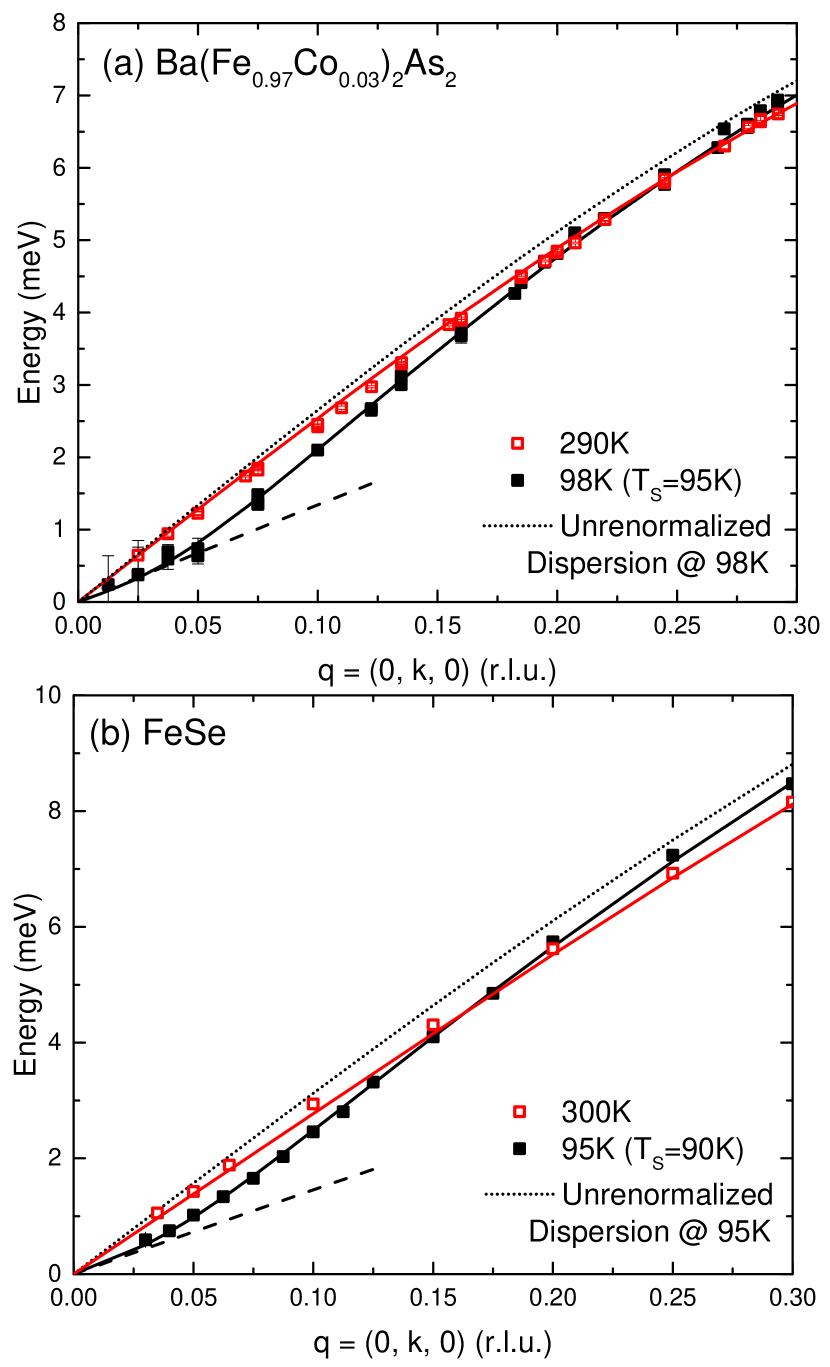
Fig. 2 shows the fitted phonon dispersion (solid lines) in (a) UD Ba-122 at K and K (K) and (b) in FeSe at K and K (K). The dashed line represents obtained by setting . It extrapolates the dispersion at low and demonstrates the correspondence between the shear modulus and the low- phonon dispersion (black solid lines in Fig. 2). The dotted line corresponds to zero coupling between the atomic lattice and the electronic degrees of freedom (i.e. by setting , ).
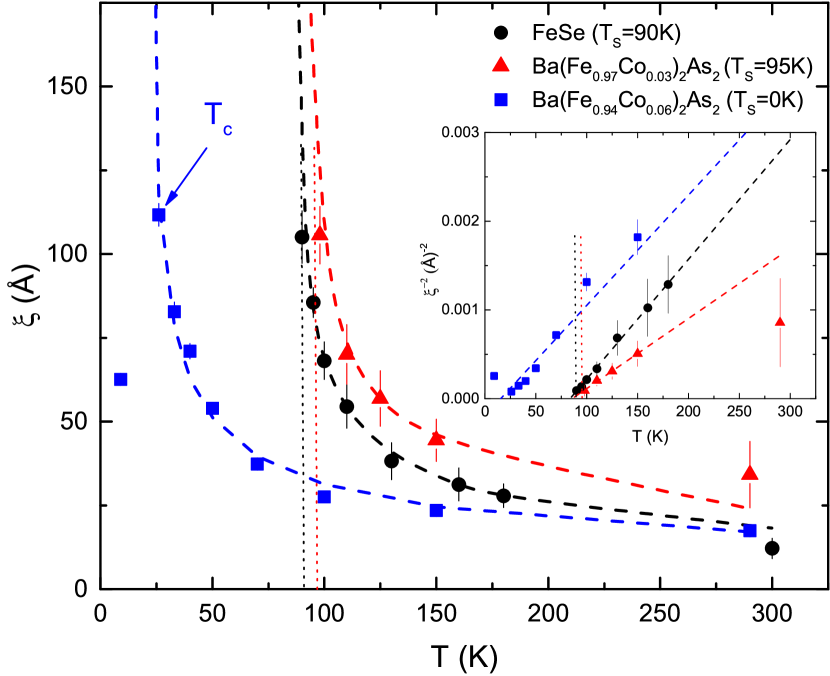
The fitted values for nematic correlation length above the superconducting transition temperature, , shown in Fig. 3 are nonzero already at high temperature and rapidly increase on approach to the structural transition. A power-law fit for vs. using yields values of K for FeSe, K for UD Ba-122 and K for OP Ba-122 (Fig. 3). Note that only the data above were fit for OP Ba-122, since the increase in nematic correlation length on cooling is reversed by superconductivity Weber et al. (2018). The inset in Fig. 3 demonstrates the universal power-law behavior with the -intercepts at K for FeSe, K for UD Ba-122 and K for OP Ba-122. A fit allowing the exponent to vary freely yields values of for FeSe, for UD Ba-122 and for OP Ba-122, with no significant effect on the fit quality or values of , thus we fixed =1/2. The values of of the free fit are all close to 1/2 considering the experimental uncertainty. Note that the total uncertainty for FeSe should be greater than the purely statistical error in the fit, because of additional uncertainty in the unrenormalized dispersion as discussed above.
Our results have important implications. Previous measurements of the uniform nematic susceptibility via elasto-resistance Kuo et al. (2016); Watson et al. (2015), Raman spectroscopy Gallais et al. (2013); Thorsmølle et al. (2016), NMR Kissikov et al. (2017), and elastic moduli Yoshizawa et al. (2012); Böhmer et al. (2014) in a variety of different compounds reported a Curie-Weiss behavior , with a Curie-Weiss temperature close to the actual structural transition temperature and . Although that behavior is consistent with a mean-field transition, the character of the transition can only be established by probing a second independent critical exponent. Our measurements in two different families of iron-based compounds and at different regimes (underdoped and optimally doped) reveal a clear power-law behavior , with very close to and . Although the precise determination of actual critical exponents would require careful measurements over a few temperature decades near , this set of results suggest that over a wide temperature range the two independent critical exponents and are those of a mean-field critical point.
We obtain at optimal doping, which means that the quantum critical point where =0 would be actually at a somewhat higher doping. This is consistent with the previously observed back-bending of the transition line inside the superconducting dome Nandi et al. (2010). This behavior is analogous to copper oxide superconductors where the quantum critical point appears in the overdoped part of the phase diagram (see Tallon et al. (2019) and references therein).
Since the nematic order parameter is Ising-like Fernandes et al. (2010), it is interesting to understand why the mean-field behavior extends over such a wide temperature range above , without seemingly crossing over to an Ising critical behavior. Recent theoretical investigations suggest that the reason is the coupling to the lattice – more specifically, to the acoustic phonons Karahasanovic and Schmalian (2016); Paul and Garst (2017); de Carvalho and Fernandes (2019). In real space, these modes mediate long-range interactions between the Ising-nematic degrees of freedom, similarly to the dipolar interaction between Ising spins in a ferromagnet. Such long-range interaction effectively lowers the upper critical dimension of the problem Cowley (1976), rendering the Ising transition mean-field like even in three dimensions.
Therefore, our observations highlight the key role played by the nemato-elastic coupling, which not only changes the character of the nematic transition, but also extends the impact of the nematic fluctuations to rather high temperatures above . Such a coupling has been proposed to be detrimental to the enhancement of by quantum critical nematic fluctuations Labat and Paul (2017). Whether this explains the observed behavior of across the phase diagram of chemically-substituted FeSe1-xSx, which shows no sizable enhancement upon crossing the putative nematic quantum critical point Reiss et al. (2017), is an interesting topic for future investigation. Moreover, the similar behavior of the nematic correlation length that we observe in FeSe and Ba-122 raises important questions about the interplay between nematicity and magnetism. Although FeSe displays no long-range magnetic order, a strong fluctuating magnetic moment, comparable to that of Ba-122, is observed experimentally Wang et al. (2016). Whether this is enough to explain the similar behavior of in both compounds is an issue that deserves further studies.
Acknowledgements.
D.R. would like to thank I.I. Mazin for helpful discussions. A.M.M. and D.R. were supported by the U.S. Department of Energy (DOE), Office of Basic Energy Sciences, Office of Science, under Con- tract No. DE-SC0006939. Theory work (RMF) was supported by the DOE Office of Science, Basic Energy Sciences, under Award No. DE-SC0020045. This research used resources of the Advanced Photon Source (APS), a DOE Office of Science User Facility operated for the DOE Office of Science by Argonne National Laboratory under Contract No. DE-AC02-06CH11357. Experimental work was carried out at BL43LXU of the RIKEN SPring-8 Center and at Sector 30 (HERIX) of the APS.References
- Fradkin et al. (2010) E. Fradkin, S. A. Kivelson, M. J. Lawler, J. P. Eisenstein, and A. P. Mackenzie, Annual Review of Condensed Matter Physics 1, 153 (2010).
- Fernandes et al. (2014) R. M. Fernandes, A. V. Chubukov, and J. Schmalian, Nature physics 10, 97 (2014).
- Fernandes et al. (2010) R. M. Fernandes, L. H. VanBebber, S. Bhattacharya, P. Chandra, V. Keppens, D. Mandrus, M. A. McGuire, B. C. Sales, A. S. Sefat, and J. Schmalian, Phys. Rev. Lett. 105, 157003 (2010).
- Fang et al. (2008) C. Fang, H. Yao, W.-F. Tsai, J. Hu, and S. A. Kivelson, Phys. Rev. B 77, 224509 (2008).
- Xu et al. (2008) C. Xu, M. Müller, and S. Sachdev, Phys. Rev. B 78, 020501 (2008).
- Paglione and Greene (2010) J. Paglione and R. L. Greene, Nature Phys 6, 645 (2010).
- Fernandes et al. (2012) R. M. Fernandes, A. V. Chubukov, J. Knolle, I. Eremin, and J. Schmalian, Phys. Rev. B 85, 024534 (2012).
- McQueen et al. (2009) T. M. McQueen, A. J. Williams, P. W. Stephens, J. Tao, Y. Zhu, V. Ksenofontov, F. Casper, C. Felser, and R. J. Cava, Phys. Rev. Lett. 103, 057002 (2009).
- Mizuguchi and Takano (2010) Y. Mizuguchi and Y. Takano, J. Phys. Soc. Jpn. 79, 102001 (2010).
- Johnston (2010) D. C. Johnston, Advances in Physics 59, 803 (2010).
- Böhmer et al. (2019) A. E. Böhmer, K. Kothapalli, W. T. Jayasekara, J. M. Wilde, B. Li, A. Sapkota, B. G. Ueland, P. Das, Y. Xiao, W. Bi, J. Zhao, E. E. Alp, S. L. Bud’ko, P. C. Canfield, A. I. Goldman, and A. Kreyssig, Phys. Rev. B 100, 064515 (2019).
- Baek et al. (2015) S.-H. Baek, D. Efremov, J. Ok, J. Kim, J. van den Brink, and B. Büchner, Nature materials 14, 210 (2015).
- Böhmer et al. (2015) A. E. Böhmer, T. Arai, F. Hardy, T. Hattori, T. Iye, T. Wolf, H. Löhneysen, K. Ishida, and C. Meingast, Phys. Rev. Lett. 114, 027001 (2015).
- Wang et al. (2016) Q. Wang, Y. Shen, B. Pan, X. Zhang, K. Ikeuchi, K. Iida, A. Christianson, H. Walker, D. Adroja, M. Abdel-Hafiez, et al., Nature communications 7, 12182 (2016).
- Fanfarillo et al. (2016) L. Fanfarillo, J. Mansart, P. Toulemonde, H. Cercellier, P. Le Fèvre, F. m. c. Bertran, B. Valenzuela, L. Benfatto, and V. Brouet, Phys. Rev. B 94, 155138 (2016).
- Chen et al. (2019) T. Chen, Y. Chen, A. Kreisel, X. Lu, A. Schneidewind, Y. Qiu, J. T. Park, T. G. Perring, J. R. Stewart, H. Cao, R. Zhang, Y. Li, Y. Rong, Y. Wei, B. M. Andersen, P. J. Hirschfeld, C. Broholm, and P. Dai, Nature materials 18, 709 (2019).
- Boeri et al. (2008) L. Boeri, O. V. Dolgov, and A. A. Golubov, Phys. Rev. Lett. 101, 026403 (2008).
- Yin et al. (2008) Z. P. Yin, S. Lebègue, M. J. Han, B. P. Neal, S. Y. Savrasov, and W. E. Pickett, Phys. Rev. Lett. 101, 047001 (2008).
- Reznik et al. (2009) D. Reznik, K. Lokshin, D. C. Mitchell, D. Parshall, W. Dmowski, D. Lamago, R. Heid, K.-P. Bohnen, A. S. Sefat, M. A. McGuire, B. C. Sales, D. G. Mandrus, A. Subedi, D. J. Singh, A. Alatas, M. H. Upton, A. H. Said, A. Cunsolo, Y. Shvyd’ko, and T. Egami, Phys. Rev. B 80, 214534 (2009).
- Murai et al. (2016) N. Murai, T. Fukuda, T. Kobayashi, M. Nakajima, H. Uchiyama, D. Ishikawa, S. Tsutsui, H. Nakamura, M. Machida, S. Miyasaka, S. Tajima, and A. Q. R. Baron, Phys. Rev. B 93, 020301 (2016).
- Niedziela et al. (2011) J. L. Niedziela, D. Parshall, K. A. Lokshin, A. S. Sefat, A. Alatas, and T. Egami, Phys. Rev. B 84, 224305 (2011).
- Weber et al. (2018) F. Weber, D. Parshall, L. Pintschovius, J.-P. Castellan, M. Kauth, M. Merz, T. Wolf, M. Schütt, J. Schmalian, R. M. Fernandes, and D. Reznik, Phys. Rev. B 98, 014516 (2018).
- Baron (2010) A. Q. R. Baron, SPring-8 Inf. News 15, 14 (2010), http://user.spring8.or.jp/sp8info/?p=3138.
- Toellner et al. (2011) T. S. Toellner, A. Alatas, and A. H. Said, Journal of Synchrotron Radiation 18, 605 (2011).
- Said et al. (2011) A. H. Said, H. Sinn, and R. Divan, Journal of Synchrotron Radiation 18, 492 (2011).
- Sinn (2001) H. Sinn, Journal of Physics: Condensed Matter 13, 7525 (2001).
- Baron (2019) A. Q. R. Baron, in Synchrotron Light Sources and Free-Electron Lasers: Accelerator Physics, Instrumentation and Science Applications, edited by E. Jaeschke, S. Khan, R. Schneider, and J. Hastings (Springer International Publishing, Cham, 2019) p. 1643.
- Baron (2009) A. Q. R. Baron, J. Spectrosc. Soc. Japan 58, 205 (2009).
- Baron (2015) A. Q. R. Baron, arXiv:1504.01098 [cond-mat] (2015).
- Shirane et al. (2002) G. Shirane, S. M. Shapiro, and J. M. Tranquada, Neutron Scattering with a Triple-Axis Spectrometer (Cambridge University Press, 2002).
- Böhmer et al. (2014) A. E. Böhmer, P. Burger, F. Hardy, T. Wolf, P. Schweiss, R. Fromknecht, M. Reinecker, W. Schranz, and C. Meingast, Phys. Rev. Lett. 112, 047001 (2014).
- Parshall et al. (2015) D. Parshall, L. Pintschovius, J. L. Niedziela, J.-P. Castellan, D. Lamago, R. Mittal, T. Wolf, and D. Reznik, Phys. Rev. B 91, 134426 (2015).
- Yoshizawa et al. (2012) M. Yoshizawa, D. Kimura, T. Chiba, S. Simayi, Y. Nakanishi, K. Kihou, C.-H. Lee, A. Iyo, H. Eisaki, M. Nakajima, and S.-i. Uchida, J. Phys. Soc. Jpn. 81, 024604 (2012).
- Kuo et al. (2016) H.-H. Kuo, J.-H. Chu, J. C. Palmstrom, S. A. Kivelson, and I. R. Fisher, Science 352, 958 (2016).
- Watson et al. (2015) M. D. Watson, T. K. Kim, A. A. Haghighirad, N. R. Davies, A. McCollam, A. Narayanan, S. F. Blake, Y. L. Chen, S. Ghannadzadeh, A. J. Schofield, M. Hoesch, C. Meingast, T. Wolf, and A. I. Coldea, Phys. Rev. B 91, 155106 (2015).
- Gallais et al. (2013) Y. Gallais, R. M. Fernandes, I. Paul, L. Chauvière, Y.-X. Yang, M.-A. Méasson, M. Cazayous, A. Sacuto, D. Colson, and A. Forget, Phys. Rev. Lett. 111, 267001 (2013).
- Thorsmølle et al. (2016) V. K. Thorsmølle, M. Khodas, Z. P. Yin, C. Zhang, S. V. Carr, P. Dai, and G. Blumberg, Phys. Rev. B 93, 054515 (2016).
- Kissikov et al. (2017) T. Kissikov, R. Sarkar, M. Lawson, B. T. Bush, E. I. Timmons, M. A. Tanatar, R. Prozorov, S. L. Bud’ko, P. C. Canfield, R. M. Fernandes, W. F. Goh, W. E. Pickett, and N. J. Curro, Phys. Rev. B 96, 241108 (2017).
- Nandi et al. (2010) S. Nandi, M. G. Kim, A. Kreyssig, R. M. Fernandes, D. K. Pratt, A. Thaler, N. Ni, S. L. Bud’ko, P. C. Canfield, J. Schmalian, R. J. McQueeney, and A. I. Goldman, Phys. Rev. Lett. 104, 057006 (2010).
- Tallon et al. (2019) J. L. Tallon, J. G. Storey, J. R. Cooper, and J. W. Loram, arXiv:1907.12018 (2019).
- Karahasanovic and Schmalian (2016) U. Karahasanovic and J. Schmalian, Phys. Rev. B 93, 064520 (2016).
- Paul and Garst (2017) I. Paul and M. Garst, Phys. Rev. Lett. 118, 227601 (2017).
- de Carvalho and Fernandes (2019) V. S. de Carvalho and R. M. Fernandes, Phys. Rev. B 100, 115103 (2019).
- Cowley (1976) R. A. Cowley, Phys. Rev. B 13, 4877 (1976).
- Labat and Paul (2017) D. Labat and I. Paul, Phys. Rev. B 96, 195146 (2017).
- Reiss et al. (2017) P. Reiss, M. D. Watson, T. K. Kim, A. A. Haghighirad, D. N. Woodruff, M. Bruma, S. J. Clarke, and A. I. Coldea, Phys. Rev. B 96, 121103 (2017).