Use of the Peak-Detector mode for gain calibration of SiPM sensors with ASIC CITIROC read-out
Abstract
The Cherenkov Imaging Telescope Integrated Read Out Chip (CITIROC) is a 32-channel fully analogue front-end ASIC dedicated to the read-out of silicon photo-multiplier (SiPM) sensors that can be used in a variety of experiments with different applications: nuclear physics, medical imaging, astrophysics, etc. It has been adopted as front-end for the focal plane detectors of the ASTRI-Horn Cherenkov telescope [1, 2] and, in this context, it was modified implementing the peak detector reading mode to satisfy the instrument requirements.
For each channel, two parallel AC coupled voltage preamplifiers, one for the high gain and one for the low gain, ensure the read-out of the charge from 160 fC to 320 pC (i.e. from 1 to 2000 photo-electrons with SiPM gain = 106, with a photo-electron to noise ratio of 10). The signal in each of the two preamplifier chains is shaped and the maximum value is captured by activating the peak detector for an adjustable time interval.
In this work, we illustrate the peak detector operation mode and, in particular, how this can be used to calibrate the SiPM gain without the need of external light sources. To demonstrate the validity of the method, we also present and discuss some laboratory measurements.
1 Introduction
The calibration of the signals of any Cherenkov camera is of considerable importance for the proper reconstruction of the recorded images. A suitable calibration procedure involves measurements of the pixel electronics baseline, the linearity, the uniformity of the response to incident light, and the value of the equivalent photo-electrons (pe), typically expressed in terms of analog-to-digital (ADC) counts. Usually silicon photo-multipliers (SiPMs) have a good amplitude resolution showing a peaked distribution for multiple photo-electron entries, thanks to a very low excess noise factor resulting from the Geiger mode operation and a high uniformity in the response of the individual micro-cells of each SiPM pixel. One of the techniques that allows the gain calibration of a Cherenkov camera without the need of an external light source is based on dark acquisitions runs. In dark spectra one can observe a percentage of events with amplitudes larger than one photo-electron because of the so-called optical cross-talk effect. Secondary photons [3] emitted in the primary avalanche can reach neighboring micro-cells, either directly or after a reflection, and trigger avalanches almost simultaneously to the primary one. This gives rise to high-amplitude pulses equivalent to the one produced by several incident photons. The dark spectrum shows therefore several peaks (with a Gaussian shape, to a good approximation) where the distance between two neighboring peaks corresponds to the pixel gain. The drawback of this calibration technique is that, due to the low cross talk probability (<10%), long acquisition time are necessary to accumulate spectra with sufficient statistics in the peaks for an accurate determination of pixel gains. This can be solved by means of a proper use the peak detector mode implemented in CITIROC chip.
2 The CITIROC chip
The CITIROC [4, 5], designed by WEEROC444http://www.weeroc.com, is a 32-channel fully analogue front-end ASIC dedicated to the SiPM sensors read-out. It is designed with a 0.35m SiGe technology from AustriaMicroSystems. It is an evolution of the EASIROC (the Extended Analogue Silicon photo-multiplier Integrated Read Out Chip)[6, 7, 8, 9, 10] which was available since 2010 and used in a variety of nuclear physics and astrophysics and medical imaging applications. Fine-tuning of each pixel gain is obtained adjusting the voltage applied to the SiPM through an 8-bit Digital-to-Analog Converter (DAC) ranging from 0 to 4.5 V. For each channel, two parallel AC coupled voltage preamplifiers the High Gain (HG) and Low gain (LG) electronics chains ensure the read out of the charge from 160 fC to 320 pC (i.e. from 1 to 2000 photoelectrons with SiPM Gain = 106, with a photo-electron to noise ratio of 10). Two operation modes are implemented in the ASIC: the peak detector and the switched capacitor array (SCA). The peak detector mode provides the maximum pulse height reached by the signal in a predefine time window (plus an electronics offset from the circuit), whereas the SCA mode returns the level of the shaped pulse height at the given sampling time. The trigger path that can be switched between either the LG or HG preamplifiers is composed of a 15 ns peaking time fast shaper followed by two discriminators. One discriminator provides trigger and hit information, with a programmable mask to block unwanted channels, the other provides accurate time information. An internal 10-bit threshold common to all 32 channels can be set for each of the two discriminators. Fine-trimming of each channel’s discriminator is also possible with a 4-bit DAC. The 32 analogue channel paths are multiplexed into one output each for HG and LG.
3 The Peak detector mode
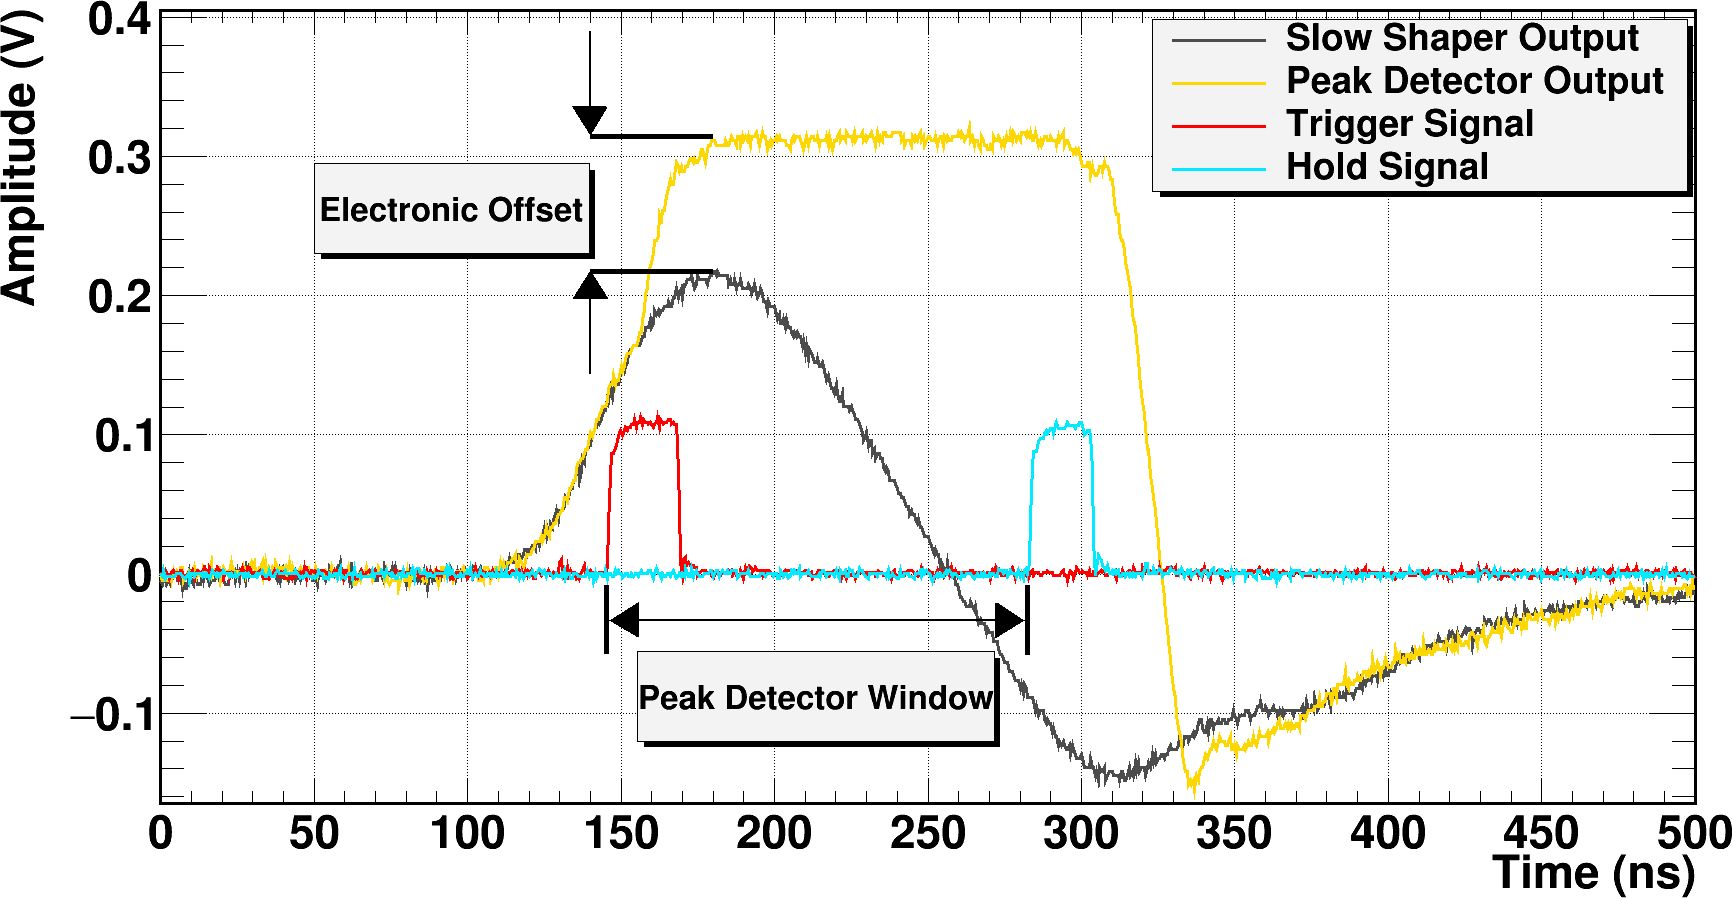
The peak detector working mode implemented in CITIROC is illustrated in Fig. 1. The signal is generated by the SiPM is shaped with a time constant that can be varied from 12.5 to 87.5 ns, depending on the user requirements (black curve in Fig. 1). The peak detector is activated, within a few ns, by a "trigger signal" (red curve in Fig. 1) and is stopped after a predefined selectable delay, by the rising edge of the "hold signal" (blue curve in Fig. 1). During the "hold" signal the ADC conversion of the peak detector output is performed. The falling edge of the "hold" signal switches the chain back to track phase for the next acquisition. The delay between the trigger and the hold signals can be varied up to a few microsecond depending on the application of the ASIC.
4 Peak detector output
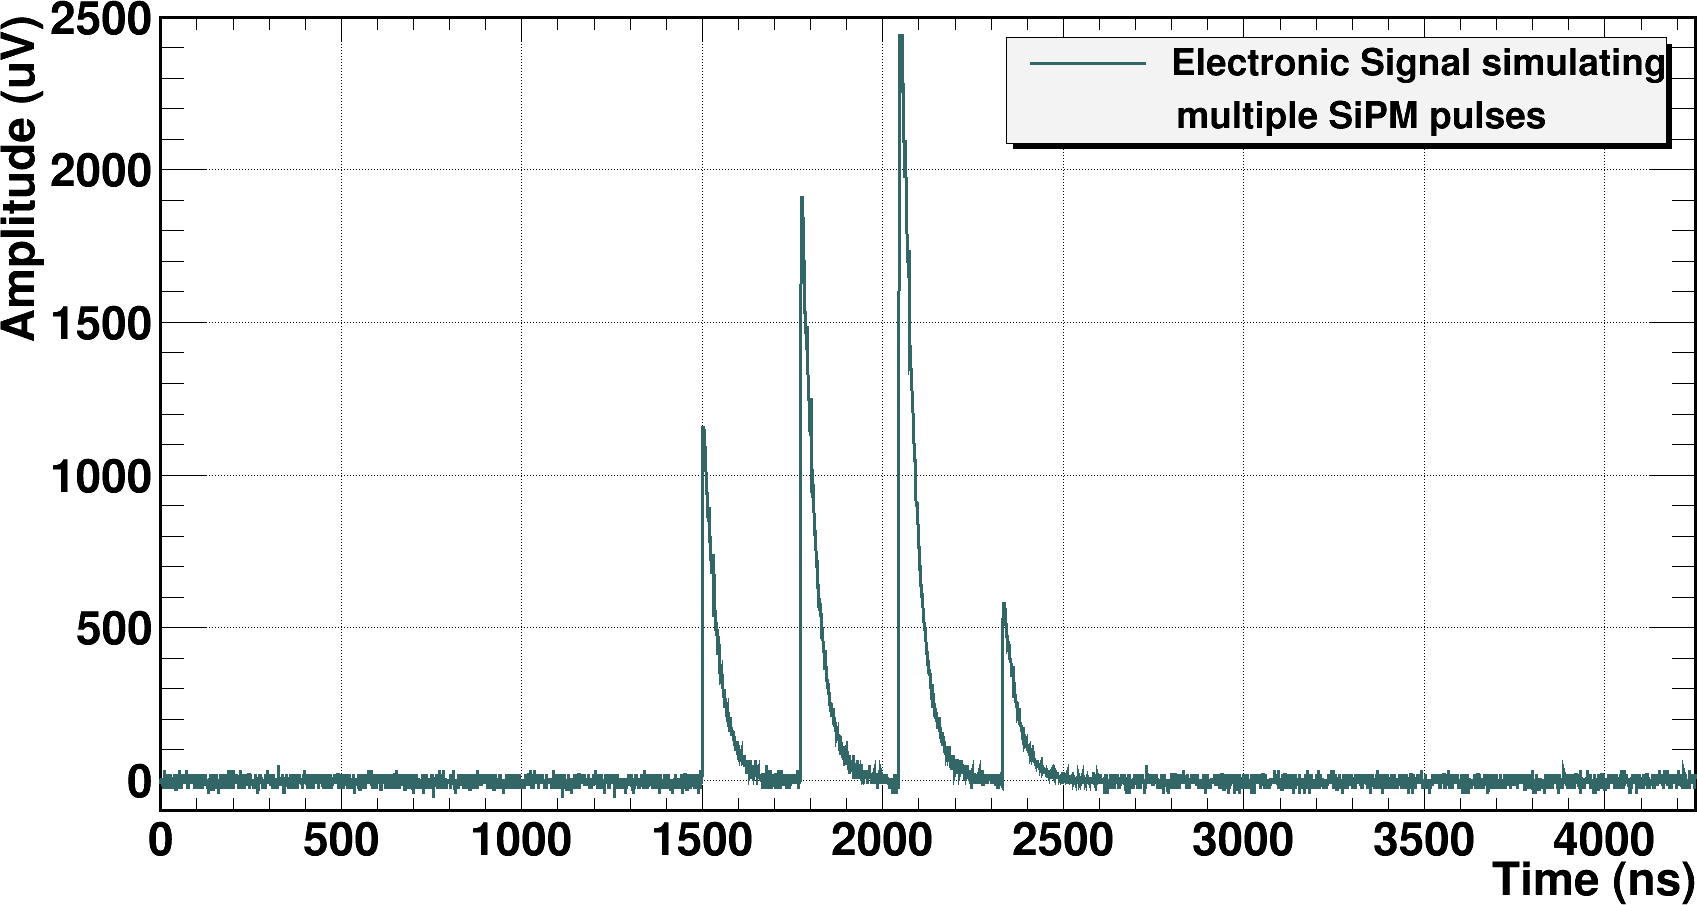
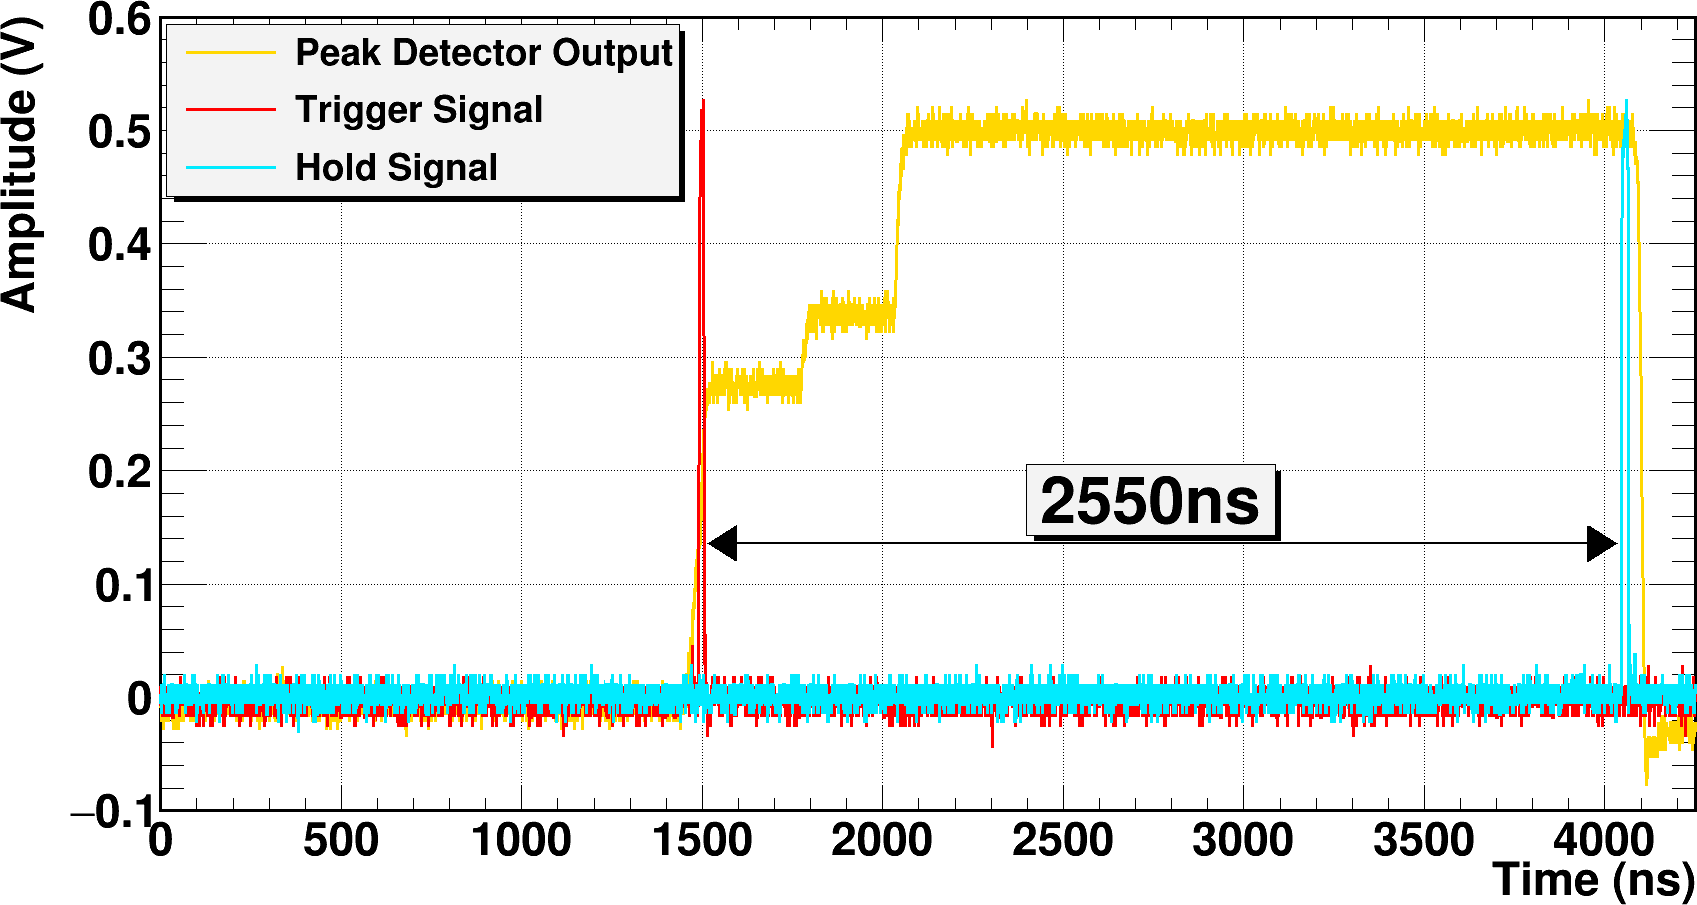
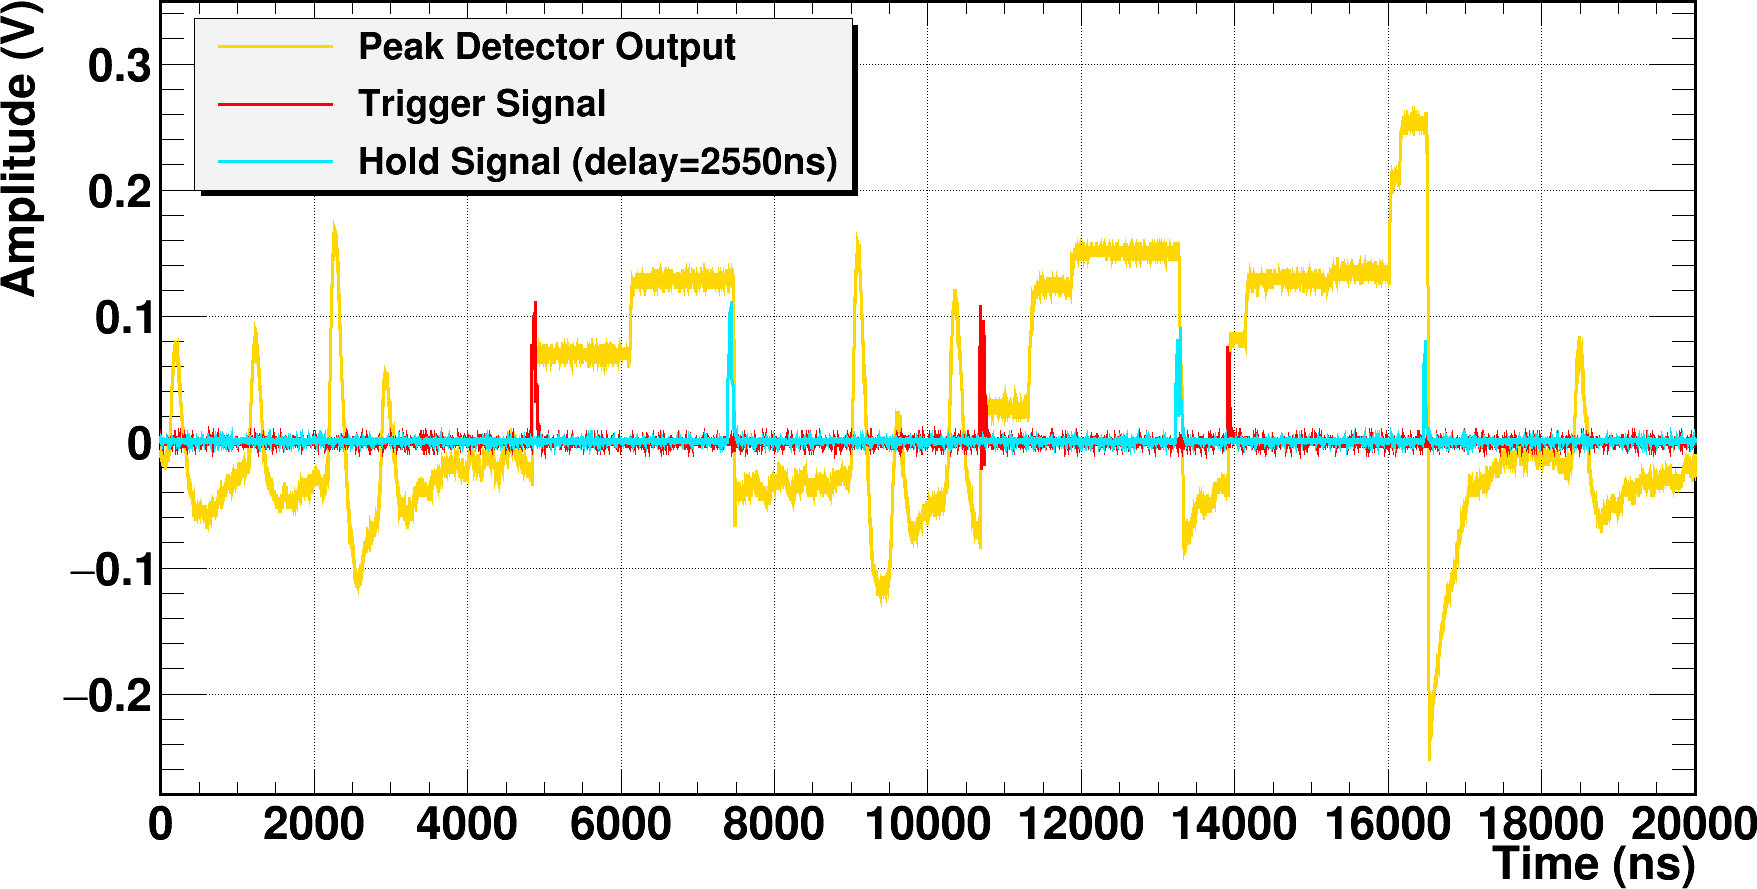
To study the characteristics of the peak detector output when multiple pulses at close time distance are generated by the SiPM, we injected into one channel of CITIROC an electronic signal simulating four pulses, with different amplitudes, by using a pulse-function generator. The shape of the four pulses was tailored to the shape of a real SiPM output pulse i.e. with a very fast rise time (a few hundreds of ps) followed by an exponential decay with a time constant of about 150 ns (see Fig. 2). The trigger and hold signals, provided by the pulse generator, were used to activate/deactivate the peak sensing circuit of the ASIC. The delay of the hold signal was set to a value of about 2550 ns so that all the four simulated pulses were inside the peak detector activation time window. As shown in Fig. 3, the peak detector output depends only on the pulse with the highest amplitude. In Fig. 4 we show the peak detector analog output as observed with real SiPM pulses generated in dark conditions.
5 Dark count spectra
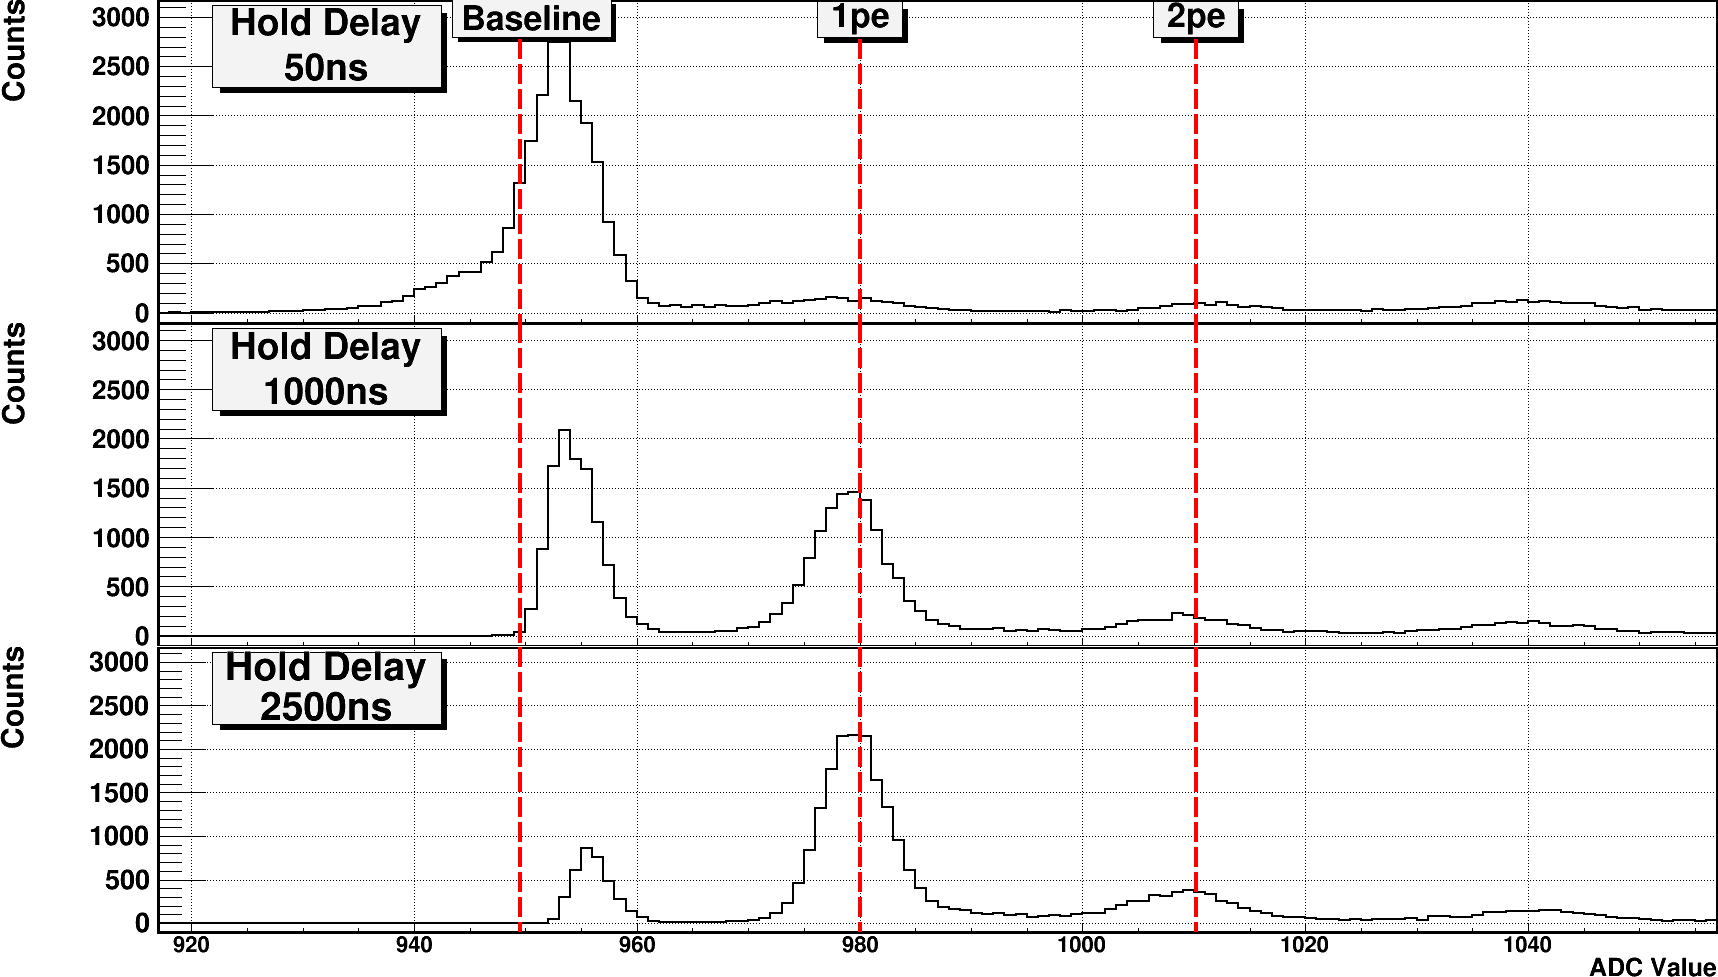
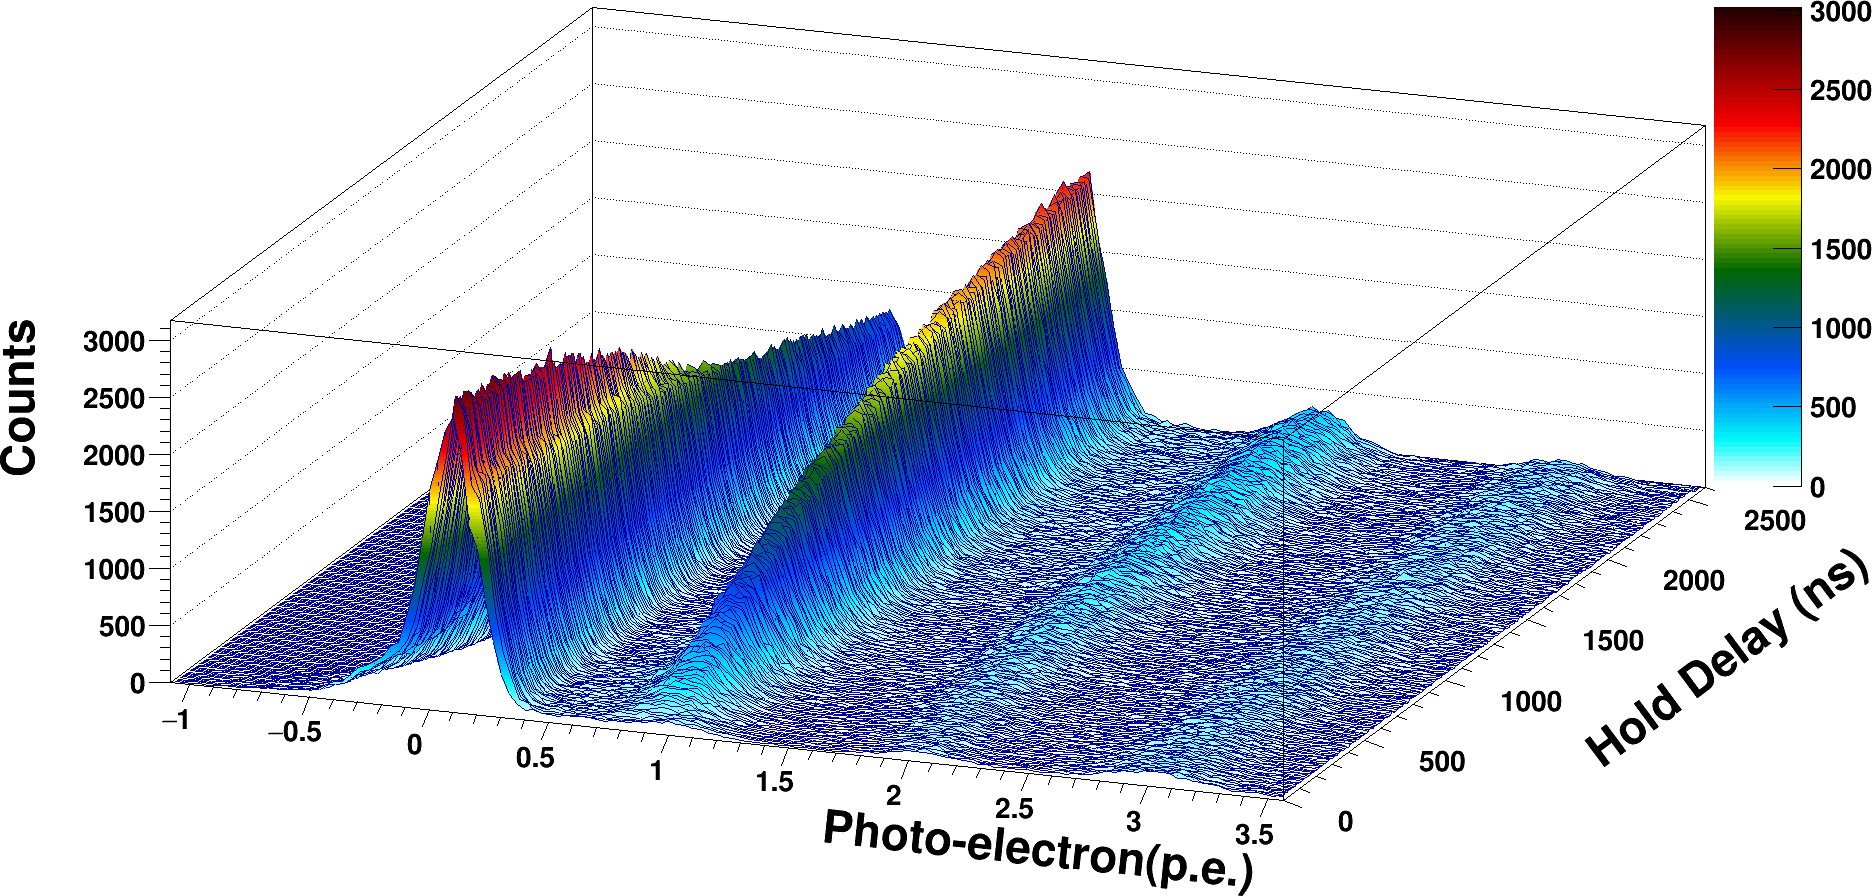
In peak detector working mode, the output is always the highest signal value in the time interval between the trigger and the rising edge of hold signal. The increase of the time interval between the trigger and the hold signal strongly affects therefore the pulsed height distribution. In Fig. 5 it is clearly visible how the number of events accumulated in the first and second peak increases significantly with the hold delay. In Fig. 6 we show the evolution of the dark count spectrum by varying the hold signal delay from 0 to 2550 ns in steps of ten ns.
6 Evaluation of the pixel gains using the peak detector
The peak detector behaviour shown in the previous section can be exploited for a precise
evaluation of the SiPM pixel gain without using any
external light source. In fact, just increasing the delay time between the trigger and
the hold signal, it is possible to obtain dark count spectra with good statistical
significance of the peaks at 1pe, 2pe, etc.
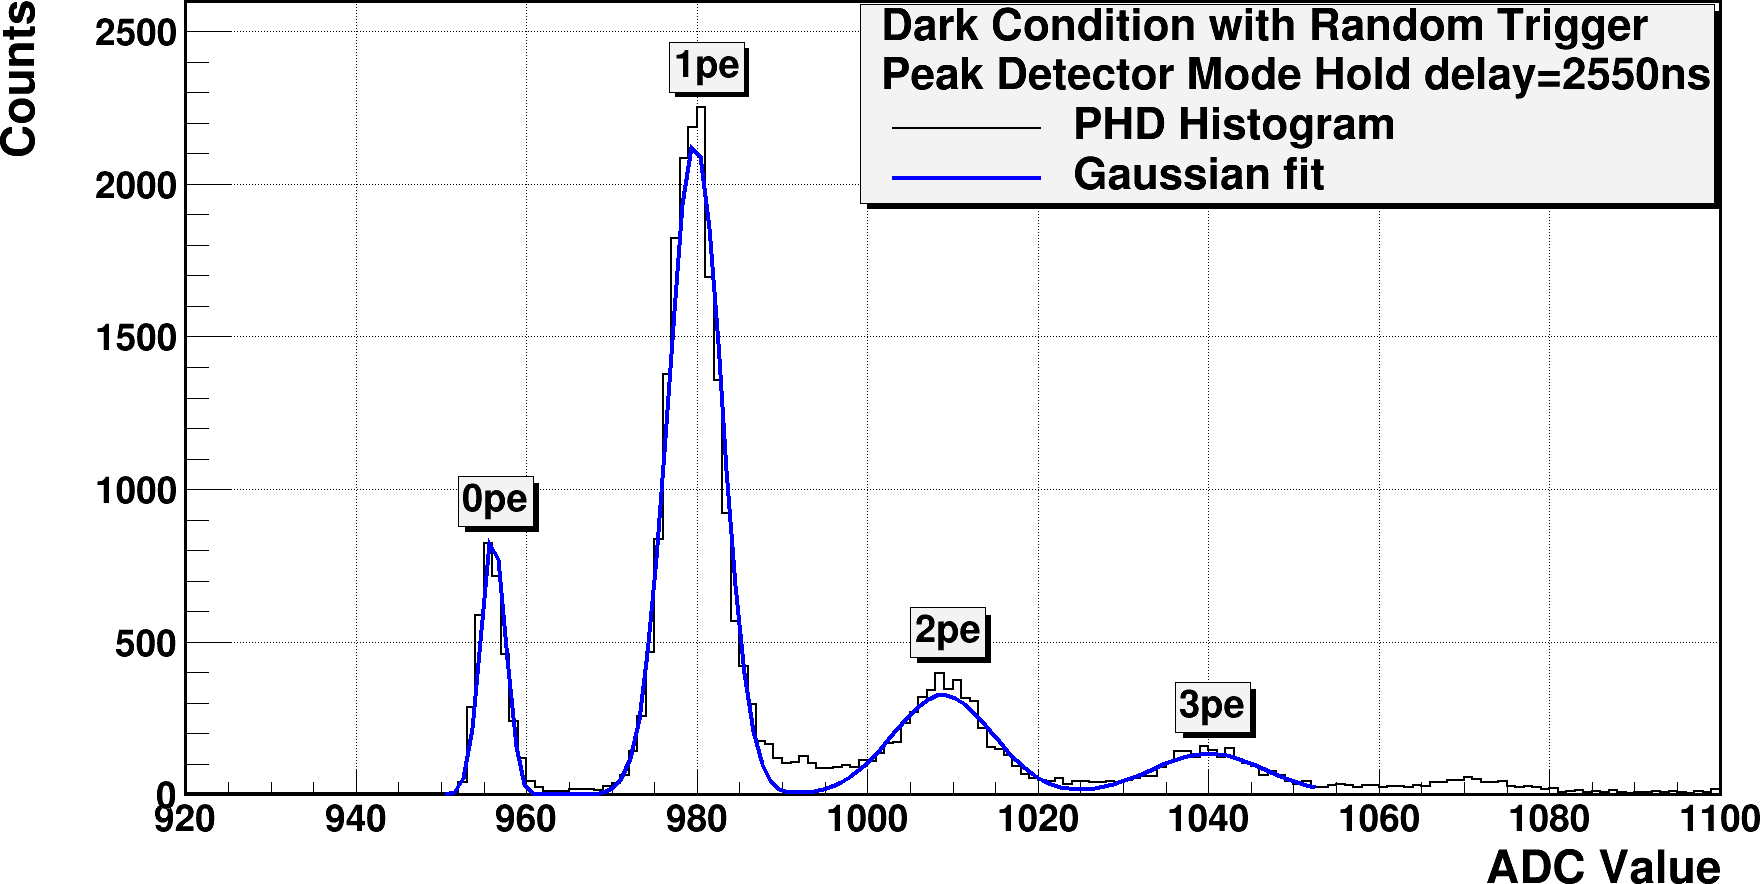
To check the validity of this method, we accumulated the
dark pulse height spectra relative to an hold delay of 2550 ns.
The dark spectrum is analysed with a multiple peaks Gaussian fit.
The ADC values of the peaks are then plotted as a function of the
number of photo-electrons and fitted (with the exclusion of the baseline peak)
to a straight line. The slope of the resulting
fit line gives the pixel gains, while its extrapolation at 0pe provides the true baseline.
As a consistency check, we applied the same method to the
spectrum obtained by illuminating the SiPM with a ns pulsed blue-light-emitting diode (LED) setting the hold delay to 90 ns (see Fig. 8).
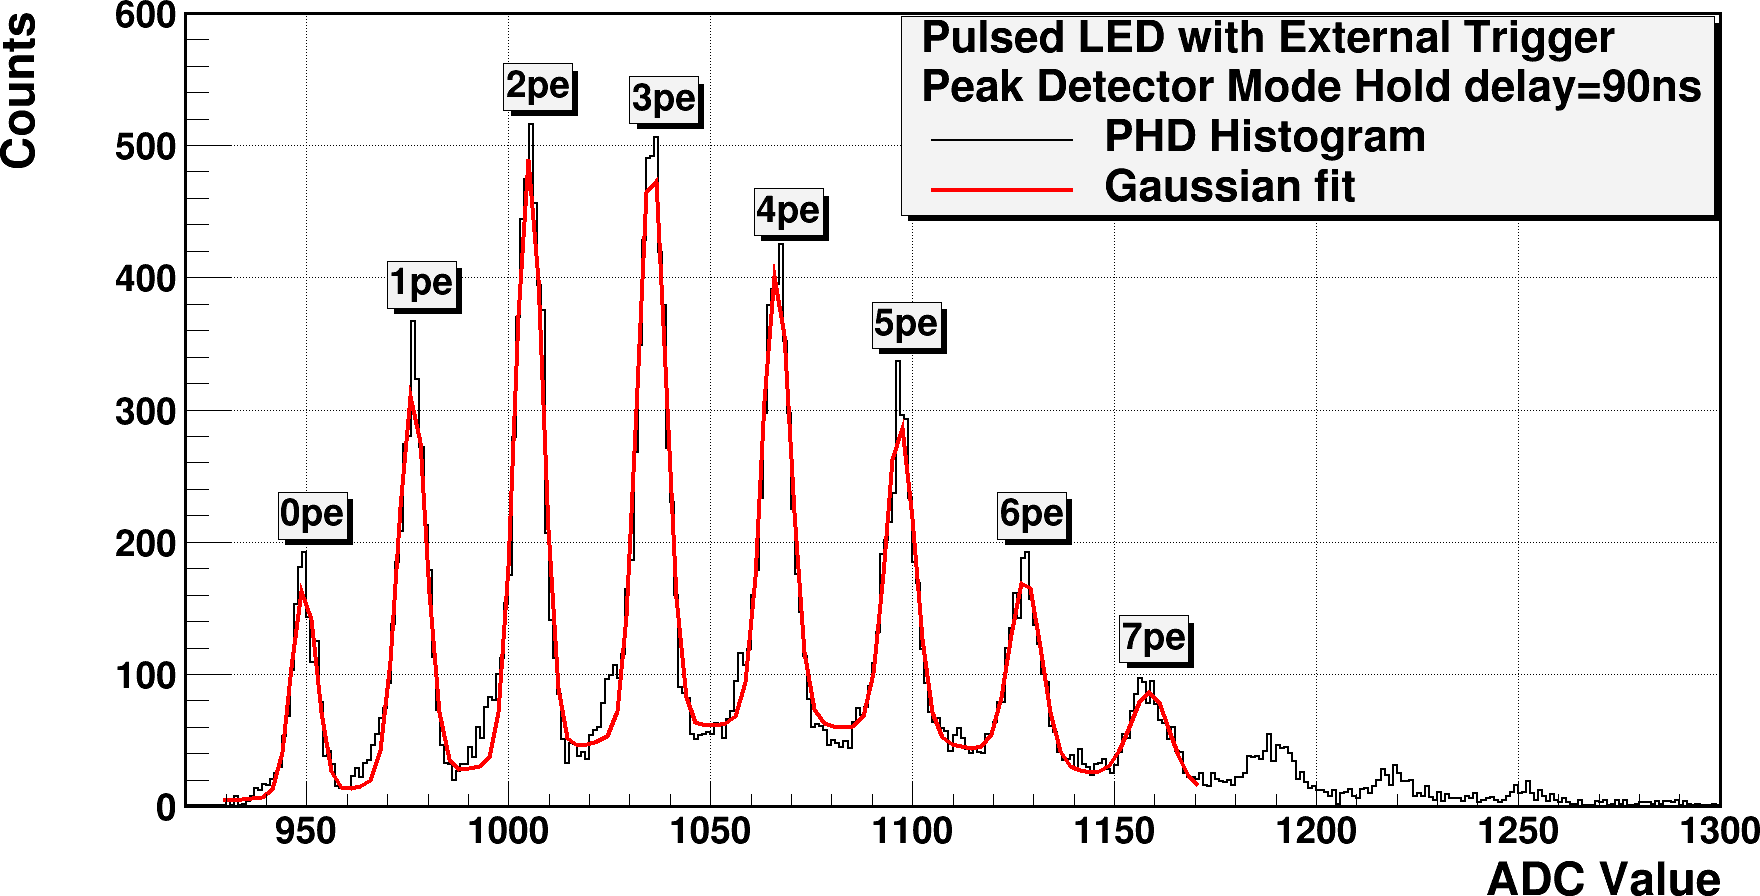
As shown in Fig. 9, the pixel gain obtained from the dark counts (29.93.4 ADC/pe) is in good agreement, within the statistical errors, with the value achieved from the external pulsed light (30.40.9 ADC/pe).
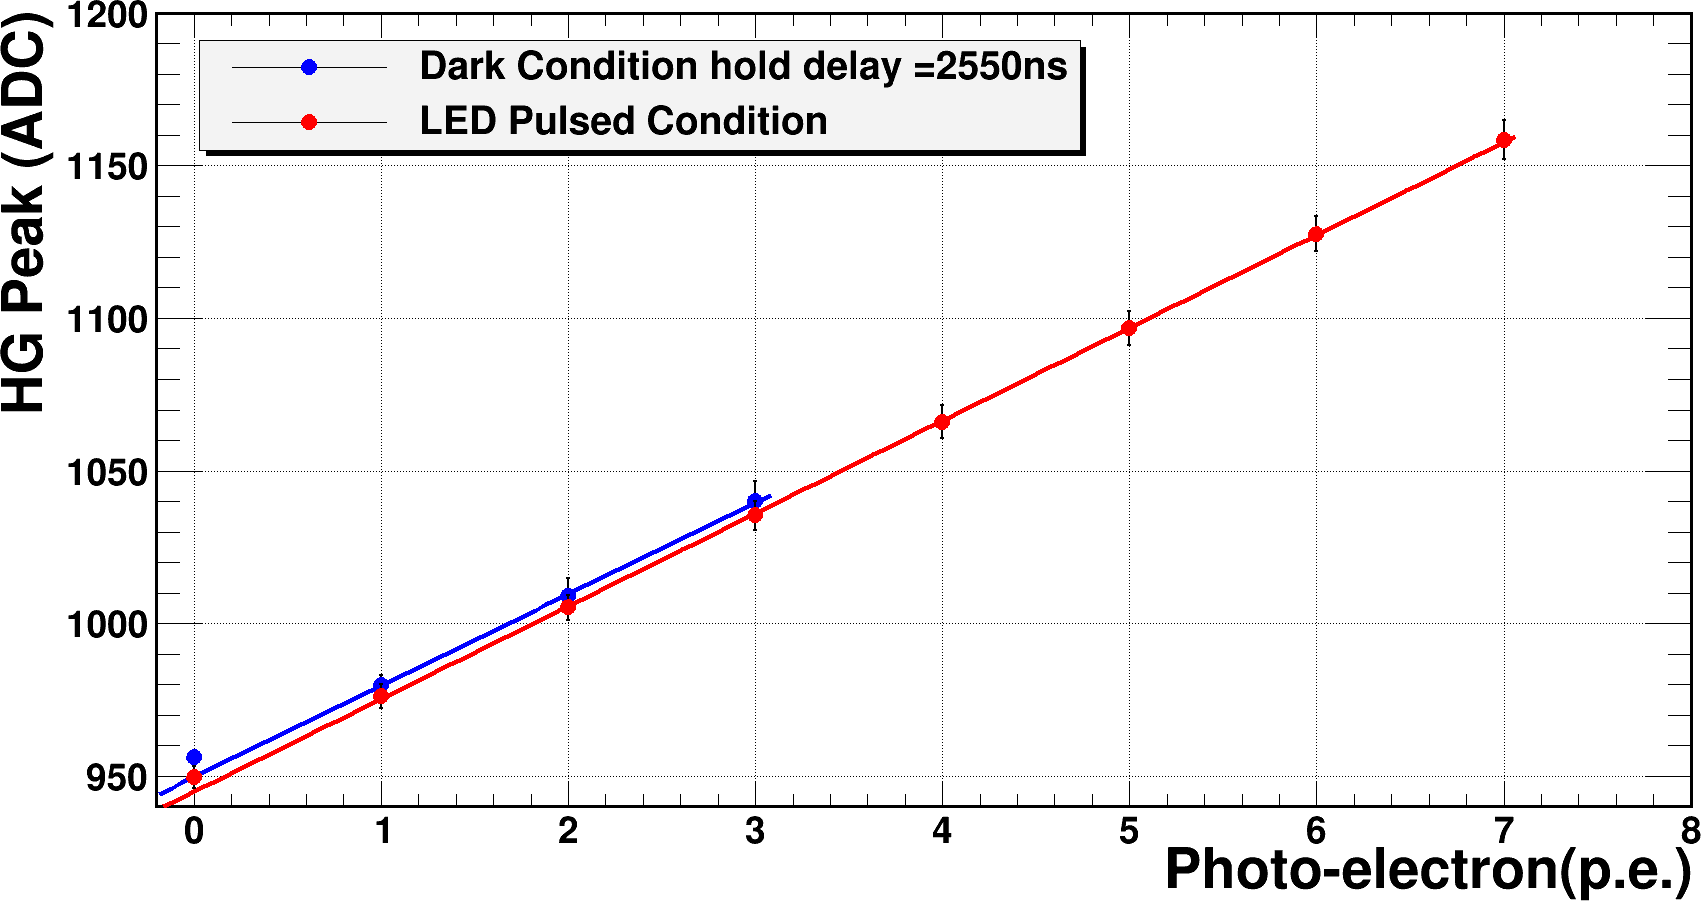
Note that the value corresponding to the peak at 0pe, is not considered in the fit since it is, as expected, systematically higher than the baseline due to the positive bias induced by the peak detector working mode when no SiPM pulses are detected. The true baseline can be however easily obtained as the value assumed by the fitting line at 0 pe.
The two methods present different advantagesdisadvantages that must be taken into account in designing a calibration system for a given experiment. The method with the external pulsed light provide rather smaller statistical errors than the ”dark method” because more peaks can be produced in the spectra distribution. On the other side, if the scientific instrument has a large dimension, it may be difficult to deliver the ns light pulses to illuminate the detection plane without a significant temporal spreading of the photon pulses along their travel. If excessive, the optical pulses broadening can therefore introduce systematic effects in the pulse height distributions and systematic errors in the pixel gains measured with an external light source. On the contrary, the dark pulses generated by the cross-talk effect have the same identical temporal structure independently on their amplitude and, therefore, the method allows us to measure (although with a reduced number of peaks) the pixel gains with a lower level of systematic . An artificial pulsed light source able to provide large illumination levels is clearly necesssary to extend the gain measurement, from a few pe, up to the full working range of the instrument and to verify the responce linearity.
.
7 Conclusion
We have shown that, by simply increasing the activaction time of peak detector working mode it is possible to obtain dark count spectra that allow us to calibrate the SiPM gain without an external light source. This calibration method is particularly useful for all experiments where the use of an external calibration light to illuminate the SiPM is not simple due to, e.g. the extended dimensions of the SiPM covered area. In the context of Astri-Horn the proposed method will be used to complement and cross-check the results obtained with a pulsed light source illuminating the detection plane [11].
Acknowledgments
This work is supported by the Italian Ministry of Education, University,
and Research (MIUR) with funds specifically assigned to the Italian
National Institute of Astrophysics (INAF) for the Cherenkov Telescope
Array (CTA), and by the Italian Ministry of Economic Development (MISE)
within the ”Astronomia Industriale” program. We acknowledge support from
the Brazilian Funding Agency FAPESP (Grant 2013/10559-5) and from the
South African Department of Science and Technology through Funding
Agreement 0227/2014 for the South African Gamma-Ray Astronomy Programme.
D.I., A.S., O.C., S.G. and T.M. thank S. Lombardi for his contribution as internal referee
of the paper.
References
-
[1]
Pareschi, G., ”The ASTRI SST-2M prototype and mini-array for the Cherenkov Telescope Array (CTA)”
SPIE Astronomical Telescopes + Instrumentation, Proceedings Volume 9906, Ground-based and Airborne Telescopes VI; 99065T (2016)
doi: https://doi.org/10.1117/12.2232275 -
[2]
Scuderi, S., ”From the Etna volcano to the Chilean Andes: ASTRI end-to-end telescopes for the Cherenkov Telescope Array”
SPIE Astronomical Telescopes + Instrumentation, Proceedings Volume 10700, Ground-based and Airborne Telescopes VII; 107005Z (2018)
doi: https://doi.org/10.1117/12.2312453 -
[3]
Mirzoyan,R., Kosyra,R. and Moser,H.-G., ”Light
emission in Si avalanches”, Nuclear Instruments and Methods in Physics
Research Section A 610 (2009) 98-100
doi: https://doi.org/10.1016/j.nima.2009.05.081 -
[4]
Fleury, J. et al., ”Petiroc and Citiroc : Front-end
ASICs for SiPM readout and ToF applications”, Journal of
Instrumentation, Vol. 9, C01049, (2014)
doi: https://doi.org/10.1088/1748-0221/9/01/C01049 -
[5]
Impiombato, D. et al., ”Characterization and performance of the ASIC
(CITIROC) front-end of the ASTRI camera” Nuclear Instruments and
Methods in Physics Research Section A 794 September, (2015), 185
doi: https://doi.org/10.1016/j.nima.2015.05.028 -
[6]
Callier, S. et al., ”EASIROC, an easy & versatile
readout device for SiPM”, TIPP 2011 - Technology and Instrumentation in
Particle Physics 2011
doi: https://doi.org/10.1016/j.phpro.2012.02.486 -
[7]
Impiombato, D. et al., on behalf of the ASTRI
Collaboration, ”Characterization of the front-end EASIROC for readout
of SiPM in the ASTRI camera”, Procs. SciNeGHE 2012 Workshop, 20-22 June
2012, Lecce, Italy, Nucl. Physics B (Proceedings Supplements), Vol. 239,
Pages 254-257, June 2013
doi: https://doi.org/10.1016/j.nuclphysbps.2013.05.039 -
[8]
Impiombato, D. et al., on behalf of the ASTRI Collaboration,
”Characterization of EASIROC as front-end for the readout of the SiPM
at the focal plane of the Cherenkov telescope ASTRI” Nuclear Instruments and Methods in Physics
Research Section A , Vol. 729, Pages 484-490, November 2013
doi: https://doi.org/10.1016/j.nima.2013.07.029 -
[9]
Marano, D. et al., ”PSPICE High-Level Model and Simulations of the EASIROC
Analog Front-End”, International Journal of Modelling and Simulations
34 (4), 2014
doi: 10.2316/Journal.205.2014.4.205-6005 -
[10]
Impiombato, D. et al., on behalf of the ASTRI
Collaboration, ”Evaluation of the optical cross talk level in the SiPMs
adopted in ASTRI SST-2M Cherenkov Camera using EASIROC front-end electronics” Journal of
Instrumentation 9 (02), (article id. C02015)
doi: https://doi.org/10.1088/1748-0221/9/02/C02015 -
[11]
Catalano, O. et al., ”The ASTRI camera for the Cherenkov Telescope Array”
SPIE Astronomical Telescopes + Instrumentation, Proceedings Volume 10702, Ground-based and Airborne
Instrumentation for Astronomy VII; 1070237 (2018)
doi: https://doi.org/10.1117/12.2314984