figure \cftpagenumbersofftable
Measuring the Etalon Quality of the GREGOR Fabry-Pérot Interferometer
Abstract
Imaging spectropolarimetry is an important observational tool in solar physics because of fast-cadence spectral scans with high-spectral resolution, large field-of-view, and its inherent suitability for post-facto image restoration. Fabry-Pérot etalons are the key optical elements of these instruments. Their optical quality critically defines the instrument’s performance. The two etalons of the GREGOR Fabry-Pérot Interferometer (GFPI) were used for more than 10 years, raising questions about the potential deterioration of etalons coatings. We present an assessment of the etalons optical quality, describe the inspection method based on Zernike polynomials, discuss the field dependence of the finesse and its consequences for instrument design, and investigate the impact of the measurement technique to achieve plate parallelism. We find that extended exposure to sunlight affects the etalon coatings, i.e., lowering the peak transmission and leaving an imprint of the pupil of the GREGOR solar telescope on the etalon that is directly exposed to sunlight. The finesse of both etalons, however, remains high so that the impact on imaging spectropolarimetry is negligible.
keywords:
Fabry-Pérot, etalons, interferometers, spectrometers, optical inspection, coatings*Meetu Verma, \linkablemverma@aip.de
1 Introduction
High-resolution solar physics mainly explores the visible and near-infrared spectral range to investigate flows and magnetic fields in the photosphere and chromosphere. Tracing changes on the solar surface across various atmospheric layers requires high spatial, temporal, and spectral resolution as well as good photometric and polarimetric accuracy. Currently, the largest solar telescopes have aperture diameters of 1.5 – 1.7 m. Photon-gathering capability and spatial resolution motivates pursuing telescopes with even larger apertures, i.e., the next generation of 4-meter aperture telescopes is already on the horizon. However, designing and building instruments for high-resolution solar physics is a challenging task because the science requirements are often irreconcilable, which leads to different instrument classes, e.g., classical spectrographs scanning the solar surface, spectrogrpahs employing integral field units (IFUs), and imaging spectrometers. Outfitted with polarimeters, all instruments can also perform measurements of the solar magnetic field.
Imaging spectropolarimetry is nowadays carried out with complex Fabry-Perót interferometers (FPIs). Examples include the Triple Etalon SOlar Spectrometer (TESOS) [1, 2] at the Vacuum Tower Telescope (VTT), the Interferometric BIdimensional Spectropolarimeter (IBIS) [3] at the Dunn Solar Telescope (DST), the CRisp Imaging SpectroPolarimeter (CRISP) [4] at the Swedish Tower Telescope (SST), and the GREGOR Fabry-Perót Interferometer (GFPI) [5, 6] at the 1.5-meter GREGOR solar telescope [7, 8, 9] located at Observatorio del Teide, Tenerife, Spain. The next generation of FPIs is already on the horizon. The Visbile Tuneable Filter (VTF) [10] offers a clear aperture with a diameter of about 240 mm, a significant advancement in manufacturing large etalon plates, which are needed for the 4-meter Daniel K. Inouye Solar Telescope (DKIST) [11] located at the Haleakalā Observatory, Maui, Hawaii, U.S.A. The high photon-throughput of FPIs, especially when high spatial and spectral resolution are required at the same time, offers many advantages over classical spectrographs that have to scan the solar surface. In the latter case, this leads to slow cadences when scanning a region on the Sun at the diffraction-limited resolution of 4-meter aperture telescopes. More importantly, since FPIs deliver images, they benefit directly from real-time correction with adaptive optics (AO) systems [12] and from post-facto image restoration techniques [13, 14].
The main optical design of the GFPI remained unchanged for more than a decade. However, outdated calibration equipment and advances in detector technology led to changes of the optical path for the laser alignment of the etalon plates. In addition, two synchronized CMOS cameras were recently integrated, which have a significantly higher image acquisition rate of up to 100 Hz. This motivated us to evaluate the quality and performance of the two Fabry-Pérot etalons, which have been in operation in the GFPI for more than 10 years (delivery in March 2005 and March 2007). A robust algorithm [15] was developed for measuring and maintaining the the plate parallelism of a Fabry-Perót etalon used in the Visible-light Imaging Magnetograph (VIM) [16] at the Big Bear Solar Observatory (BBSO). Tuning the voltages that are applied to the piezoelectric actuators that control the tip-tilt motion of one etalon plate with respect to the other yields a direct relationship to the finesse of the etalon. The finesse across the plates was characterized using Zernike polynomials. An even more detailed investigation of the instrument profile was carried out for IBIS [17]. The current study presents similar tests and and expands the method to a dual-etalon FPI. Assessing the etalons has several goals: (1) demonstrate that the coatings are still of good quality after more than a decade, (2) characterize quantitatively the etalon performance, and (3) validate the current alignment strategy to ensure plate parallelism.
In Section 2, we briefly describe the GFPI and current method to align the etalons and to measure the plate parallelism. Subsequently, we present in Section 3 the setup in the VTT optical laboratory, where the etalons were relocated for assessment. Individual experiments and measurements will be outlined and reported in Section 4, which includes a description of the method, based on Zernike polynomials, which is used to characterize defects and quality of the etalon plates. We conclude our investigation in Section 5 with a discussion of the results and explain their impact for the continued operation of the GFPI at the GREGOR solar telescope.
2 GREGOR Fabry-Pérot Interometer
The GFPI is a tunable, dual-etalon system with a collimated mount, which is designed for high resolution imaging spectropolarimetry of the Sun. The etalon coatings are optimized for the wavelength range 530 – 860 nm [6]. The spectral resolution depends on the observed wavelength and amounts to about , where refers to the FWHM of the GFPI’s transmission profile. Spectral lines are scanned sequentially with an image acquisition rate of up to 100 Hz with a new camera system (10 – 20 Hz until May 2019) and with a cadence of a few tens of seconds, while simultaneous images in a broad-band channel facilitate image restoration of the spatio-spectral data cube. The new camera system has a higher duty cycle of about 90%, i.e., the photometric accuracy will be significantly improved. Fine-structures with sizes down to 60 km can be resolved in a field-of-view (FOV) of ( until May 2019) on the solar surface.
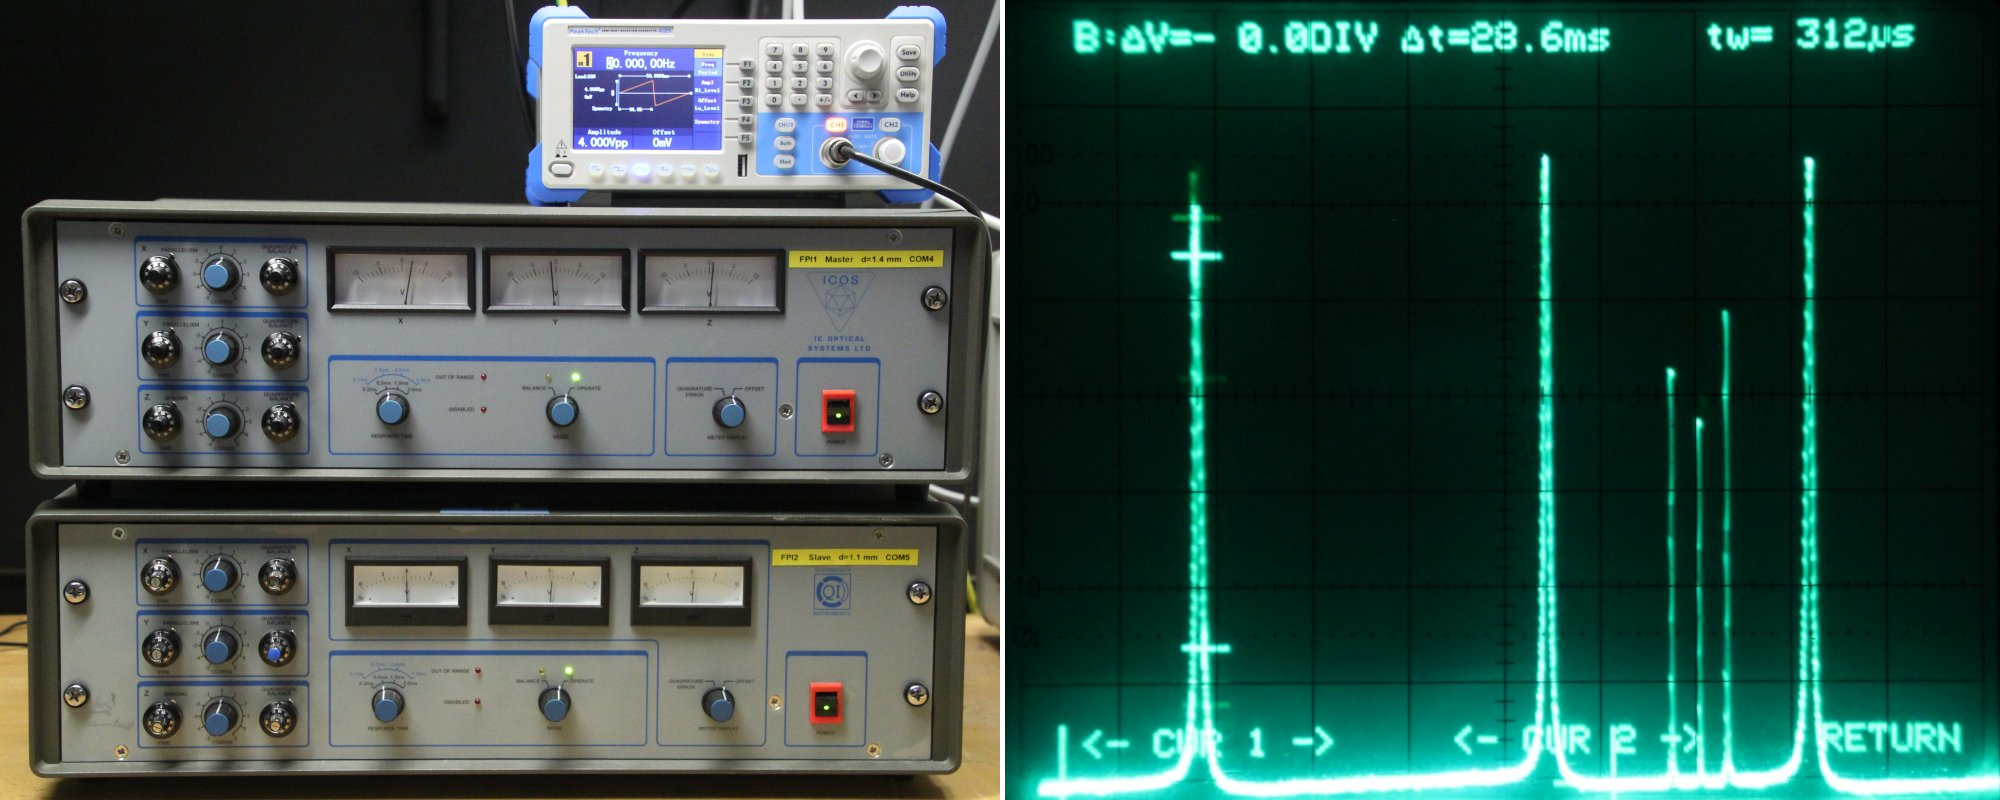
The GFPI etalons are in use since 2007 [18], first at the Vacuum Tower Telescope then starting in 2009 [5] at GREGOR. However, they were already purchased in 2005 (FPI 1, serial No. 1055) and 2007 (FPI 2, serial No. 1057, first in the beam). Both etalons have narrow cavities with a plate spacing of mm and mm, respectively. The main characteristics of the two etalons are summarized in Table 1. Maintaining the plate spacing and tuning are handled by two 12-bit CS-100 controllers (see left panel of Figure 1) manufactured by IC Optical Systems (ICOS). In both etalons, capacitance sensors form a three-axis () capacitance bridge, which ensures plate parallelism and maintains cavity spacing. The etalon plates can be tilted by changing the - and -settings of the capacitance bridge. The etalons are tuned to a certain wavelength by modifying the plate spacing via the -setting. The conversion factors from a voltage to wavelength shift are and pm mV-1. The -settings are either manually adjusted via coarse and fine control knobs with millivolt precision or digitally via an RS-232 port, which is used for scanning in wavelength. In addition, the output of a PeakTech 4125 waveform generator (left panel of Figure 1 on top of the CS-100 controllers) can drive the -axis, which is used in the alignment procedure of the etalon plates.
| FPI 1 | FPI 2 | |
|---|---|---|
| Manufacturer | ICOS #1055 | ICOS #1057 |
| Date of measurements | 2018 July 25 | 2018 July 27 |
| Diameter | 70 mm | 70 mm |
| Plate spacing | 1.408 mm | 1.101 mm |
| Free spectral range (FSR) | 0.1422 nm | 0.1819 nm |
| Reflectivity (632.8 nm) | 95.91% | 94.99% |
| Reflectivity finesse | 75.22 | 61.11 |
| Conversion factor | 0.5265 pm mV-1 | 0.6808 pm mV-1 |
| FWHM | 1.890 pm | 2.976 pm |
| FWHM (measured) | 2.760 pm | 3.028 pm |
| Effective finesse | 51.52 | 60.06 |
The spacing of the etalons can be controlled via the RS-232 interface, which means that a certain voltage range is discretized at 12-bit resolution in 4096 wavelength steps. FPI 1 serves as the master in the scanning process and the wavelength shift of FPI 2 is slaved to it so that their transmission peaks overlap when scanning solar spectral lines. Some older reference values for the wavelength step are listed in Table 2, where results from a linear fit to the measurements at four wavelength positions. The corresponding linear model is given by with m and , where and are given in meter (GFPI Technical Report No. 1, 2009 August 30). These values still apply to the current GFPI setup. Thus, at the laser wavelength a single wavelength step of the GFPI corresponds to pm, which significantly oversamples solar spectral lines.
| Spectral Line | ||
|---|---|---|
| Fe i 617.3 nm | 0.2954 pm | 0.2956 pm |
| Fe i 630.3 nm | 0.3016 pm | 0.3015 pm |
| H 656.3 nm | 0.3137 pm | 0.3134 pm |
| Fe i 709.0 nm | 0.3375 pm | 0.3376 pm |
The etalons have to be exactly perpendicular to the incident collimated beam of sunlight. Typically once per observing season FPI 2 is removed from the beam and the retro-reflection from the front side of FPI 1 is traced back to the science focus F4 of the GREGOR telescope (auto-collimation). Stopping down the iris field stop in F4 creates a pinhole and perfect tip-tilt alignment is achieved once the retro-reflection from FPI 1 leaves the optical system via the pinhole. The procedure is repeated for FPI 2 once it is re-inserted into the beam and after blocking the optical train just behind FPI 2. This manual alignment of the etalons is accurate to about one minute of arc. Inter-etalon reflections are minimized by placing a high-quality neutral density filter with a transmission of about 70% between the two etalons [19]. A slight misalignment of the two etalons with respect to the optical axis leads to ghost images, which are manually removed by minute tip-tilt corrections of FPI 1 while imaging a large pinhole. These adjustments are on the order of about 10 seconds of arc.
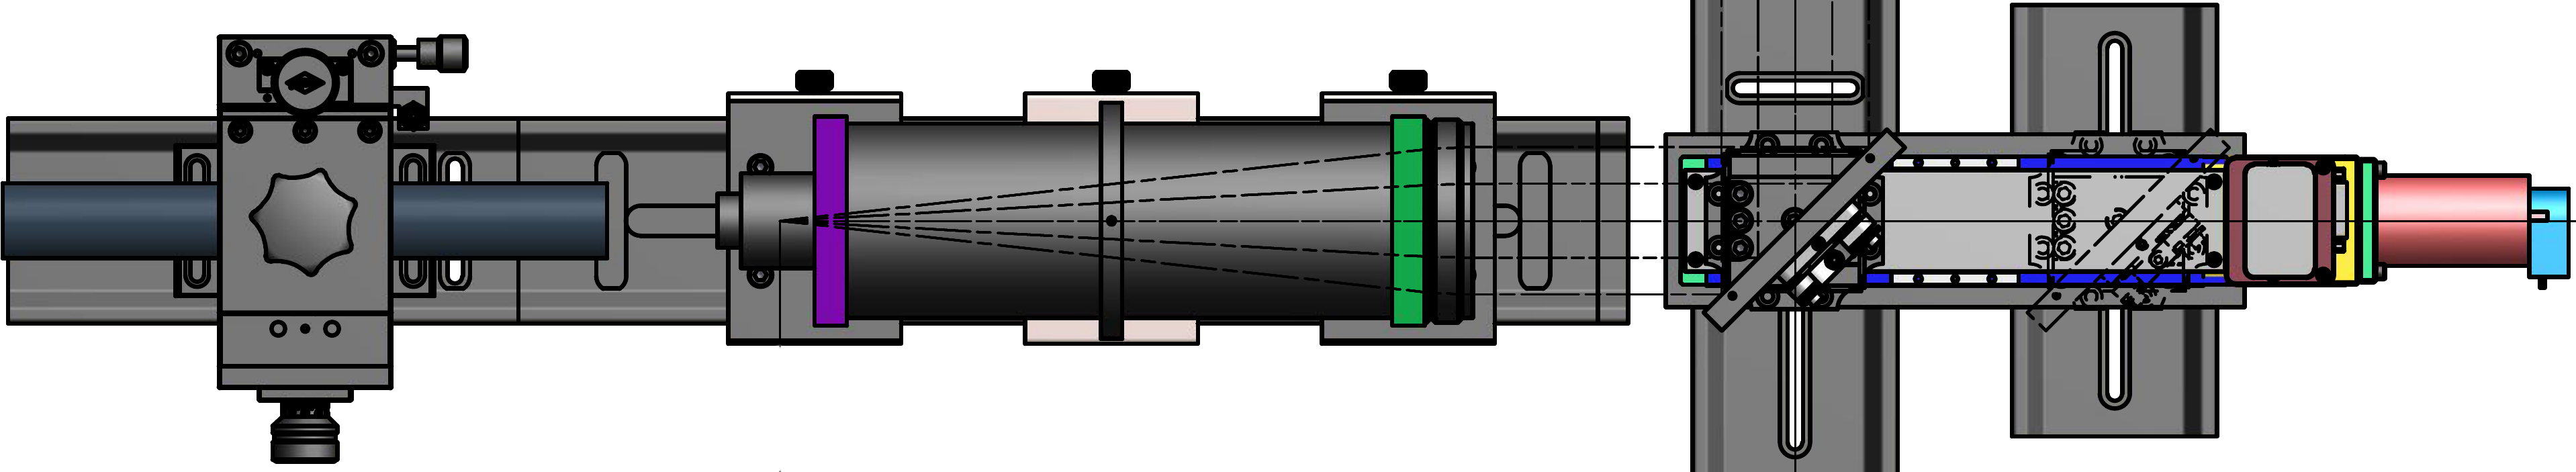
The regular etalon laser alignment procedure is carried out every one to two weeks, which corresponds to the typical length of an observing campaign at the GREGOR telescope. A red (632.8 nm) SL 03-Series stabilized HeNe laser manufactured by SIOS Meßtechnik GmbH is used for this purpose, which has a compact design and a rapid warm-up period (about 15 min). The laser can be operated in either frequency or amplitude stabilized mode. The frequency stabilized mode is the best choice for the alignment procedure. Motor controlled mirrors are inserted in the narrow-band channel just in front of the first etalon and behind the camera lens. The first mirror inserts a collimated laser beam with diameter of mm that is created by the beam expander shown in Figure 2, which consists of a small ball lens just in front of the laser and a collimator lens ( mm and mm). Even though desirable, a larger beam diameter cannot be created because of limited space on the optical tables and inside the GFPI housing. This shortcoming motivated partly the laboratory measurements in the following sections. Finally, the second mirror directs the now converging laser beam to a small relay optics that focuses the light upon a photo-multiplier.
The signals from the waveform generator and the photo-multiplier provide the inputs for a Philips PM3350A digital storage oscilloscope, which can analyze arbitrary waveforms. A simple switch allows to toggle back and forth between FPI 1 and FPI 2, i.e., the position of the transmission peak of one etalon is kept constant while that of the other etalon is ramped across this position. The width of the laser line is certainly below 0.2 fm, and the manufacturer provides frequency values of 1 – 10 kHz for the line width, which indicate an even narrower laser line. Thus, a -function is a very good assumption for the laser line in the following discussion. The beam expander creates a Gaussian beam, which illuminates first FPI 2. The plate separation of FPI 2 is changed via its -voltage to maximize the peaks recorded with the digital oscilloscope. After that the -position is kept constant. As a consequence, the Gaussian beam is modulated by the transmission function, and the blue-shift of FPI 2 introduces an additional variation of the intensity. This resulting illumination of FPI 1 is no longer symmetric and the coating of FPI 2 adds significant granularity to the intensity distribution. Ramping the -voltage of FPI 1 exposes its transmission profile locally to varying intensities. As FPI 1 also exhibits a blue-shift in the collimated beam, local transmission profiles across the beam are shifted in wavelength. The recorded transmission profiles at the photo-multiplier averages all these contributions. Therefore, the measured effective finesse (the calligraphic font indicates a measurement with the photo-multiplier) will be significantly lower compared to the locally derived finesse values across the etalon plates. If the etalons are properly aligned, then the display of the oscilloscope will show narrow and high transmission peaks (see right panel of Figure 1). This goal is accomplished by tuning the -settings of the CS-100 controllers for FPI 1, while keeping those for FPI 2 fixed, and vice versa. Taking turns in adjusting the - and -settings, the transmission peaks are maximized. Low and broad transmission peaks indicate that the etalon plates are still not parallel. In addition, the width of the transmission peak is continuously displayed in the digital storage mode so that a quantitative feedback is given as well. A quantitative description of this measuring procedure is given in Section 4. Using the digital memory of the oscilloscope, the width (effective finesse) and separation (free spectral range, FSR) of the transmission peaks are measured, which allows us to derive a measure of the effective finesse in real-time. A snapshot of a typical measurement is shown in the right panel of Figure 1. Note that the separation of the peaks is determined in a different menu. The basic concept of the overall alignment procedure is to translate the quantitative assessment of the etalons’ finesse into a time measurement of the two convolved transmission functions.
3 Optical Setup for the Etalon Evaluation
The characteristic evaluation of the etalons was carried out in one of the optical laboratories of the VTT. The laboratory is air conditioned and provides a stable environment for the experiments. The optical setup was placed on a large optical table using L95 optical rails for proper alignment of the mechano-optical components.
The frequency-stabilized HeNe laser, five-axis laser mount, and ball lens were taken from the GFPI setup at the GREGOR telescope. The optical setup (Figure 3) produced a collimated beam for measuring the surface quality of the etalons. The achromatic lens L1 with a focal length of mm yielded a much larger beam than in the laser channel of the GFPI, and was stopped down to a diameter of mm by a large-aperture iris diaphragm. This diameter was chosen slightly smaller than the free aperture of the etalons (70 mm) to avoid edge effects at the periphery of the etalon plates. Note that the focal length of this collimator lens differs significantly from that of the GFPI laser channel. A test target, which consisted of several USAF 1951 resolving power test targets in combination with a millimeter grid, established the exact position for examining the etalons. Another achromatic lens L2 with a focal length of mm (i.e., the original collimator lens of the GFPI laser channel) was inserted to image the test target on the CCD detector.
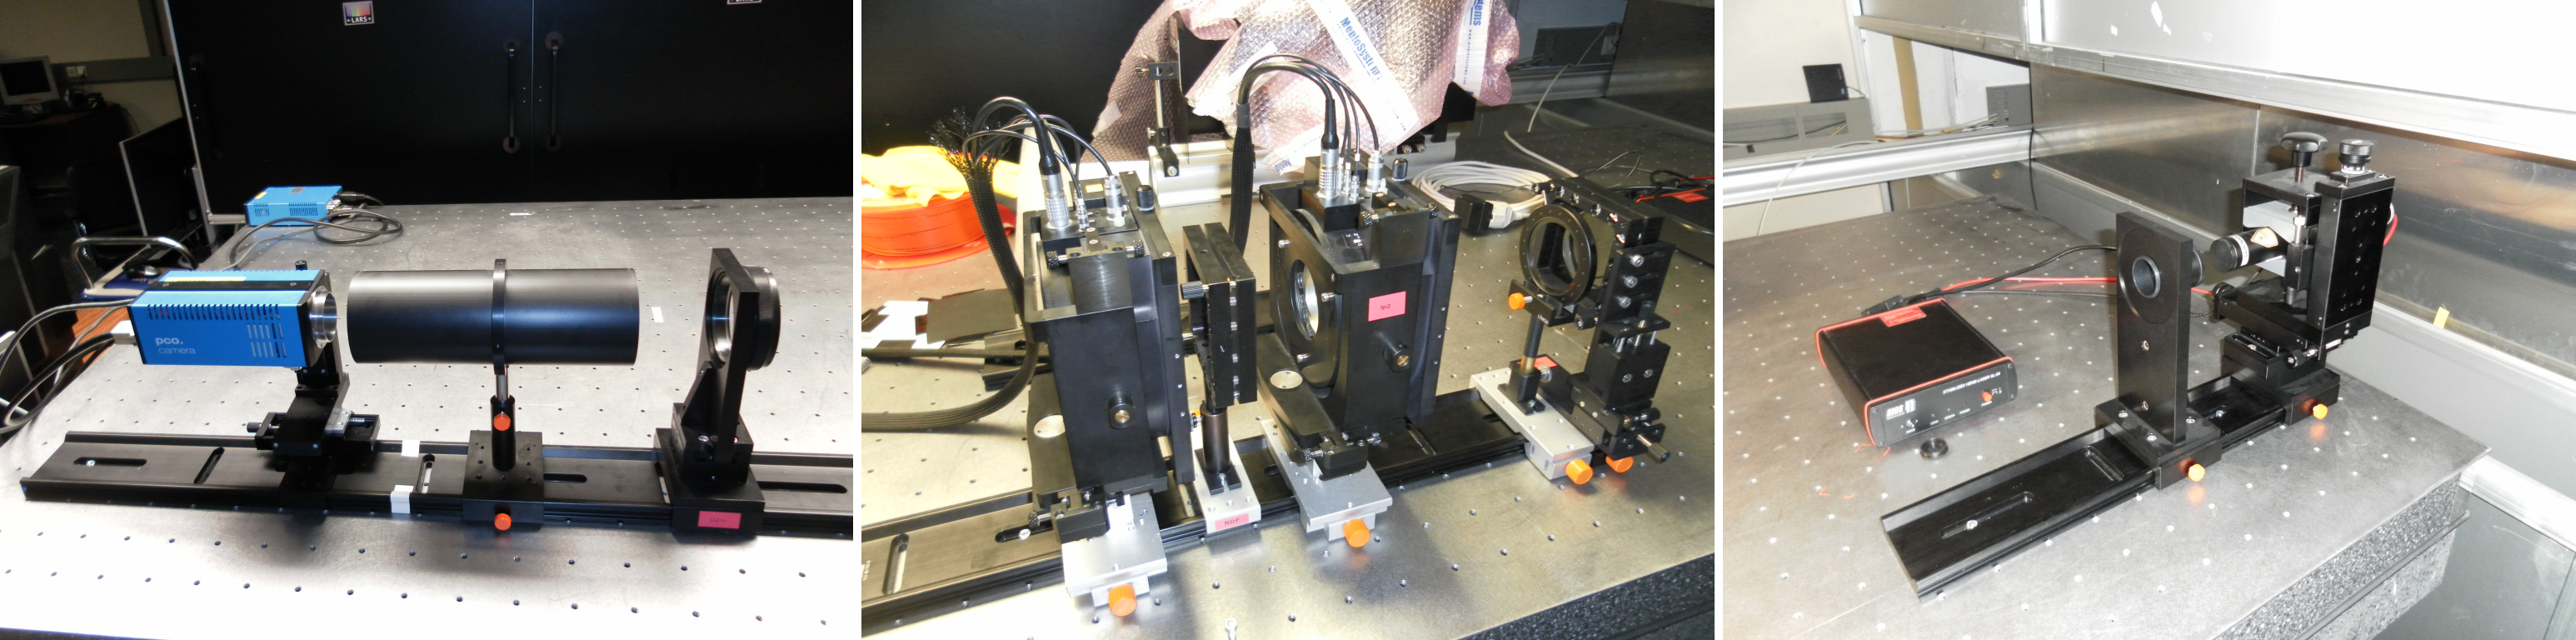
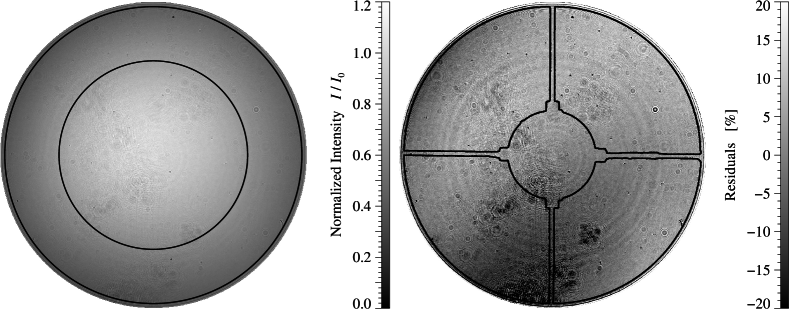
The experimental data were recorded with a pco.4000 CCD camera – one of the facility cameras at the VTT. This large-format detector has a resolution of 4008 2672 pixels, a pixel size of 9 m 9 m, and linear dimensions of 36 mm 24 mm. A smaller region-of-interest (ROI) with 2560 2560 pixels was extracted from the full-format frames, which encompasses the Gaussian intensity distribution of the laser beam. The diameter of the beam covers 2276 pixels on the detector, which results with mm in an image scale of 28.6 m pixel-1. The left panel of Figure 4 shows the Gaussian laser beam. The superimposed outer circle refers to the pupil size in the GFPI narrow-band channel, whereas the inner circle circumscribes the beam in the laser channel of the GFPI, which is used to ensure the parallelism of the etalon plates. A two-dimensional Gaussian with a FWHM = 52 mm was fitted to the beam and the residuals after subtraction from the beam are depicted in the right panel of Figure 4. Artifacts are clearly discernible in this depiction, arising mostly from the cover window of the CCD camera. The contour lines represent the geometry of the entrance pupil of the GREGOR telescope, outlining the support structure of the secondary mirror and the obscuration caused by the secondary mirror. The exact orientation of the pupil image is time dependent because the alt-azimuth mount of the GREGOR telescope introduces image and pupil rotation. Even though the experiments were carried out in the optical laboratory of the VTT, the GREGOR pupil is presented for reference because ultimately the characterization of the etalons must be interpreted in the context of GFPI operations at the GREGOR telescope.
The pco.4000 cameras have two A/D converters for faster readout and higher image acquisition rates. However, since high-cadence imaging was not required, only a single A/D converter was selected to avoid an imbalance of the gain between the two halves of the detector. Image frames were recorded at a rate of 2.8 Hz without binning and with a dynamic range of 14 bit.
Dark frames were acquired by simply covering the CCD detector with a screw-on metal cap. In general, the light level in the optical laboratory was so low that there is no noticeable difference between the dark counts of the covered and uncovered detector. Typically, 20 dark frames are averaged to minimize the thermal and statistical variations inherent to the dark signal. Before inserting one or both etalon(s) into the collimated laser beam, 100 images of the unobscured Gaussian beam were recorded, which serve as a pseudo flat-field frame for the measurements with inserted the etalon(s).
4 Results
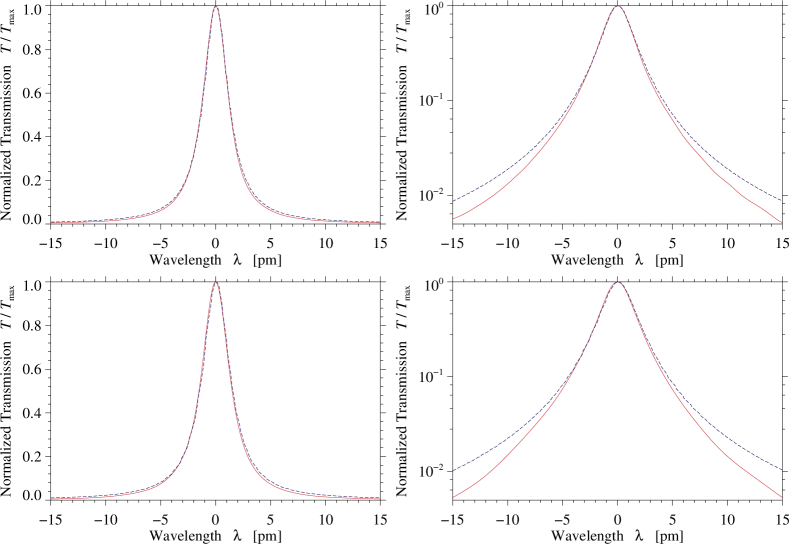
A thorough introduction to Fabry-Pérot etalons is given in the classical monograph Principles of Optics [20] and more recently in a detailed study [21], which compared the collimated and telecentric mount options for etalons with an emphasis on their point spread functions (PSFs) and their performance in measuring Doppler velocities and magnetic fields. The transmission curve of a Fabry-Pérot etalon is given by the Airy function
| (1) |
with
where is the transmitted intensity, indicates absorption of the coating, represents the reflectivity of the coating, is the finesse coefficient, is the phase difference, is the index of refraction, is the plate spacing of the etalon, is the angle of incidence, and is the observed wavelength. The average transmission profile of the etalons is calculated from the local transmission profiles for each pixel contained within the 65-mm aperture after removing the blue-shift, i.e., by aligning the individual transmission peaks. This is accomplished by centering the local profiles using linear interpolation before taking the average. The measured transmission curve of both FPIs is fitted with an Airy function. The results are displayed in Figure 5. The wings of the Airy functions exhibit a higher transmission than the measured curves. The effective finesse for FPI 1 and 2 is and , respectively, which exceeds the conservative value of provided by the manufacturer of the etalons. However, the effective finesse of FPI 1 is lower than that of FPI 2 (see Table 1), which disagrees with calculations based on the coating curves provided by the manufacturer. This discrepancy is also confirmed by the manual finesse measurements during the GFPI laser alignment procedure at the GREGOR telescope. In the later case, the smearing of the average transmission profile because of the blue-shift will lower the finesse values, while limiting the measurements to the central part will raise them. While the measurement differ in detail for both cases, they are in general compatible. Using the logarithm of the transmission curve as input for the fit will result in a better match for the wings. However, the central transmission peak shows stronger deviations in this case, which is not acceptable. Using different weighting functions will also yield slightly different finesse values. Thus, an error of a few percent has to be expected for determining the finesse.
The wavelength shift across the collimated laser beam, i.e., the so-called blue-shift, is used as a measure of the plate parallelism. The observed wavelength shift is derived by fitting the transmission profiles at each pixel with a Lorentzian [22], which yields peak transmision, position, and FWHM of each transmission peak. The Lorentzian is very good approximations of the Airy function in proximity to the transmission peak [23]. Note that Gaussian fits to the measured transmission profiles are inaccurate, i.e., they underestimate the peak transmission by about 10% and overestimate the FWHM by more than 25%. This should be taken into account when comparing finesse measurements reported in literature. Thus, Gaussian fits significantly undervalue the quality of Fabry-Pérot etalons. The averages of the characteristic values are computed for the full beam with a diameter of 65 mm, for the reduced beam with a diameter of 40 mm, and for the pupil mask of the GREGOR telescope with a diameter of 63 mm, which includes the obscuration of the secondary mirror and its support structure. The diameter of 40 mm corresponds the beam size in the GFPI laser channel, which had to be compact due to the limited space inside the GFPI housing. The 63-mm GREGOR pupil is the typical beam shape during GFPI science observations, and the 65-mm free aperture provides a reference for observations with an unobstructed telescope. The motivation for showing all three cases is to validate the alignment procedure of the etalon plates irrespective of the shape and size of beam.
.
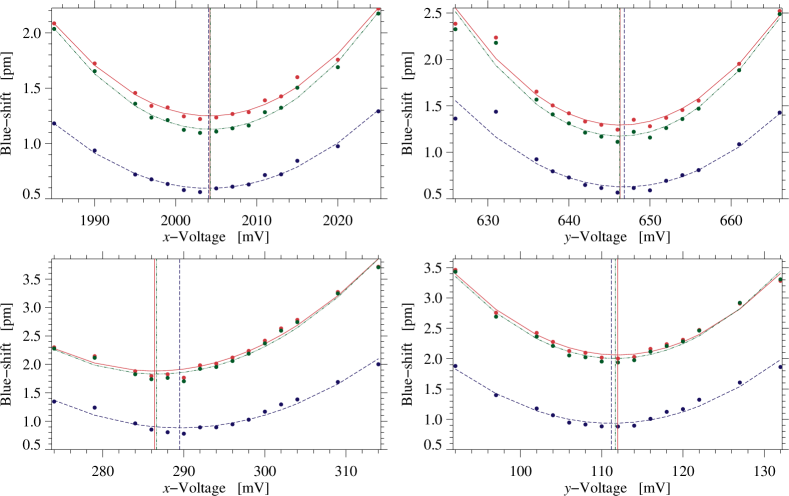
The blue-shift measurements are carried out by manually changing the voltages of the piezoelectric actuators controlling the - and -parallelism of the etalon plates. The scale of the voltage potentiometers is given in steps of 2 mV, i.e., manual adjustments can only achieve a precision of 1 mV. Initially, a voltage range of 40 mV around the transmission peak is sampled with non-uniform voltage increments, where the finest sampling of 2 mV covers the core of the transmission peak. The rough position of the peak can be gauged visually so that the independent scans for the - and -direction are typically already well centered with respect to the orthogonal direction. This results in 15 scans of the transmission curve for the - and -directions. In principle, a two-dimensional blue-shift map can be determined for each of the 30 scans. A second-degree polynomial is fitted to the data for the - and -voltage (Figure 6). The parabolic curves for the - and -directions are slightly different for both FPIs, which could be an indication of minor differences in the response of piezoelectric actuators. The blue-shift curves for the full beam and that for the pupil mask are almost identical. In contrast, the blue-shift values for the reduced 40-mm beam are much lower because it only samples the central part of the etalon plates. The minimum of the blue-shift and the corresponding voltage are saved to perform the final transmission curve scans with a finer resolution of 1 mV in the applied voltage. For both FPIs and in all three cases, the - and -voltages corresponding to the minimum blue-shift are virtually identical (Table 3). The only exception is the -voltage for FPI 2, which can be attributed to the sub-optimal centering of the parabola. In addition, the manual adjustment of the voltages can introduce errors, which easily explain the observed deviations from the parabolic fits. However, taking these limitations into consideration, the presented alignment procedure [15] is very robust and leads to almost identical results for the optimal voltage settings that ensure the parallelism of the etalon plates.
| FPI 1 | |||||
|---|---|---|---|---|---|
| -direction | -direction | ||||
| Voltage [mV] | Shift [pm] | Voltage [mV] | Shift [pm] | ||
| 65 mm | 2004.2 | 1.25 | 646.3 | 1.29 | |
| 40 mm | 2004.1 | 0.60 | 646.8 | 0.63 | |
| GREGOR pupil | 2004.3 | 1.13 | 646.3 | 1.17 | |
| FPI 2 | |||||
| -direction | -direction | ||||
| Voltage [mV] | Shift [pm] | Voltage [mV] | Shift [pm] | ||
| 65 mm | 286.3 | 1.88 | 112.0 | 2.06 | |
| 40 mm | 289.5 | 0.88 | 111.2 | 0.94 | |
| GREGOR pupil | 286.6 | 1.83 | 111.7 | 2.00 | |
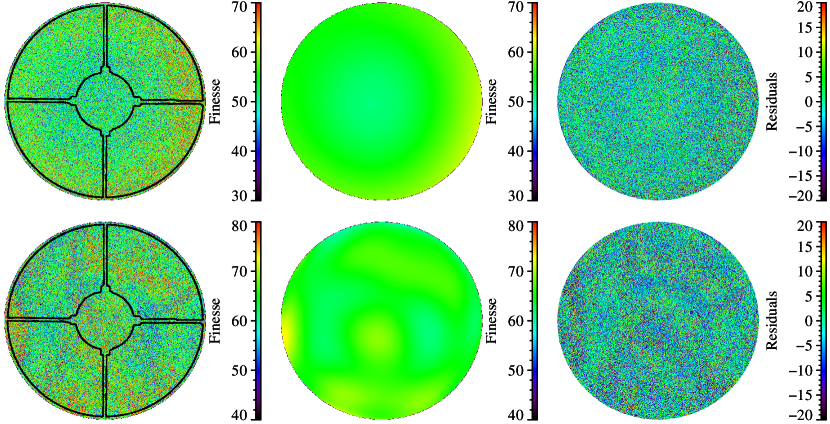
Once the etalon plates are aligned using the values of Table 3, the transmission profiles are scanned with 64 equidistant steps in the -direction and a resolution of 1 mV. The blue-shifts are again computed from Lorentzian fits to the transmission profiles at each pixel. The measured finesse for both FPIs is shown in the left panels of Figure 7, whereas the middle panels depict a representation of the finesse in Zernike polynomials, and the right panels display the residuals after subtraction of the two-dimensional fit from the measured data. Zernike polynomials were already previously used to describe the finesse and other characteristic parameters of Fabry-Pérot etalons [15]. This set of orthogonal polynomials was introduced by the optical physicist Frits Zernike [24] to represent the expansion of a wavefront for optical systems with circular pupils. The polynomials are the product of angular functions and radial polynomials defined on a unit circle. In this work, the Noll-ordering scheme [25] is used, where the mode-ordering number is a function of radial degree and azimuthal frequency . In the following, the two-dimensional maps of the characteristics parameters were constructed from Zernike polynomials with a mode-ordering number up to , which corresponds to a radial degree and azimuthal frequency .
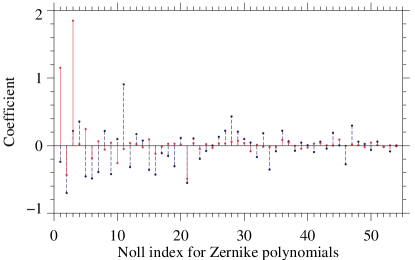
The two-dimensional maps of the finesse of both FPIs (left panels of Figure 7) are fitted with Zernike polynomials up to mode-ordering number . The fitted coefficients are displayed in Figure 8 as red and blue bullets with vertical bars to enhance legibility. The coefficients of FPI 1 become smaller with increasing so that the fit can be terminated at . In contrast, the coefficients of FPI 2 remain significant up to suggesting a limit of . The first coefficient belongs to the piston term, which is essentially the mean value of the effective finesse and 65.2 for FPI 1 and FPI 2, respectively. The coefficients of FPI 1 representing tilt, tip, and oblique astigmatism are significant, i.e., the surface quality of the etalon is characterized by low-order deviations from perfectly parallel plates. In contrast, the coefficients of FPI 2 corresponding to coma, trefoil, and spherical astigmatism are large.
Two-dimensional maps of the effective finesse are derived from the fitted Zernike coefficients and are displayed in the middle panels of in Figure 7 along with the residuals in the right panels. Both FPIs have an atypical property, i.e., the higher finesse values are located at the outer edges and not in the center as expected from previously published measurements of etalon plates [15, 17, 21, 26]. The finesse of FPI 1 has a symmetrical structure with low values in the central part and high values at the outer edges, whereas finesse of FPI 2 has high values in the central part matching the central obscuration of the GREGOR pupil surrounded by an annulus of lower finesse values and accompanied by significant variations of the finesse at the periphery of the etalon plates. The ring-like structure and variation along the perimeter could be caused by the non-uniformly rotating GREGOR pupil. However, original fabrication errors or plates distortions over time cannot be ruled out. The complex pattern of the finesse observed for FPI 2 justifies the choice of a higher limit for Zernike polynomials. The residuals of the fit show a granular pattern for both FPIs indicative of the micro-roughness and the coating inhomogeneities of the etalon plates. The measured effective finesse values for the three beam settings are compiled in Table 4. The mean values of the effective finesse value are similar for all three beams, e.g., choosing the GREGOR pupil yields and for FPI 1 and FPI 2, respectively.
| FPI 1 | FPI 2 | |
|---|---|---|
| 40 mm | ||
| 65 mm | ||
| GREGOR pupil |
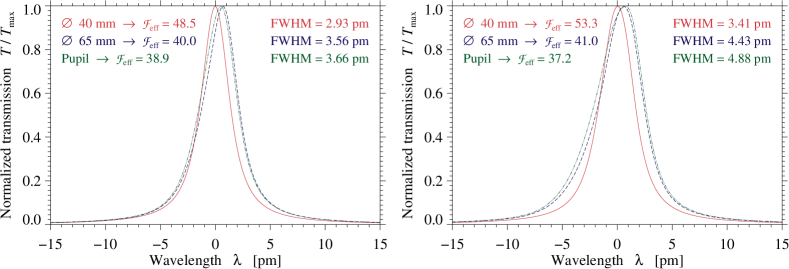
The measured FWHM or finesse across the etalons facilitates simulating the transmission profiles of FPI 1 and FPI 2 as recorded in the GFPI alignment procedure described in Section 2, which also yields the effective finesse for both etalons. In addition, the reflectivity of both etalons (% and %) is needed at the laser wavelength 632.8 nm, which is given in the coating curves provided by the manufacturer. In the simulation, a clean Gaussian beam as described in Section 3, i.e., no interference fringes and no artifacts from in- and out-of-focus dust particles, provides the illumination of the etalons. The peak transmission, blue-shift, and FWHM across the etalons are taken from the laboratory measurements and the Lorentzian fits to the local transmission profiles. The integrated transmission profile, as it will be recorded with the photo-multiplier, can be derived by keeping the transmission profile of one etalon fixed while the other etalon scans the modulated intensity distribution (varying blue-shift and peak transmission). The results for the unobscured 40-mm and 65-mm beams and the 63-mm beam with an imprint of the GREGOR pupil are summarized in Figure 9. Sampling just the central part of the etalons leads to a much higher effective finesse because the local transmission profiles are averaged over a much narrower blue-shift range. In principle, the FWHM will also be narrower in the central part and thus increases the effective finesse. However, as demonstrated in Figure 7, the GFPI etalons show as somewhat atypical finesse distribution, which was attributed to the aging of the coatings. Therefore, the reduced average blue-shift in the central part of the etalons plays the dominant role in shaping the transmission profiles. The transmission profiles are no longer symmetric because illumination as well as blue-shift, peak transmission, and FWHM of both etalons introduce imperfections in real-world applications. Finally, the observed transmission profiles can be approximated by Voigt profiles, where the Lorentzian part is a good approximation of the Airy function and the Gaussian part can be related to the microroughness errors [17]. The wavelength shifts are characterized by the standard deviation of the Gaussian, which are directly proportional to spacing fluctuations, i.e., the microroughness cavity error are nm and 0.78 nm for FPI 1 and FPI 2, respectively. These values are slightly higher but comparable to other studies [17].
The collimator lenses for the GFPI laser channel ( mm) and the experimental setup at the VTT optical laboratory ( mm) introduce a different blue-shift. Thus, the simulated transmission profiles for the laser alignment procedure will differ in both setups and are not directly comparable. However, the significant broadening of the transmission profiles, which is introduced by averaging all blue-shifted profiles across the beam aperture is clearly apparent. Thus, the effective finesse derived in the GFPI alignment procedure underestimates the effective finesse based only on the average of the local FWHM measurements. This difference was not always clearly expressed in literature.
5 Discussion
In this work, we performed a quality assessment of the GFPI etalons. These etalons were in use for more than 10 years. Both etalons and their coatings are still in a very good condition showing only a minor degradation of the coatings. The average finesse values exceed those provided by manufacturer, even when taking the aging of etalon coatings into account. However, the finesse across the etalons exhibits an atypical radial profile with higher values at the edges rather than in the center as observed for other Fabry-Pérot etalons. In addition, FPI 2 is the first etalon in the optical path encountering direct sunlight, and an imprint of the rotating GREGOR pupil is present and clearly evident in the two-dimensional maps of finesse, peak transmission, and FWHM. We attribute this to photo-chemical reactions in the coatings when exposed to sunlight and UV radiation. The order-sorting interference filter are typically blocked at the level for UV radiation. However, the UV exposure over more than 10 years of observations will accumulate, and some alignment procedures even require direct exposure of the etalons to sunlight. In addition, discrepancies of the average effective finesse are observed, especially for FPI 1, when compared with values derived from coating curves provide more than 10 years ago by the manufacturer. Our approach to the characteristic evaluation of Fabry-Pérot etalons is not new [15]. However, the Zernike decomposition of the two-dimensional maps of characteristics is a powerful tool visualizing optical aberrations in imaging spectrometers, which potentially affect the instrument profile. This provided the motivation to carry out the long overdue characteristic evaluation of the GFPI etalons. The present findings are in good agreement with previously published results for other instruments [15, 17]. However, the imprint of the GREGOR pupil necessitated fitting high-order Zernike polynomials to the finesse of FPI 2, i.e., up to mode-ordering number .
Another issue discussed in the present work is related to the operation and calibration of the GFPI, i.e., the impact of various beam sizes and shapes on measuring the plate parallelism. The limited space inside the the GFPI’s protective housing and on top the optical tables restricted the diameter of the collimated laser beam to only 40 mm, which may not be sufficient to represent the overall tilt of the plates in the measuring procedure. Thus, three different configuration were evaluated in the experiments that were carried out in the optical laboratory of the VTT: (1) the current setup of the GFPI with a beam diameter of 40 mm, (2) a much large beam with a diameter of 65 mm, and (3) an arrangement that mimics the GREGOR pupil with an outer diameter of 63 mm. The various etalons properties are listed in Tables 3 and 4 for all three beam configurations. The differences are rather small. In principle, using only inner 40 mm of the etalons to determined the overall tilt of the plates is sufficient and justifies the current calibration procedure of the GFPI.
Inter-etalon reflections in Fabry-Pérot instruments can create ghosts, which are usually eliminated by tilting the etalons. However, tilting the etalons can introduce secondary affects [3]. In the optical alignment of the GFPI ghosts are eliminated by ensuring that the surface of FPI 2 is perfectly perpendicular to the optical axis of the system, i.e., the retro-reflection of a pinhole in the intermediate focus F3 of the GREGOR telescope has to centrally pass an iris stop in the science focus F4, which is one of the fiducial points for the optical alignment of the GFPI. The other fiducial point is the first pupil image within the GFPI transfer optics. The second step is to tilt FPI 1 until all ghost images, e.g., those of a pinhole, are precisely stacked on top of each other. These calibration steps were omitted when individually evaluating the etalons in optical laboratory of the VTT because of the simplicity of the optical setup. However, eliminating ghosts is a critical step in the proper alignment of any Fabry-Pérot instrument.
All etalons suffer from cavity errors, which have to be analyzed in detail [17]. Cavity errors can be separated in two classes, i.e., large-scale and randomly distributed errors. The random errors are caused by coating defects or the roughness of the plate surfaces. The large-scale plate defects are related to errors in figuring the plates, deformations caused by stresses in the coatings, and distortions introduced by the plate mountings. The latter cavity errors can be estimated and described using the Zernike polynomial fitting method [27]. The observed high mode number suggests distortions of the coatings of the FPI 2 plates, which in turn are likely related to aging of these thin dielectric coatings when exposed to sunlight (especially UV radiation) for long periods of time. More recently, the Zernike polynomial fitting technique was adapted and expanded to accurately measure the cavity defects and more importantly to maintain the shape of the cavity while performing spectral scans [26]. This new method incorporates concepts from phase-shifting interferometry and can be used for the any FPI that is tuned by changing the cavity spacing. The present assessment results of the GFPI etalons are encouraging in a sense that the overall quality of etalons remains high after more than a decade. However, etalons and their coatings should be regularly inspected every few years when used in campaign-style observations and even more frequently when operated on a daily basis, as expected for Fabry-Pérot instruments of the next generation of 4-meter aperture telescopes [11, 28, 29].
Disclosures
The authors declare that they have no conflicts of interest.
Acknowledgements.
The 1.5-meter GREGOR solar telescope was built by a German consortium under the leadership of the Kiepenheuer Institute for Solar Physics in Freiburg with the Leibniz Institute for Astrophysics Potsdam, the Institute for Astrophysics Göttingen, and the Max Planck Institute for Solar System Research in Göttingen as partners, and with contributions by the Instituto de Astrofísica de Canarias and the Astronomical Institute of the Academy of Sciences of the Czech Republic. This research has made use of NASA’s Astrophysics Data System. This study was supported by grant DE 787/5-1 of the Deutsche Forschungsgemeinschaft (DFG) and by the European Commission’s Horizon 2020 Program under grant agreements 824064 (ESCAPE – European Science Cluster of Astronomy & Particle Physics ESFRI Research Infrastructures) and 824135 (SOLARNET – Integrating High Resolution Solar Physics). We would like to thank the referees who provided helpful comments improving the manuscript.References
- [1] T. J. Kentischer, W. Schmidt, M. Sigwarth, et al., “TESOS, a Double Fabry-Pérot Instrument for Solar Spectroscopy,” A&A 340, 569–578 (1998).
- [2] A. Tritschler, W. Schmidt, K. Langhans, et al., “High-resolution Solar Spectroscopy with TESOS – Upgrade from a Double to a Triple System,” SoPh 211, 17–29 (2002).
- [3] F. Cavallini, “IBIS: A New Post-focus Instrument for Solar Imaging Spectroscopy,” SoPh 236, 415–439 (2006).
- [4] G. B. Scharmer, “Comments on the Optimization of High Resolution Fabry-Pérot Filtergraphs,” A&A 447, 1111–1120 (2006).
- [5] C. Denker, H. Balthasar, A. Hofmann, et al., “The GREGOR Fabry-Pérot Interferometer: A New Instrument for High-resolution Solar Observations,” in Ground-based and Airborne Instrumentation for Astronomy III, I. S. McLean, S. K. Ramsay, and H. Takami, Eds., Proc. SPIE 7735, 77356M (2010).
- [6] K. G. Puschmann, C. Denker, F. Kneer, et al., “The GREGOR Fabry-Pérot Interferometer,” AN 333, 880 (2012).
- [7] W. Schmidt, O. von der Lühe, R. Volkmer, et al., “The 1.5 Meter Solar Telescope GREGOR,” AN 333, 796–809 (2012).
- [8] C. Denker, O. von der Lühe, A. Feller, et al., “A Retrospective of the GREGOR Solar Telescope in Scientific Literature,” AN 333, 810–815 (2012).
- [9] F. Kneer, “Hopes and Expectations with GREGOR,” AN 333, 790–795 (2012).
- [10] W. Schmidt, A. Bell, C. Halbgewachs, et al., “A Two-dimensional Spectropolarimeter as a First-light Instrument for the Daniel K. Inouye Solar Telescope,” in Ground-based and Airborne Instrumentation for Astronomy V, S. K. Ramsay, I. S. McLean, and H. Takami, Eds., Proc. SPIE 9147, 91470E (2014).
- [11] A. Tritschler, T. R. Rimmele, S. Berukoff, et al., “Daniel K. Inouye Solar Telescope: High-resolution Observing of the Dynamic Sun,” AN 337, 1064 (2016).
- [12] T. R. Rimmele and J. Marino, “The Evershed Flow. Flow Geometry and its Temporal Evolution,” ApJ 646, 593–604 (2006).
- [13] M. G. Löfdahl, M. J. van Noort, and C. Denker, “Solar Image Restoration,” in Modern Solar Facilities – Advanced Solar Science, F. Kneer, K. G. Puschmann, and A. D. Wittmann, Eds., 119–126 (2007).
- [14] C. Denker, A. Tritschler, and M. Löfdahl, “Image Restoration,” in Encyclopedia of Optical and Photonic Engineering, C. Hoffman and R. Driggers, Eds., 1–9, CRC Press, 2nd ed. (2015).
- [15] C. Denker and A. Tritschler, “Measuring and Maintaining the Plate Parallelism of Fabry-Pérot Etalons,” PASP 117, 1435–1444 (2005).
- [16] C. Denker, L. Didkovsky, J. Ma, et al., “Imaging Magnetographs for High-resolution Solar Observations in the Visible and Near-infrared Wavelength Region,” AN 324, 332–333 (2003).
- [17] K. P. Reardon and F. Cavallini, “Characterization of Fabry-Pérot Interferometers and Multi-etalon Transmission Profiles. The IBIS Instrumental Profile,” A&A 481, 897–912 (2008).
- [18] K. G. Puschmann, F. Kneer, H. Nicklas, et al., “From the ”Göttingen” Fabry-Perot Interferometer to the GREGOR FPI,” in Modern Solar Facilities – Advanced Solar Science, F. Kneer, K. G. Puschmann, and A. D. Wittmann, Eds., 45 (2007).
- [19] N. Bello González and F. Kneer, “Narrow-band Full Stokes Polarimetry of Small Structures on the Sun with Speckle Methods,” A&A 480, 265–275 (2008).
- [20] M. Born and E. Wolf, Principles of Optics, Cambridge University Press, Cambridge, UK, 6th ed. (1998).
- [21] F. J. Bailén, D. Orozco Suárez, and J. C. del Toro Iniesta, “On Fabry-Pérot Etalon-based Instruments. I. The Isotropic Case,” ApJS 241, 9 (2019).
- [22] C. B. Markwardt, “Non-linear Least-squares Fitting in IDL with MPFIT,” in Astronomical Data Analysis Software and Systems XVIII, D. A. Bohlender, D. Durand, and P. Dowler, Eds., ASP Conf. Ser. 411, 251–254 (2009).
- [23] G. J. Sloggett, “Fringe Broadening in Fabry-Perot Interferometers,” Appl. Opt. 23, 2427–2432 (1984).
- [24] F. Zernike, “Beugungstheorie des Schneidenverfahrens und seiner verbesserten Form, der Phasenkontrastmethode,” Physica 1, 689–704 (1934).
- [25] R. J. Noll, “Zernike Polynomials and Atmospheric Turbulence,” JOSA 66, 207–211 (1976).
- [26] V. Greco, A. Sordini, G. Cauzzi, et al., “New Technique to Measure the Cavity Defects of Fabry-Pérot Interferometers,” A&A 626, A43 (2019).
- [27] C. Denker, D. Mascarinas, Y. Xu, et al., “High-Spatial Resolution Imaging Combining High-Order Adaptive Optics, Frame Selection, and Speckle Masking Reconstruction,” SoPh 227, 217–230 (2005).
- [28] S. A. Matthews, M. Collados, M. Mathioudakis, et al., “The European Solar Telescope (EST),” in Ground-based and Airborne Instrumentation for Astronomy VI, Proc. SPIE 9908, 990809 (2016).
- [29] J. Jurčák, M. Collados, J. Leenaarts, et al., “Recent Advancements in the EST Project,” Adv. Space Res. 63, 1389–1395 (2019).
Meetu Verma is a post-doctoral researcher at the Leibniz Institute for Astrophysics Potsdam (AIP). She received her doctoral degree in physics from the University Potsdam in 2013. Thereafter, she worked as a post-doctoral researcher at Max Planck Institute for Solar System Research in Göttingen and returned one year later to AIP. Her current research interests cover high-resolution observations of solar magnetic features, in particular, multi-instruments and multi-wavelength studies of sunspots in various stages of evolution. She organized and participated in many observing campaigns, in particular coordinated campaigns including space missions and German/U.S. solar telescopes.
Carsten Denker is head of the “Solar Physics” section and the solar observatory “Einstein Tower” at the Leibniz Institute for Astrophysics Potsdam (AIP). He holds a doctoral degree in physics and a diploma in social sciences from the Georg-August University Göttingen. He regularly teaches astronomy and astrophysics lectures as an adjunct professor at the University Potsdam with an emphasis on solar and stellar physics. He is engaged in research and development of instruments for high-resolution solar physics and serves as the instrument PI of GFPI and HiFI. His research efforts concentrate on photospheric and chromospheric magnetic fields and activity, fine structure of sunspots, space weather, imaging spectropolarimetry, and image restoration.