Asymmetric Drift of Andromeda Analogs in the IllustrisTNG Simulation
Abstract
We analyze the kinematics as a function of stellar age for Andromeda (M31) mass analogs from the IllustrisTNG cosmological simulation. We divide the star particles into four age groups: Gyr, Gyr, Gyr, and Gyr, and compare the kinematics of these groups to that of the neutral gas cells. We calculate rotation curves for the stellar and gaseous components of each analog from 2 kpc to 20 kpc from the center of mass. We find that the lag, or asymmetric drift (AD), between the gas rotation curve and the stellar rotation curve on average increases with stellar age. This finding is consistent with observational measurements of AD in the disk of the Andromeda galaxy. When the M31 analogs are separated into groups based on merger history, we find that there is a difference in the AD of the analogs that have had a 4:1 merger the last 4 Gyr, 8 Gyr, or 12 Gyr compared to analogs that have not experienced a 4:1 merger in the same time frame. The subset of analogs that have had a 4:1 merger within the last 4 Gyr are also similar to AD measurements of stars in M31’s disk, providing evidence that M31 may in fact have recently merged with a galaxy nearly 1/4 of its mass. Further work using high resolution zoom-in simulations is required to explore the contribution of internal heating to AD.
keywords:
galaxies: kinematics and dynamics; galaxies: M31; galaxies: asymmetric drift; hydrodynamical simulations1 Introduction
The kinematics of stars are influenced by dynamical heating events that occur within (i.e., Giant Molecular Clouds (GMCs), spiral arms, bars) or to (i.e., mergers) the galaxies they reside in. Such events are common, are needed to explain the present-day properties of galaxies, and could explain what makes some galaxies unique (e.g. Seth et al., 2005; Walker et al., 1996). Because of their similar masses (), the Milky Way (MW) and the Andromeda (M31) galaxies are considered to be analogs of each other (e.g. Patel et al., 2017). However, despite this similarity, the disk kinematics of the MW and M31 differ drastically. The MW has a population of thin disk stars, while almost all of the disk stars in M31 exist in a thick or kicked up disk (Dorman et al., 2013). These stars are much hotter than classical thin disk stars (Dorman et al., 2013). Additionally, the disk of M31 has a higher velocity dispersion than our own solar neighborhood (Holmberg et al., 2009; Sysoliatina, K. et al., 2018; Dorman et al., 2015; Budanova et al., 2017) and a steeper age-velocity dispersion gradient than the MW (Dorman et al., 2015; Bhattacharya et al., 2019). While it is possible that the MW and M31 formed under different conditions that led to their distinct dynamics, mergers may also explain the higher velocity dispersion observed in M31 (Leaman et al., 2017). As searching for evidence of dynamical heating via internal and external sources is more easily accessible than disentangling different galactic birth conditions, in this study, we aim to understand the impact of external sources of dynamical heating, specifically that caused by mergers, on the observed kinematics of stellar populations in M31.
Mergers lead to the growth of galaxies via the accretion of gaseous and stellar material to the inner and outer regions of galaxies (Abadi et al., 2003); thus they affect not only galactic disks but also the halos of galaxies by perturbing the orbits of stars residing at radial distances of a few to a few hundred kiloparsecs from the center of a galaxy (e.g. Quinn & Goodman, 1986). These dynamically heated stars can lead to a kicked-up or puffed up disk, like the one seen in M31 (e.g. Purcell et al., 2010; Dorman et al., 2013). Additionally, simulations show that mergers can heat or accrete stars: these heated or accreted stars can have a permanent increase in velocity dispersion of up to 400% when compared to stars formed in-situ (Walker et al., 1996). Since stars have long dynamical time scales, they retain these differences (e.g. Abadi et al., 2003; Purcell et al., 2010). In addition to heating existing stars, mergers can play an important role in setting the birth kinematics of stars. Brook et al. (2004) illustrate that stars born in epochs of rapid accretion of gas from hierarchical growth exhibit different and much hotter kinematics than stars that were born during periods of quiescence. Thus, mergers play an important role both in setting the birth kinematics of stars in a merger event and also heating the kinematics of existing stars.
Because of its relatively close proximity of 785 kpc (McConnachie et al., 2005), we can study the entire disk and halo of M31 using individual, resolved stars and search for evidence of mergers. In the last decade, two major surveys of the M31 region have revealed potential relics of mergers throughout M31’s disk and halo. The wide-field Pan-Andromeda Archaeological Survey (PAndAS; Ibata et al., 2007; Ibata et al., 2013) has surveyed the halo of M31 to a projected distance of 150 kpc, revealing debris in the form of tidal streams and shelves (e.g. Hernquist & Quinn, 1988, 1989; Escala et al., 2019; McConnachie et al., 2018). The most prominent debris feature is the Giant Stellar Stream (GSS) (Ibata et al., 2001, 2005; Ferguson et al., 2002), which spans nearly 100 kpc from the center of M31. The second survey is the Pan-chromatic Hubble Andromeda Treasury (PHAT) (Dalcanton et al., 2012; Williams et al., 2014), which among other discoveries has revealed M31’s global star formation history (Lewis et al., 2015; Williams et al., 2017), a ring of star formation at 10 kpc (Lewis et al., 2015), and the age-velocity dispersion relation (Dorman et al., 2013).
As more evidence for a fairly constant and violent merger history for M31 have emerged, so has the question about the types of mergers that shaped M31 into the galaxy we see today. Until recently, the favored theories for M31’s formation history were an ancient major merger followed by a series of minor mergers (e.g. van den Bergh et al., 2006; Courteau et al., 2011; Kormendy et al., 2013). Simulations of minor mergers in M31’s halo have successfully recovered many observed features: the simulations from Tanaka et al. (2009) show that roughly 15 minor mergers are necessary to form the stellar debris seen in M31 today, and Fardal et al. (2008) illustrates that a minor merger can recover the formation and velocity dispersion of the GSS as well. Furthermore, the motions of globular clusters at high galactic radii suggest that M31 has had more than one major period of accretion (Mackey et al., 2019). However, new studies suggest that instead of an ancient and larger merger, a relatively recent (2-3 Gyr ago) major merger could explain many of these observed phenomenon while preserving the disk of M31 (D’Souza & Bell, 2018). For example, Hammer et al. (2018) find a major merger model recovers both the substructure resembling the GSS and the age-velocity dispersion gradient in M31’s disk (Dorman et al., 2015). They conclude a major merger can explain the burst of star formation approximately 2 Gyr ago (Williams et al., 2017), a ring of star formation at 10 kpc (Lewis et al., 2015), and the mass of the stellar halo (Ibata et al., 2013; Bell et al., 2017). Thus, while it is believed that M31 has had a long and ongoing history of accretion (e.g. Ferguson & Mackey, 2016), the exact merger history is still unknown, and therefore leads to an ongoing debate as to whether or not a single, recent major merger could explain several observed properties in M31’s halo and disk better than a series of recent minor mergers.
Hammer et al. (2018) highlight the importance of recovering M31’s disk dynamics when testing different merger histories for M31. In this study, we aim to determine if the relative difference between the stellar dynamics and gas dynamics of the disk of M31 are consistent with a major merger scenario. To do so, we will analyze the stellar and gas dynamics across a sample of M31 mass analogs selected from a cosmological simulation, accounting for a range of merger histories across a large sample of simulated galaxies, and compare these properties to observed measurements of the lag between the gas rotation velocity and that of the stars, or the asymmetric drift (AD), in the disk of M31 from Quirk et al. (2019, hereafter Q19). In doing so, we will explore whether AD changes with merger history and thereby determine how significant of a role external dynamical heating has played in the current kinematics of these analogs.
In this study, we are solely limited to exploring the effects of external sources of dynamical heating (i.e. mergers) because the resolution of simulated analogs selected from a cosmological box does not allow us to probe internal sources occurring on sub-kiloparsec scales such as perturbations from spiral waves (e.g. Sellwood & Binney, 2002; Sellwood, 2014), galactic bars (e.g. Dehnen & Binney, 1998; Saha & Elmegreen, 2018), or GMCs (e.g. Jenkins & Binney, 1990; Ting & Rix, 2019). As such, we cannot comment on the effects of these drivers on the disk dynamics of massive galaxies. While internal sources of heating affect a galaxy’s kinematics, they cannot alone explain the kinematics observed today. External sources of dynamical heating, mergers, are also necessary to explain some Local Group galaxies’ velocities (Leaman et al., 2017). Furthermore, while stellar feedback can drastically affect the disk of galaxies less massive than the MW or M31 (El-Badry et al., 2016), mergers are more important than stellar feedback for setting the present-day kinematics of massive galaxies. Thus, in this work we focus solely on the effects of external dynamical heating on AD, with the overarching goal of shedding light on the recent merger history of M31.
This paper is organized as follows: in Section 2, we discuss the IllustrisTNG simulations and the selection criteria we use to choose our sample of analogs. Section 3 describes the methods used to calculate rotation velocities, construct rotation curves, and calculate AD. In Section 4, we illustrate how AD as a function of stellar age changes with merger history, and in Section 5 we make comparisons to observational results. In Section 6, we summarize our findings.
2 Data
2.1 The Illustris Suite
The IllustrisTNG Project is a suite of N-body and hydrodynamic simulations evolved from redshift to using the moving-mesh AREPO code (Marinacci et al., 2018; Naiman et al., 2018; Springel et al., 2018; Pillepich et al., 2018; Nelson et al., 2018; Springel, 2010). The simulations span a cosmological volume of (110.7 Mpc)3 and are initialized with the following cosmological parameters from Planck Collaboration et al. (2016): , , , , , and . Throughout our analysis, we adopt a value of (WMAP-9; Hinshaw et al., 2013).
The IllustrisTNG Project (Marinacci et al., 2018; Naiman et al., 2018; Springel et al., 2018; Pillepich et al., 2018; Nelson et al., 2018) is a follow-up suite of simulations to the original Illustris Project (Nelson et al., 2015; Vogelsberger et al., 2014), including an updated galaxy formation model described in Weinberger et al. (2018a) and Pillepich et al. (2018). The most significant improvements to the galaxy formation model include the treatment of AGN feedback, an improved parametrization of galactic winds, and the addition of magnetic fields.
In our analysis, we use data from the IllustrisTNG100-1 simulation (hereafter IllustrisTNG), the midsize and mid-resolution simulation in the suite including both dark matter and baryons. IllustrisTNG follows the evolution of 18203 dark matter particles and 18203 hydrodynamical cells, achieving a dark matter particle mass resolution of and a baryonic mass resolution of . Halos and subhalos are identified using the SUBFIND (Springel et al., 2001; Dolag et al., 2009) halo-finding routine. We use the IllustrisTNG merger trees created with the SUBLINK code (Rodriguez-Gomez et al., 2015) to track the mass history of subhalos in our analysis. In the following sections, we identify a primary sample of M31 analogs in IllustrisTNG.
2.2 Selection of M31 Mass Analogs
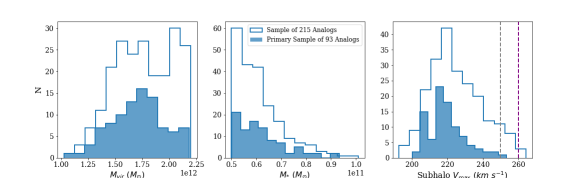
M31 analogs are chosen as all central (or primary) subhalos at where the FoF group virial mass is (see D’Souza & Bell, 2018). Virial mass is calculated for each SUBFIND FoF group following the methods of Bryan & Norman (1998). We also require that these primary subhalos have a stellar mass within the range (Tamm et al., 2012; Sick et al., 2014). Finally, we require that the maximum circular velocity for each subhalo is at least 200 to ensure that our analogs generally represent the observed HI rotation curve of M31 (Chemin et al., 2009; Corbelli et al., 2010). Using these selection criteria, we find 216 M31 analogs in IllustrisTNG. We eliminate one analog that has no associated gas, bringing the full sample to a total of 215 analogs.
The left panel of Figure 1 shows the distribution of virial masses for the full sample (blue histogram) and for the subset of 93 M31 analogs that will serve as the primary sample (blue filled histogram). The primary sample is selected based on visual inspection of each simulated galaxy’s rotation curve and provides a checkpoint to eliminate any analogs without sufficient statistics to calculate both stellar and gaseous rotation curves (see Section 3.3). The middle and right panels show the distribution of stellar mass and maximum circular velocity, respectively, for the full sample of M31 analogs in IllustrisTNG (blue histograms) and the primary sample (blue filled histograms). The gray vertical line in the right panel indicates the maximum circular velocity of M31’s HI rotation curve (Corbelli et al., 2010). All three properties of the primary sample are representative of the broader population of M31 analogs.
2.3 Stellar Assembly for IllustrisTNG Analogs
Our main goal is to explore if the merger history of galaxies in our simulated sample show any correlation with the values of AD. As such, the stellar assembly and merger history catalogs for the IllustrisTNG suite are also used to probe the formation histories of the M31 analogs identified in Section 2.2. The stellar assembly and merger histories of the original Illustris-1 simulated galaxies are discussed in Rodriguez-Gomez et al. (2015); Rodriguez-Gomez (2016); Rodriguez-Gomez et al. (2016). The same tools were used to create the equivalent catalogs for IllustrisTNG. Below, we describe the properties of interest for this analysis and their definitions as defined by the previously mentioned papers.
-
•
time of last major merger: the lookback time at which the last major merger (stellar mass ratio 4:1) occurred
-
•
total number of major mergers: the total number of completed major mergers (stellar mass ratio 4:1)
-
•
total number of minor mergers: the total number of completed minor mergers (stellar mass ratio 10:1 and 4:1)
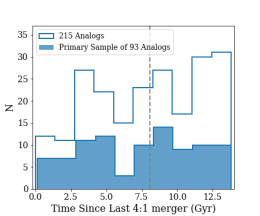
Figure 2 shows the distribution of the time of last major merger for the 215 M31 analogs in our primary sample. The median time of last major merger is 8 Gyr ago as denoted by the vertical dashed gray line, thus many analogs have had relatively quiet recent merger histories.
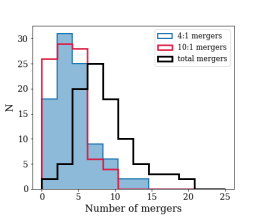
Figure 3 illustrates the total number of mergers (major and minor) for the primary sample in black. The distribution of total 4:1 mergers is indicated by the blue filled histogram and the total number of 10:1 mergers is represented by the red histogram. On average, M31 analogs in our primary sample experience 5-10 mergers in total. In total, the primary sample experiences 441 4:1 mergers, 369 10:1 mergers, summing to 810 mergers overall.
3 Methods
AD is often defined as the difference between the circular velocity derived from the potential and the stellar rotation velocity (Strömberg, 1946). For the purposes of comparing this work to Q19, we define AD slightly differently than Strömberg (1946) and Walker et al. (1996). Instead of relying on models of the potential to calculate circular velocity, we use the rotation velocity of the gas data to calculate AD, as in Q19, since this gives a more empirical measurement.
The rotation velocity of the gas is used as a proxy for circular velocity because gas is collisional and therefore can easily dissipate energy and maintain a low energy orbit (Sellwood & Moore, 1998). Gas creates radial pressure support, which in low mass disks can cause the tangential velocity of the gas to fall below its circular velocity; however this is not the case for massive disks like M31 (Dalcanton & Stilp, 2010). Stars, on the other hand, are not collisional and thus can maintain an eccentric orbit if they are gravitationally perturbed. When comparing their circular rotation velocities, stars may lag behind gas because they are following a different orbital path and/or moving more slowly.
In this sense, AD is a measurement of the difference between a star’s orbit and a roughly circular orbit, as the gas is only a proxy for circular velocity. Thus, it can also be treated as a long-term effect of dynamical heating. Since the perturbations from dynamical heating can permanently alter the orbital paths of stars (e.g. Leaman et al., 2017), it can change a star’s angular momentum such that random motions are increased in a stellar population, and thus the group’s average motion is less dominated by orderly rotation (Sellwood & Binney, 2002). Effects of dynamical heating may be long lasting, and individual stars in galaxies often preserve the effects of heating. Walker et al. (1996) find that minor mergers temporarily increase AD in a galaxy using idealized N-body simulations.
In this work, we will focus on the effect of external dynamical heating, and specifically that caused by 4:1 major mergers for a cosmological sample of M31 mass analogs. Where possible, we will make comparisons to existing AD measurements in M31, as this is the only galaxy for which observational results of AD as a function of stellar age are available (Q19). In our own galaxy, AD has been used to construct rotation curves beyond the solar neighborhood and to correct the local standard of rest (LSR) (Golubov, 2014; Huang et al., 2016) but has not been studied as a function of age or for individual stars.
3.1 Rotating the Coordinates
To calculate rotation curves and subsequently AD, we first apply a center of mass (COM) shift and rotate the particles/cells in each simulated M31 analog to a face-on reference frame. IllustrisTNG particle/cell positions and velocities are reported relative to the simulation box edges, so we first shift the data to a (0,0,0) Cartesian reference frame by subtracting the COM of the dark matter halo from both the stellar and gaseous data. This COM position comes directly from the IllustrisTNG group catalogs (i.e. the position of each FoF group). We have checked whether using the center of mass of the baryons rather than the dark matter alters the results and find no significant differences.
To rotate the particle/cell data to a face-on reference frame, we calculate the net specific angular momentum vector for all gas cells belonging to a given halo. Then we apply a rotation matrix to the cell data such that the unit vector of the net angular momentum of the gas is mapped to the z-axis in the face-on reference frame. The same procedure is repeated with all star particles belonging to a given halo. Thus, the stars and gas are each rotated with respect to their own net angular momenta. In this new reference frame, the galaxy’s disk lies in the xy-plane. Finally, particles with a z scale-height 10 kpc are eliminated to ensure we only include data for the gas and stars roughly in the disks to construct rotation curves and subsequently AD.
3.2 Smoothing the Particles/Cells
Once the particles/cells are rotated to the face-on reference frame, we divide the stellar particles into four broad age groups: Group 1 with ages Gyr, Group 2 with ages Gyr, Group 3 with ages Gyr, and Group 4 with ages Gyr. These age bins differ from those used in the observational analysis of AD in M31 in Q19 in order to take advantage of the full range of stellar particle ages that exists in the IllustrisTNG simulation. The observational constraints on M31 in Q19 are limited to stellar ages of up to 4 Gyr, as older stars are too faint to observe easily. IllustrisTNG, on the other hand, provides ages spanning approximately a Hubble time. However, there is a lack of young ( Myr) stars in IllustrisTNG, which prevents us from breaking Group 1 into age bins that better match the observational results in M31. This lack of young stars may be a result of the AGN feedback model in IllustrisTNG (Weinberger et al., 2018b; Terrazas et al., 2020).
Q19 calculates AD of stars with respect to neutral Hi gas. To follow this, we also calculate AD with respect to neutral gas data in this analysis. With the IllustrisTNG simulated galaxies, we implement this by limiting our analysis to only include the gas data where the neutral hydrogen fraction, , is above some threshold. Since there is no exact boundary for what gas constitutes as neutral, we initially varied the neutral fraction cutoffs to find the highest fraction that still included enough gas cells for good statistics and to have a full spatial expanse across the inner 20 kpc of each analog. We find that 0.6 is a reasonable threshold, as on average of gas particles fall into this range for the primary sample.
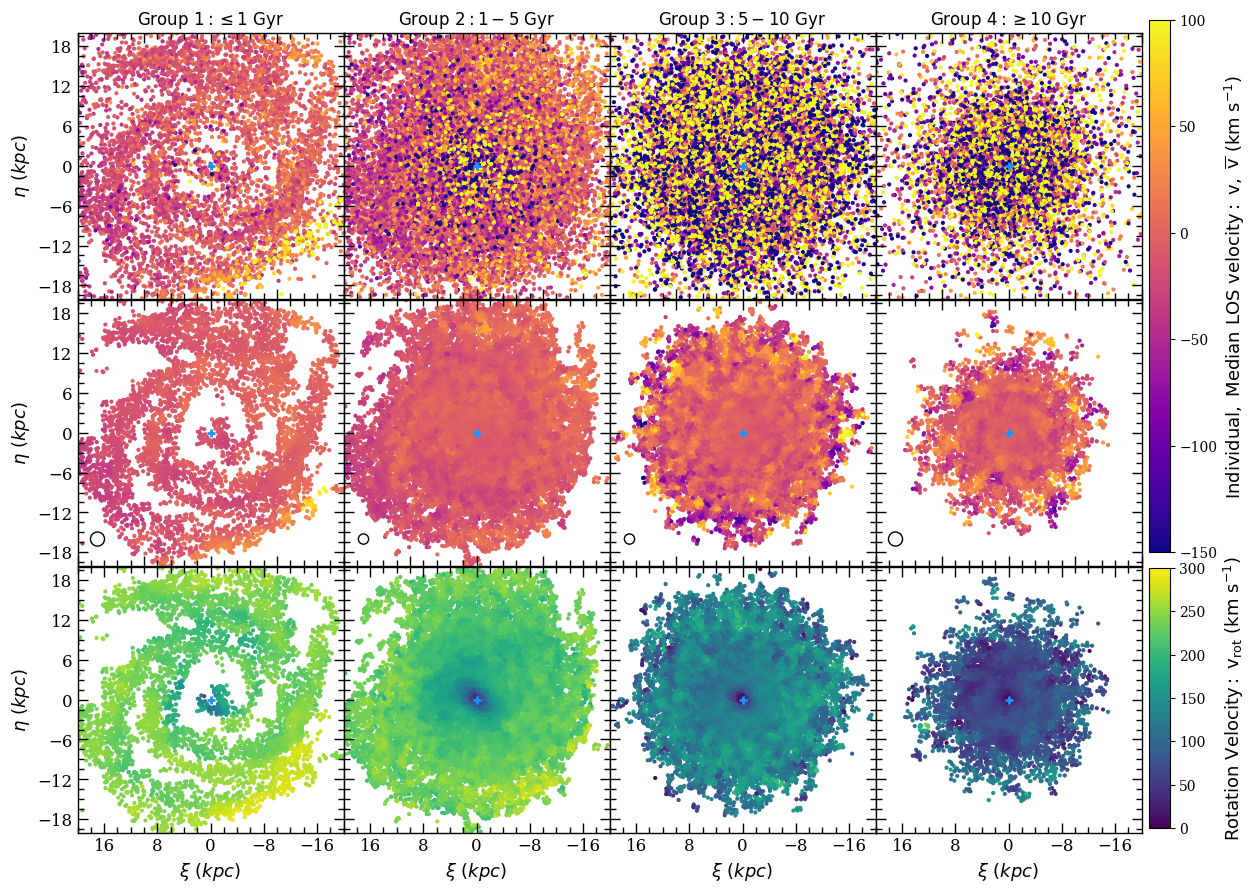
After the stellar particles are divided into the four age groups and the neutral gas cells are isolated, we locally smooth the line-of-sight velocity (the vertical component or in the face-on reference frame). Instead of smoothing velocities using a grid of set positions, we use the true positions of all particles/cells in a given M31 analog and center a smoothing circle on each particle/cell, as in Dorman et al. (2015) and Q19.For stellar age Groups 2 and 3, we use a circle of radius 0.75 kpc and a circle of 1.05 kpc for the less populated Groups 1 and 4 and for the neutral gas cells. This radius size mimics the 200 ″-275 ″resolution in Hi observations in M31, described in Q19. The size of the circle was optimized to probe local kinematics and to include enough data points for good statistics. If there are at least 10 particles/cells in a circle, we assign the median of the velocity components to that particle/cell. We use these median components to calculate a rotation velocity and assign it to the position of the particle/cell that the circle is centered on. If there are not 10 members in a particle’s/cell’s smoothing circle, we do not calculate a rotation velocity at that position. That particle/cell may still be included in the membership of nearby circles and thus would contribute towards the calculation of the median velocities at other positions if those circles pass the membership requirement. We also experimented with adjusting circle membership requirements to balance retaining data with being able to smooth the data. Similar to Q19, we chose a membership requirement of 10.
To ensure that our smoothing does not obscure any substructures in the rotation curves and subsequent bias to AD, we created rotation curves with and without the smoothing and find no significant differences. We illustrate the smoothing process for an example halo in our primary sample in Section 3.3.2.
3.3 Calculation of Rotation Curve
For the rest of our analysis, we use the smoothed kinematics for the primary sample of M31 analogs. We calculate a rotation velocity for every star particle and gas cell that passes the circle-membership requirement in the smoothing process. To calculate the rotation velocity, we find the tangential velocity of the particles/cells by first calculating the projected radial velocity and the total planar velocity, shown in the equations below. We limit our rotation velocity calculations to the 2D xy plane in our face-on rotated frame so the resulting rotation velocities are comparable to de-projected rotation velocities in observations (Q19).
| (1) |
| (2) |
| (3) |
The above procedure gives us a rotation velocity for every smoothed star particle and neutral gas cell. To calculate AD we must be able to directly compare the rotation velocity of the star particles and neutral gas cells. However, the gas cells and star particles do not have the same spatial extent and analogs typically have an unequal number of stellar particles and gas cells. Instead of trying to pair each star particle to a neutral gas cell as in Q19, we radially bin all of the particles/cells and calculate the median rotation velocity within that bin. Our radial bins sample from 2 kpc to 20 kpc with a spacing of 0.1 kpc. We radially bin in this fashion separately for each stellar age bin and also for the neutral gas cells. As seen in the bottom panel of Figure 5, there is no clear azimuthal dependence of the rotation velocity, so we do not obscure any local substructure through this binning.
3.3.1 Visual Inspection of Rotation Curves
Since both the gas cells and star particles of these M31 analogs are necessary to calculate AD, we perform an additional visual inspection of the rotation curves of each analog in the full sample to ensure they have enough spatially overlapping stellar particles and gas cells across the inner 20 kpc of the analog. Those that do not have spatial overlap between the gas cells and star particles for at least five radial bins are removed. After this visual inspection, 93/215 M31 analogs from IllustrisTNG remain and will be referred to as the primary sample.
3.3.2 Demonstrating Smoothing Particle/Cell Data
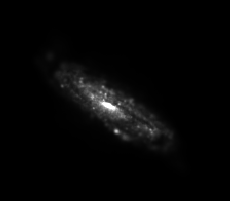
In this section, we choose an analog from the primary sample that best represents M31’s rotation curve to demonstrate smoothing the particle/cell data prior to calculating rotation curves. The halo properties of this example analog are listed in Table 1, and the mock image of this simulated galaxy is shown in Fig 4 (Torrey et al., 2015; Rodriguez-Gomez et al., 2019). The results of velocity smoothing (described in Section 3.2) for this analog is illustrated in Figure 5, which shows the individual line-of-sight velocity, the post-smoothing median line-of-sight velocity, and the rotation velocity of each star particle for the four age bins as a function of position. For this analog, 16088 of the original 19919 central neutral gas cells remain after the smoothing process, and 77832 of the 87141 central star particles remain. This is typical of M31 analogs in the primary sample. The smoothed kinematic data retains the underlying kinematics needed to calculate AD without strong loss of information, so we continue to smooth the data for the entire primary sample.
| Time Since Last 4:1 Merger | 4.12 Gyr |
|---|---|
| Number of 4:1 Mergers | 4 |
| Number of 10:1 Mergers | 5 |
3.4 Calculation of AD as a function of Stellar Age
AD, (also denoted by ), is the difference between the rotation velocity of the gas and that of the stars.
| (4) |
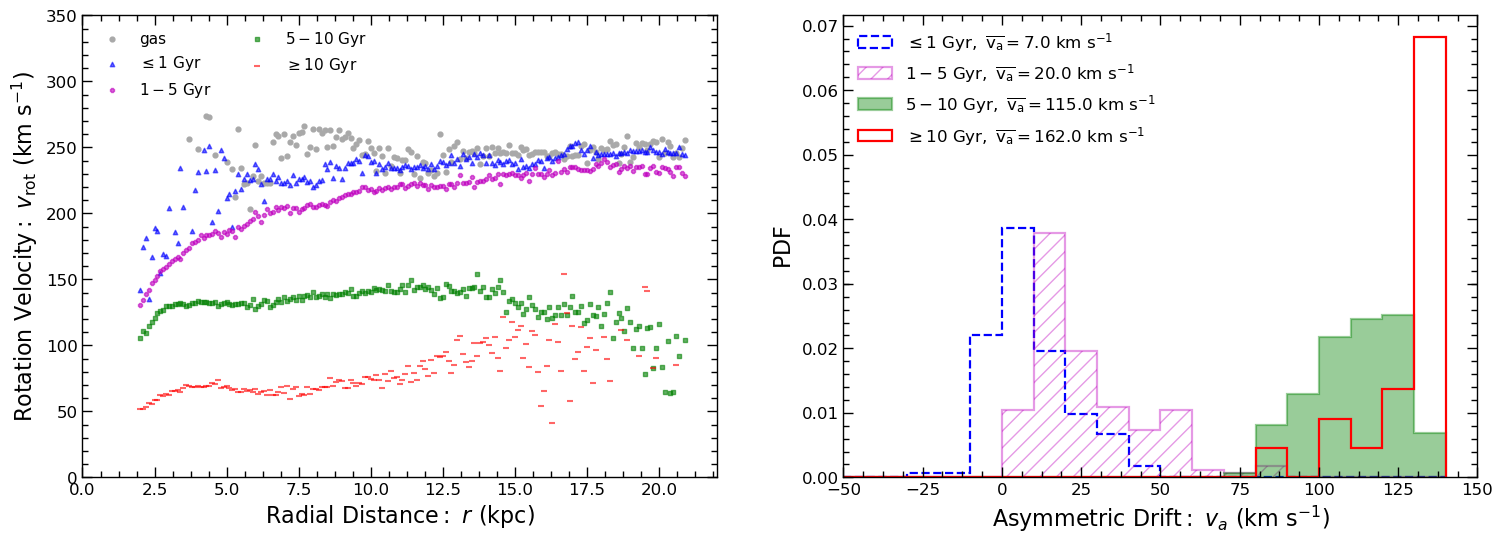
We calculate the AD at each radial bin for the four stellar age groups individually. Thus at each radial bin, we have an AD measurement for Group 1, 2, 3, and 4 with respect to the same neutral gas cell rotation velocities. An example of the results of the AD calculations from the corresponding rotation curve are presented in Figure 6. The left panel shows the rotation curve for this analog: the neutral gas is represented by the grey points, the blue triangles represent stars with ages Gyr, the purple points represent stars between Gyr, the green squares represent stars between Gyr, and the red dashes represent the stars Gyr. The right panel shows histograms of the AD for the four stellar age groups for the example analog 449972. The blue histogram represents stars that are Gyr, the purple hatch marks represents stars between Gyr, the green solid histogram represents stars between Gyr, and the red histogram represents the stars Gyr. In all following figures of AD, the histograms will follow the same style and color pattern for each stellar age bin. The trend of AD increasing as a function of stellar age is clearly visible in this example. In the next section, we describe trends with AD for the primary sample of analogs.
4 Results
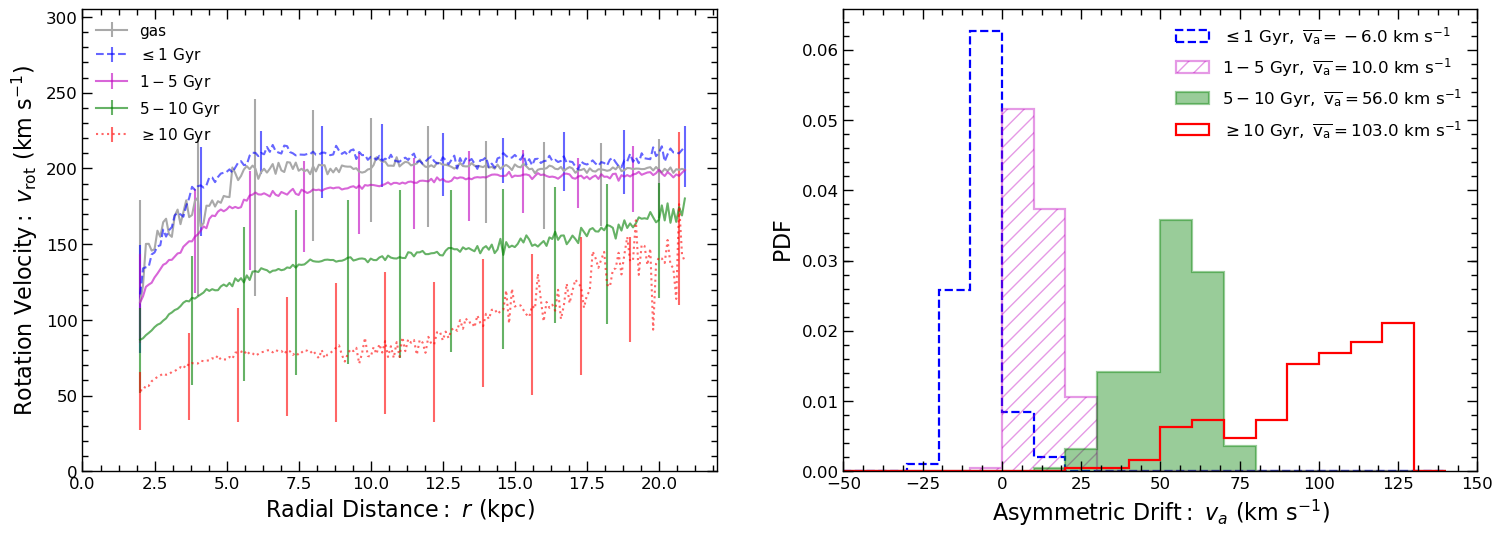
To calculate the cumulative rotation curves and AD values as a function of stellar age for the whole primary sample, we first calculate both the rotation curve and AD for each individual analog as described in the previous section (see Figure 6). Since the rotation curves are radially binned, the cumulative rotation curve for the whole primary sample is constructed by taking the median rotation velocity for each age group along every radial bin. To compare the AD values across all of the analogs, we find the median of AD for each of the four stellar age bins for every analog. Thus, for our primary sample, we have 93 median AD values for each of the four age bins. We show the distribution of these median AD measurements along with the cumulative rotation curves across the primary sample of analogs in Figure 7. We find there is a progression to higher AD as stellar age increases. This trend and the amplitude of median AD values are aligned with expectations from theory and with the observational study of AD as a function of stellar age in M31 (Q19). The peak and the width of the distributions ( percentile) for each age bin are listed in Table 2. Q19 find that stars that lag the gas in M31 tend to do so by (Q19), while in the MW stars lagged behind the gas by (Bovy et al., 2009; Bovy et al., 2012). The AD in the MW is similar to that in other local galaxies (e.g. Ciardullo et al., 2004; Herrmann & Ciardullo, 2009; Westfall et al., 2007; Westfall et al., 2011). These observations probed stars that were younger than Group 4 in this analysis.
| Stellar Age Group | Median AD ( km s-1) |
|---|---|
| Group 1: Gyr | |
| Group 2: Gyr | |
| Group 3: Gyr | |
| Group 4: Gyr |
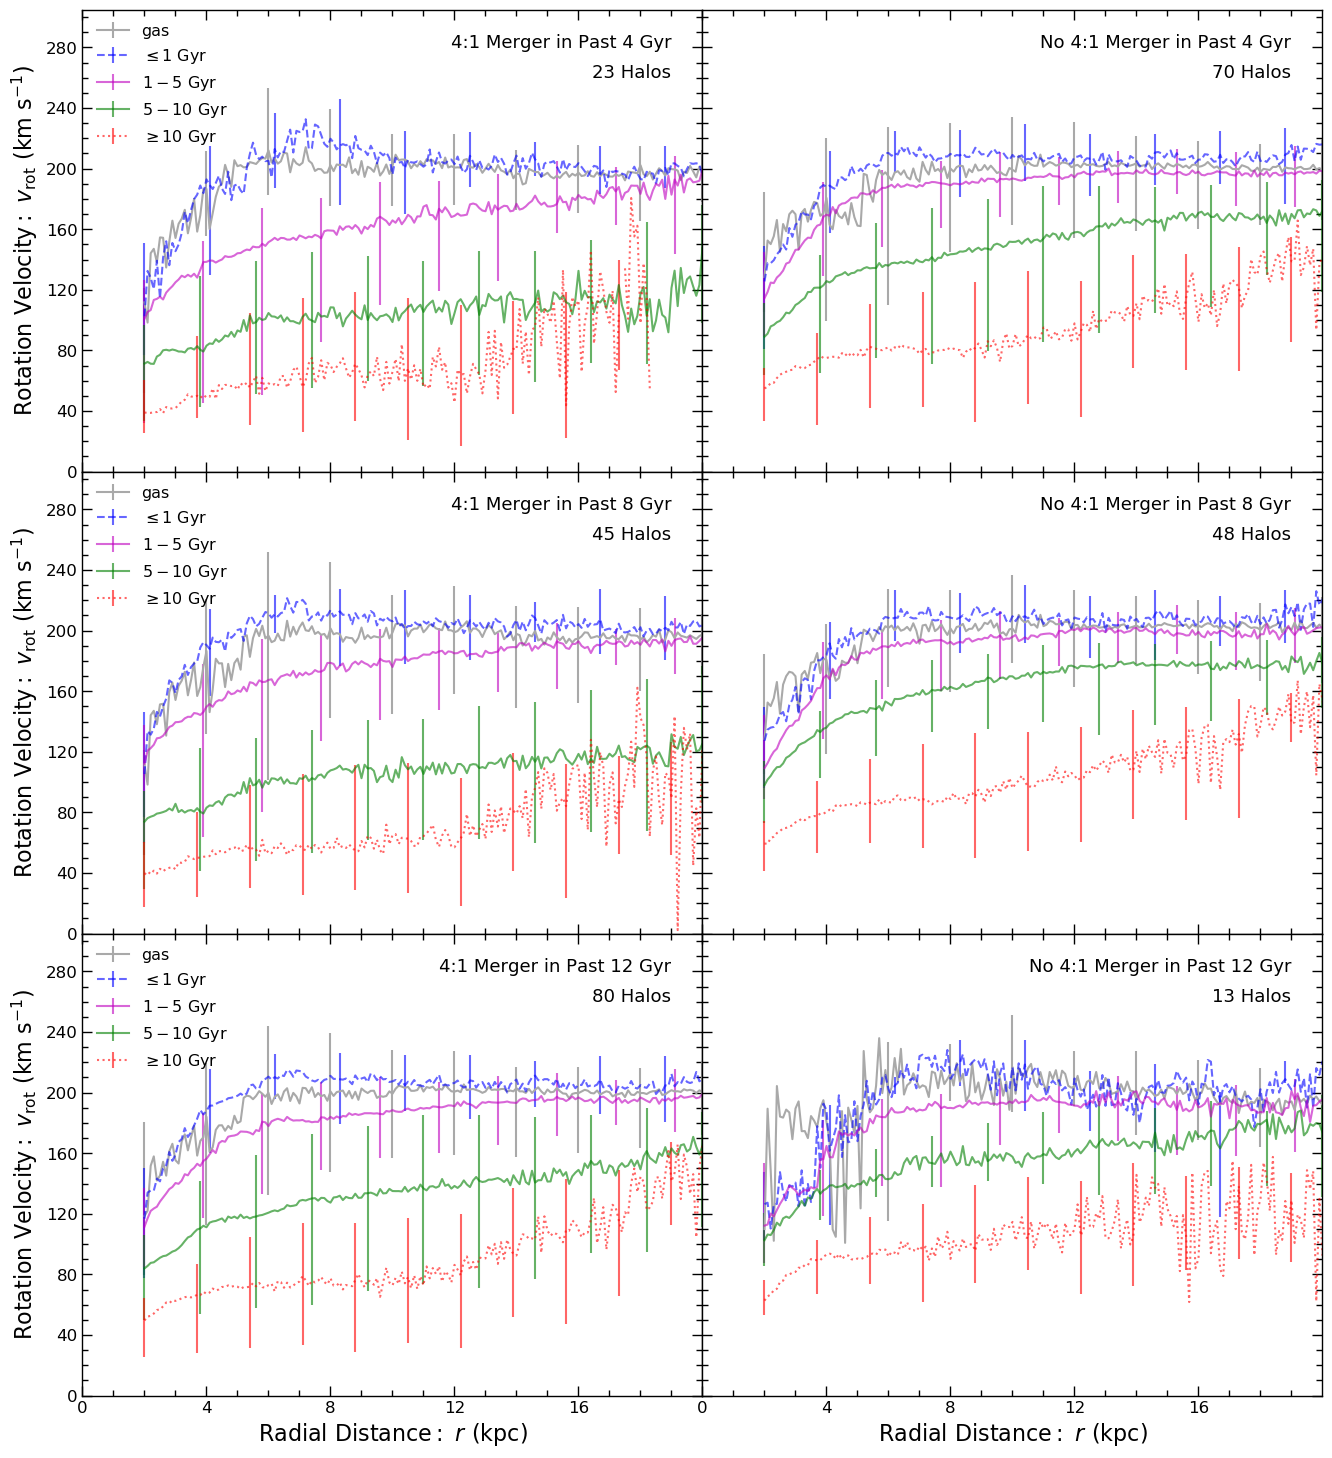
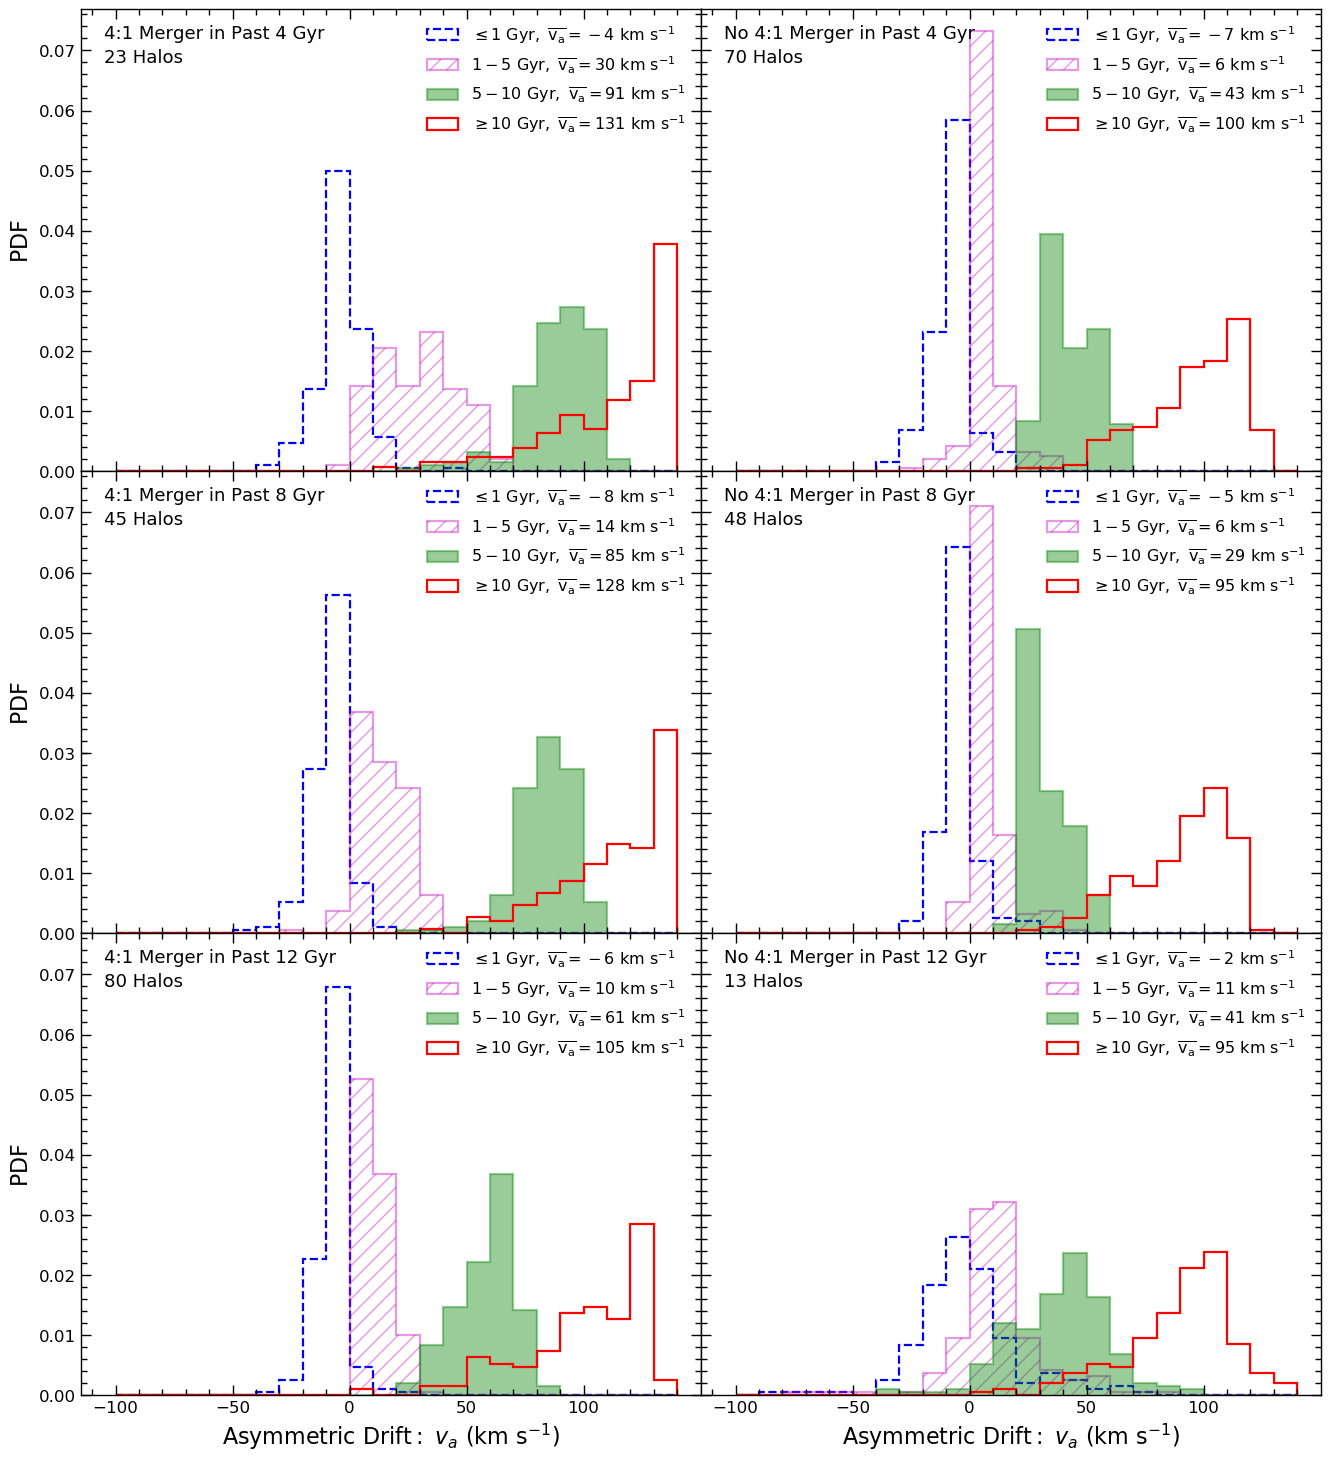
Since we aim to understand the possible correlation between AD and merger histories in this work, we use the properties included in the stellar assembly catalogues described in Section 2.3 to divide our primary sample into two subgroups: analogs that have experienced a 4:1 merger since a given time and those that have not experienced a merger more recent than the given time. We vary the time frame of interest from the past 4 Gyr, to the past 8 Gyr (approximately the median time of last 4:1 merger across the analogs), and to the past 12 Gyr. We create rotation curves (Figure 11) and histograms of the median AD (Figure 8) for the subgroups for each of the specified time frames. The median AD values are listed in Table 3.
In the majority of cases for all time frames, AD is higher in the group that experienced the 4:1 merger than it is in the group that did not have a 4:1 merger more recent than the specified time frame (the “no 4:1 merger group”). magentaThe exception is for Group 1 in the 4 Gyr time frame, where the magnitude of AD is slightly higher for the no 4:1 merger group and Group 2 in the 12 Gyr time frame, where AD is roughly equal for the two subgroups. For all time frames, the largest difference between the two subgroups is in Group 3. These are stars with ages Gyr. Brook et al. (2004) show that the epoch in which a star is born can shape its kinematics. For example, they find stars born during a period of rapid hierarchical growth, roughly 8.5 to 10.5 Gyr ago, have the kinematical characteristics of thick disk stars, whereas those born in a quiescent epoch have characteristics that resemble the thin disk. Overall, the total difference in AD between the two subgroups decreases as the time since the last 4:1 merger increases, suggesting that some effects from ancient mergers settle over time.
In all cases, AD also increases with stellar age despite the time of last 4:1 merger. This is particularly interesting when looking at analogs that have not had a 4:1 merger in the past 12 Gyr. For these simulated galaxies, AD must be influenced by other dynamical heating sources, including internal sources of dynamical heating, such as GMCs, galactic bars, and spiral arms magenta or by other external events such as minor mergers and other tidal encounters. Another possible explanation is that stars were born in hotter and less rotationally-supported disks in the past or that the older stars were accreted. In the next section, we will discuss these implications further.
| Time Since Last | Stellar Age Group | Median AD | Median AD |
|---|---|---|---|
| 4:1 Merger | [ km s-1] | [ km s-1] | |
| (4:1 Merger) | (No 4:1 Merger) | ||
| 4 Gyr | Group 1 | ||
| Group 2 | |||
| Group 3 | |||
| Group 4 | |||
| 8 Gyr | Group 1 | ||
| Group 2 | |||
| Group 3 | |||
| Group 4 | |||
| 12 Gyr | Group 1 | ||
| Group 2 | |||
| Group 3 | |||
| Group 4 |
5 Discussion
5.1 Comparisons to Measurements of Asymmetric Drift in Andromeda (Q19)
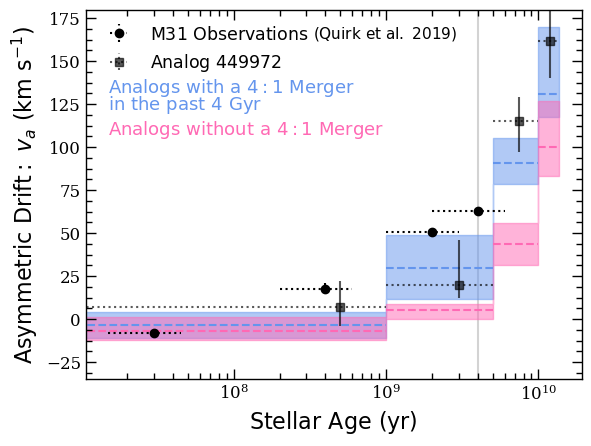
We further examine the AD of analogs that have had a 4:1 merger in the past 4 Gyr and those that have not (top panels in Figures 8 and 11), since recent studies suggest that M31 might have had a major merger in the past several billion years. Figure 9 shows the comparison of AD in the simulated analogs to the AD measured in M31 as in Q19. The blue shaded regions represent AD for the analogs that have experienced a 4:1 merger in the past 4 Gyr, and the pink represents the AD for analogs that have not. The vertical line marks 4 Gyr. Stars to the right of this line existed during the merger event, while stars to the left might have been born during or after the merger.
The smallest difference in AD between the subgroups is in Group 1. These stars would have been born after the merger event. The largest difference is in Group 3. These stars would have formed Gyr before the merger. In all cases, AD is higher for the group of analogs that experienced a merger since a given time, showing that recent 4:1 mergers can perturb stars even in the inner 20 kpc of a galaxy.
The black circular points in this figure show the observations of AD from (Q19). Each point represents an average stellar age for a broad stellar evolution classification: massive main sequence (MS), intermediate mass asymptotic branch (AGB), older AGB, and less massive red giant branch (RGB). To emphasize that each point represents a range of stellar age, we have arbitrarily added dotted horizontal bars on each point to show +/- 50% of the mean age. The star formation history of M31 is known more precisely than is represented here (Lewis et al., 2015; Williams et al., 2017), but we use broader age bins as to match the analysis in Q19 and allow for easy comparison. The observational AD measurements from M31 are most similar to the blue shaded region, suggesting that the observed AD trends in M31 could be consistent with a 4:1 merger in the past 4 Gyr. We posit that internal heating could be an explanation for why the observed AD measurements are greater than the median values across the analog sample (see Section 5.2). Furthermore, the observational M31 AD measurements are more similar to this analog subgroup than AD measured in analogs with more ancient mergers (the middle and bottom panels of Figure 8.) This is a potential piece of evidence that M31 did in fact have a recent major merger and suggests that the GSS could indeed have been formed by a major merger event that also led to prominent features that have been observed in M31’s halo such as the various stellar streams, shelves, and tidal features mentioned in Hammer et al. (2018); D’Souza & Bell (2018).
For comparison, we also plot the median AD values for the example analog 449972 in black square points. The properties of this analog are shown in Table 1 and Figures 5 and 6. This analog last had a 4:1 merger 4.12 Gyr ago, but its AD is much higher for the oldest stellar age groups than the overall primary sample. Since this analog has one of the highest and values in our sample, it may provide the best insight on the kinematics of the old stars in M31 relative to the younger stellar populations.
5.2 Assessing the Influence of Minor Mergers and Other Effects on AD
The AD observed in M31 naturally includes minor mergers, other tidal fly-bys, and sources of internal heating. The resolution of IllustrisTNG-100 does not allow us to probe how AD is affected by internal sources, like scattering via GMCs and spiral arms, as many internal heating sources rely on a thin disk. However, we can assess whether minor mergers play a significant role in the magnitude of AD and in the increasing AD as a function of stellar age using the primary sample.
To check whether minor mergers can also influence AD, we find five analogs in the primary sample with no 4:1 merger in the past 13.1 Gyr and analyze their dynamics based on the number of 10:1 mergers they have experienced. These five halos are split into a subgroup containing the halos that have experienced five to six 10:1 mergers and those that have only experienced zero or one 10:1 merger. AD increases with stellar age for all five halos. The AD for stellar age Groups 1, 2, and 3 is independent of the number of 10:1 mergers. The AD for the oldest stars (Group 4) is higher () in the analogs with the most 10:1 mergers but is still significantly below that of the AD for the primary sample, indicating that 4:1 mergers play a much larger role in influencing AD than 10:1 mergers. Furthermore, this suggests that minor mergers cannot explain why AD increases with stellar age (see also Section 4, Figure 8) but rather that this pattern is likely a signature of any of the following processes: physical sources of internal heating, older stars being born with hotter birth kinematics, or from older stars born ex-situ. AD can be as high as for stellar age Group 4 even for analogs with zero or one 10:1 merger and no 4:1 mergers.Understanding the specifics of internal heating events versus artificial noise and their separate contributions to AD requires further work with a set of higher resolution simulations and is beyond the scope of this analysis.
6 Summary and Conclusions
We have analyzed the AD of M31 mass analogs in the IllustrisTNG simulation to look for trends with stellar age. For the 93 analogs in our primary sample, we also examined merger histories to look for any correlations with AD. Our main conclusions are summarized below:
-
1. We find that AD for M31 mass analogs in the IllustrisTNG simulation increases with stellar age, as in the observations in (Q19). Our stellar age bins are defined as Group 1: Gyr, Group 2: 1-5 Gyr, Group 3: 5-10 Gyr, and Group 4: Gyr. Each stellar age bin is compared to the properties of neutral gas, defined as gas cells with neutral hydrogen fractions > 0.6.
-
2. The M31 mass analogs are selected independently from their merger histories. Upon examining their merger trees, we find that major mergers do affect the value of AD. However, they are not the sole agent giving rise to observed trends in AD as we find that AD increases as a function of stellar age even without a major merger event. Thus, AD is also influenced by internal dynamical heating, minor mergers and birth kinematics. Understanding the specific internal processes by which AD is affected requires a suite of higher resolution zoom-in simulations such as Auriga or IllustrisTNG50.
-
3. We divide the primary sample into two subgroups based on the analogs that have experienced a 4:1 merger since a given time (i.e, in the last 4 Gyr, 8 Gyr, and 12 Gyr) and those that have not experienced a merger more recent than the given time to determine how strongly AD is affected by the most recent major merger. On average, analogs that have experienced a merger have higher AD (up to a difference) than those analogs that have not experienced a merger in the time frame of interest. The effect is greatest for stars in Group 3: those with age Gyr, regardless of time since the last 4:1 merger.
-
4. The AD measurements observed in the disk of M31 from Q19 are similar to the subgroup of the primary sample that experienced a 4:1 merger within the past 4 Gyr. This is a piece of evidence that M31 may have experienced a major merger event in the past several billion years.
Acknowledgements
ACNQ is supported by National Science Foundation through the Graduate Research Fellowship Program funded by Grant Award No. DGE-1842400. EP was supported by the National Science Foundation through the Graduate Research Fellowship Program funded by Grant Award No. DGE-1746060 and is currently supported by the Miller Institute for Basic Research, University of California Berkeley. The authors would like to thank Julianne Dalcanton for bringing them together during the PHAT team meeting at Ringberg Castle in 2018 for without it, this project may not have emerged. The authors would also like to thank Greg Snyder for the insightful and supportive conversations in the initial stages of this project and Kathryn Johnston and Puragra Guhathakurta for the helpful discussions and comments. Thank you to Vicente Rodriguez-Gomez for analyzing the assembly history of IllustrisTNG galaxies and for making the stellar assembly catalogs available for this project. The authors would like to thank the anonymous referees for their feedback which has greatly improved the quality of this project. The authors acknowledge the significance and importance of the summit of Mauna Kea to the indigenous Hawaiian community and appreciate the opportunity to use data collected from this sight for this analysis.
Software: This research made use of astropy (Astropy
Collaboration et al., 2013, 2018), Illustris Python (Nelson
et al., 2015), matplotlib (Hunter, 2007), numpy (van der
Walt et al., 2011), and scipy (Virtanen
et al., 2020).
Data Availability Statement: The data used in this article is from the IllustrisTNG project and is available upon request at https://www.tng-project.org/data/.
References
- Abadi et al. (2003) Abadi M. G., Navarro J. F., Steinmetz M., Eke V. R., 2003, The Astrophysical Journal, 597, 21
- Astropy Collaboration et al. (2013) Astropy Collaboration et al., 2013, Astronomy & Astrophysics, 558, A33
- Astropy Collaboration et al. (2018) Astropy Collaboration et al., 2018, The Astrophysical Journal, 156, 123
- Bell et al. (2017) Bell E. F., Monachesi A., Harmsen B., De Jong R. S., Bailin J., Radburn-Smith D. J., D’souza R., Holwerda B. W., 2017, Technical report, GALAXIES GROW THEIR BULGES AND BLACK HOLES IN DIVERSE WAYS, http://vo.aip.de/ghosts/. http://vo.aip.de/ghosts/
- Bhattacharya et al. (2019) Bhattacharya S., et al., 2019, Astronomy & Astrophysics, 631, A56
- Bovy et al. (2009) Bovy J., Hogg D. W., Rix H.-W., 2009, The Astrophysical Journal, 704, 1704
- Bovy et al. (2012) Bovy J., et al., 2012, The Astrophysical Journal, 759, 131
- Brook et al. (2004) Brook C. B., Kawata D., Gibson B. K., Freeman K. C., 2004, The Astrophysical Journal, 612, 894
- Bryan & Norman (1998) Bryan G. L., Norman M. L., 1998, The Astrophysical Journal, 495, 80
- Budanova et al. (2017) Budanova N. O., Korchagin V. I., Gozha M. L., 2017, Astronomy Reports, 61, 915
- Chemin et al. (2009) Chemin L., Carignan C., Foster T., 2009, The Astrophysical Journal, 705, 1395
- Ciardullo et al. (2004) Ciardullo R., Durrell P. R., Laychak M. B., Herrmann K. A., Moody K., Jacoby G. H., Feldmeier J. J., 2004, The Astrophysical Journal, 614, 167
- Corbelli et al. (2010) Corbelli E., Lorenzoni S., Walterbos R., Braun R., Thilker D., 2010, Astronomy & Astrophysics, 511, A89
- Courteau et al. (2011) Courteau S., Widrow L. M., McDonald M., Guhathakurta P., Gilbert K. M., Zhu Y., Beaton R. L., Majewski S. R., 2011, The Astrophysical Journal, 739, 20
- D’Souza & Bell (2018) D’Souza R., Bell E. F., 2018, Nature Astronomy, 2, 737
- Dalcanton & Stilp (2010) Dalcanton J. J., Stilp A. M., 2010, The Astrophysical Journal, 721, 547
- Dalcanton et al. (2012) Dalcanton J. J., et al., 2012, The Astrophysical Journal Supplement Series, 200, 18
- Dehnen & Binney (1998) Dehnen W., Binney J. J., 1998, Monthly Notices of the Royal Astronomical Society, 298, 387
- Dolag et al. (2009) Dolag K., Borgani S., Murante G., Springel V., 2009, Monthly Notices of the Royal Astronomical Society, 399, 497
- Dorman et al. (2013) Dorman C. E., et al., 2013, The Astrophysical Journal, 779, 103
- Dorman et al. (2015) Dorman C. E., et al., 2015, The Astrophysical Journal, 803, 24
- El-Badry et al. (2016) El-Badry K., Wetzel A., Geha M., Hopkins P. F., Kereš D., Chan T. K., Faucher-Giguère C.-A., 2016, The Astrophysical Journal, 820, 131
- Escala et al. (2019) Escala I., Kirby E. N., Gilbert K. M., Cunningham E. C., Wojno J., 2019, The Astrophysical Journal, 878, 42
- Fardal et al. (2008) Fardal M. A., Babul A., Guhathakurta P., Gilbert K. M., Dodge C., 2008, The Astrophysical Journal, 682, L33
- Ferguson & Mackey (2016) Ferguson A. M. N., Mackey A. D., 2016, in Newberg H., Carlin J., eds, , Tidal Streams in the Local Group and Beyond. Springer Link, p. 191, doi:10.1007/978-3-319-19336-6_8
- Ferguson et al. (2002) Ferguson A. M. N., Irwin M. J., Ibata R. A., Tanvir N. R., Lewis G. F., Tanvir N. R., 2002, The Astronomical Journal, 124, 1452
- Golubov (2014) Golubov O., 2014, Odessa Astronomical, 27
- Hammer et al. (2018) Hammer F., Yang Y. B., Wang J. L., Ibata R., Flores H., Puech M., 2018, Monthly Notices of the Royal Astronomical Society, 475, 2754
- Hernquist & Quinn (1988) Hernquist L., Quinn P. J., 1988, The Astrophysical Journal, 331, 682
- Hernquist & Quinn (1989) Hernquist L., Quinn P. J., 1989, The Astrophysical Journal, 342, 1
- Herrmann & Ciardullo (2009) Herrmann K. A., Ciardullo R., 2009, Astrophysical Journal, 705, 1686
- Hinshaw et al. (2013) Hinshaw G., et al., 2013, The Astrophysical Journal Supplement, 208, 19
- Holmberg et al. (2009) Holmberg J., Nordström B., Anderson J., 2009, Astronomy & Astrophysics, 501, 7
- Huang et al. (2016) Huang Y., et al., 2016, Monthly Notices of the Royal Astronomical Society, 463, 2623
- Hunter (2007) Hunter J. D., 2007, Computing in Science & Engineering, 9, 90
- Ibata et al. (2001) Ibata R., Irwin M., Lewis G., Ferguson A. M., Tanvir N., 2001, Nature, 412, 49
- Ibata et al. (2005) Ibata R., Chapman S., Ferguson A. M. N., Lewis G., Irwin M., Tanvir N., 2005, Astrophysical Journal, 634, 287
- Ibata et al. (2007) Ibata R., Martin N. F., Irwin M., Chapman S., Ferguson A. M. N., Lewis G. F., McConnachie A. W., 2007, The Astrophysical Journal, 671, 1591
- Ibata et al. (2013) Ibata R. A., et al., 2013, The Astrophysical Journal, 780, 128
- Jenkins & Binney (1990) Jenkins A., Binney J., 1990, Monthly Notices of the Royal Astronomical Society, 245, 13
- Kormendy et al. (2013) Kormendy J., Falcón-Barroso J., Knapen J. H., 2013, Secular Evolution in Disk Galaxies, XXIII Canary Islands Winter School of Astrophysics. Cambridge University Press
- Leaman et al. (2017) Leaman R., et al., 2017, Monthly Notices of the Royal Astronomical Society, 472, 1879
- Lewis et al. (2015) Lewis A. R., et al., 2015, The Astrophysical Journal, 805, 183
- Mackey et al. (2019) Mackey D., et al., 2019, Nature, 574, 69
- Marinacci et al. (2018) Marinacci F., et al., 2018, Monthly Notices of the Royal Astronomical Society, 480, 5113
- McConnachie et al. (2005) McConnachie A. W., Irwin M. J., Ferguson A. M., Ibata R. A., Lewis G. F., Tanvir N., 2005, Monthly Notices of the Royal Astronomical Society, 356, 979
- McConnachie et al. (2018) McConnachie A. W., et al., 2018, The Astrophysical Journal, 868, 55
- Naiman et al. (2018) Naiman J. P., et al., 2018, Monthly Notices of the Royal Astronomical Society, 477, 1206
- Nelson et al. (2015) Nelson D., et al., 2015, Astronomy and Computing, 13, 12
- Nelson et al. (2018) Nelson D., et al., 2018, Monthly Notices of the Royal Astronomical Society, 475, 624
- Patel et al. (2017) Patel E., Besla G., Mandel K., 2017, Monthly Notices of the Royal Astronomical Society, 468, 3428
- Pillepich et al. (2018) Pillepich A., et al., 2018, Monthly Notices of the Royal Astronomical Society, 475, 648
- Planck Collaboration et al. (2016) Planck Collaboration et al., 2016, Astronomy & Astrophysics, 594, A13
- Purcell et al. (2010) Purcell C. W., Bullock J. S., Kazantzidis S., 2010, Monthly Notices of the Royal Astronomical Society, 404, 1711
- Quinn & Goodman (1986) Quinn P. J., Goodman J., 1986, The Astrophysical Journal, 309, 472
- Quirk et al. (2019) Quirk A., Guhathakurta P., Chemin L., Dorman C. E., Gilbert K. M., Seth A. C., Williams B. F., Dalcanton J. J., 2019, The Astrophysical Journal, 871, 11
- Rodriguez-Gomez (2016) Rodriguez-Gomez V., 2016, PhD thesis, Harvard University
- Rodriguez-Gomez et al. (2015) Rodriguez-Gomez V., et al., 2015, Monthly Notices of the Royal Astronomical Society, 449, 49
- Rodriguez-Gomez et al. (2016) Rodriguez-Gomez V., et al., 2016, Monthly Notices of the Royal Astronomical Society, 458, 2371
- Rodriguez-Gomez et al. (2019) Rodriguez-Gomez V., et al., 2019, Monthly Notices of the Royal Astronomical Society, 483, 4140
- Saha & Elmegreen (2018) Saha K., Elmegreen B., 2018, The Astrophysical Journal, 858, 24
- Sellwood (2014) Sellwood J. A., 2014, Review of Modern Physics, 86, 1
- Sellwood & Binney (2002) Sellwood J. A., Binney J. J., 2002, Monthly Notices of the Royal Astronomical Society, 336, 785
- Sellwood & Moore (1998) Sellwood J. A., Moore E. M., 1998, The Astrophysical Journal, 510, 38
- Seth et al. (2005) Seth A. C., Dalcanton J. J., de Jong R. S., 2005, The Astronomical Journal, 130, 1574
- Sick et al. (2014) Sick J., Courteau S., Cuillandre J.-C., McDonald M., de Jong R., Tully R. B., 2014, The Astronomical Journal, 147, 109
- Springel (2010) Springel V., 2010, Monthly Notices of the Royal Astronomical Society, 401, 791
- Springel et al. (2001) Springel V., White S. D. M., Tormen G., Kauffmann G., 2001, Monthly Notices of the Royal Astronomical Society, 328, 726
- Springel et al. (2018) Springel V., et al., 2018, Monthly Notices of the Royal Astronomical Society, 475, 676
- Strömberg (1946) Strömberg G., 1946, The Astrophysical Journal, 104, 12
- Sysoliatina, K. et al. (2018) Sysoliatina, K. et al., 2018, Astronomy & Astrophysics, 614, A63
- Tamm et al. (2012) Tamm A., Tempel E., Tenjes P., Tihhonova O., Tuvikene T., 2012, Astronomy & Astrophysics, 546, A4
- Tanaka et al. (2009) Tanaka M., Chiba M., Komiyama Y., Guhathakurta P., Kalirai J. S., Iye M., 2009, The Astrophysical Journal, 708, 1168
- Terrazas et al. (2020) Terrazas B. A., et al., 2020, Monthly Notices of the Royal Astronomical Society, 493, 1888
- Ting & Rix (2019) Ting Y.-S., Rix H.-W., 2019, The Astrophysical Journal, 878, 21
- Torrey et al. (2015) Torrey P., et al., 2015, Monthly Notices of the Royal Astronomical Society, 447, 2753
- Virtanen et al. (2020) Virtanen P., et al., 2020, Nature Methods, 17, 261
- Vogelsberger et al. (2014) Vogelsberger M., et al., 2014, Monthly Notices of the Royal Astronomical Society, 444, 1518
- Walker et al. (1996) Walker I. R., Mihos J. C., Hernquist L., 1996, The Astrophysical Journal, 460, 121
- Weinberger et al. (2018a) Weinberger R., et al., 2018a, Monthly Notices of the Royal Astronomical Society, 479, 4056
- Weinberger et al. (2018b) Weinberger R., et al., 2018b, Monthly Notices of the Royal Astronomical Society, 479, 4056
- Westfall et al. (2007) Westfall K. B., Bershady M. A., Verheijen M. A., Andersen D. R., Swaters R. A., 2007, in Astrophysics and Space Science Proceedings. No. 202409. p. 157 (arXiv:0508552v1), doi:10.1007/978-1-4020-5573-7_27, https://arxiv.org/pdf/astro-ph/0508552.pdf
- Westfall et al. (2011) Westfall K. B., Bershady M. A., Verheijen M. A., Andersen D. R., Martinsson T. P., Swaters R. A., Schechtman-Rook A., 2011, The Astrophysical Journal, 742, 32
- Williams et al. (2014) Williams B. F., et al., 2014, The Astrophysical Journal Supplement, 215, 9
- Williams et al. (2017) Williams B. F., et al., 2017, The Astrophysical Journal, 846, 145
- van den Bergh et al. (2006) van den Bergh S., Livio . M., Brown T. M., 2006, The Local Group as an Astrophysical Laboratory: Proceedings of the Space Telescope Science Institute Symposium, held in Baltimore, Maryland May 5–8, 2003. Space Telescope Science Institute Symposium Series, Cambridge University Press, doi:10.1017/CBO9780511734908
- van der Walt et al. (2011) van der Walt S., Colbert S. C., Varoquaux G., 2011, Computing in Science & Engineering, 13, 22
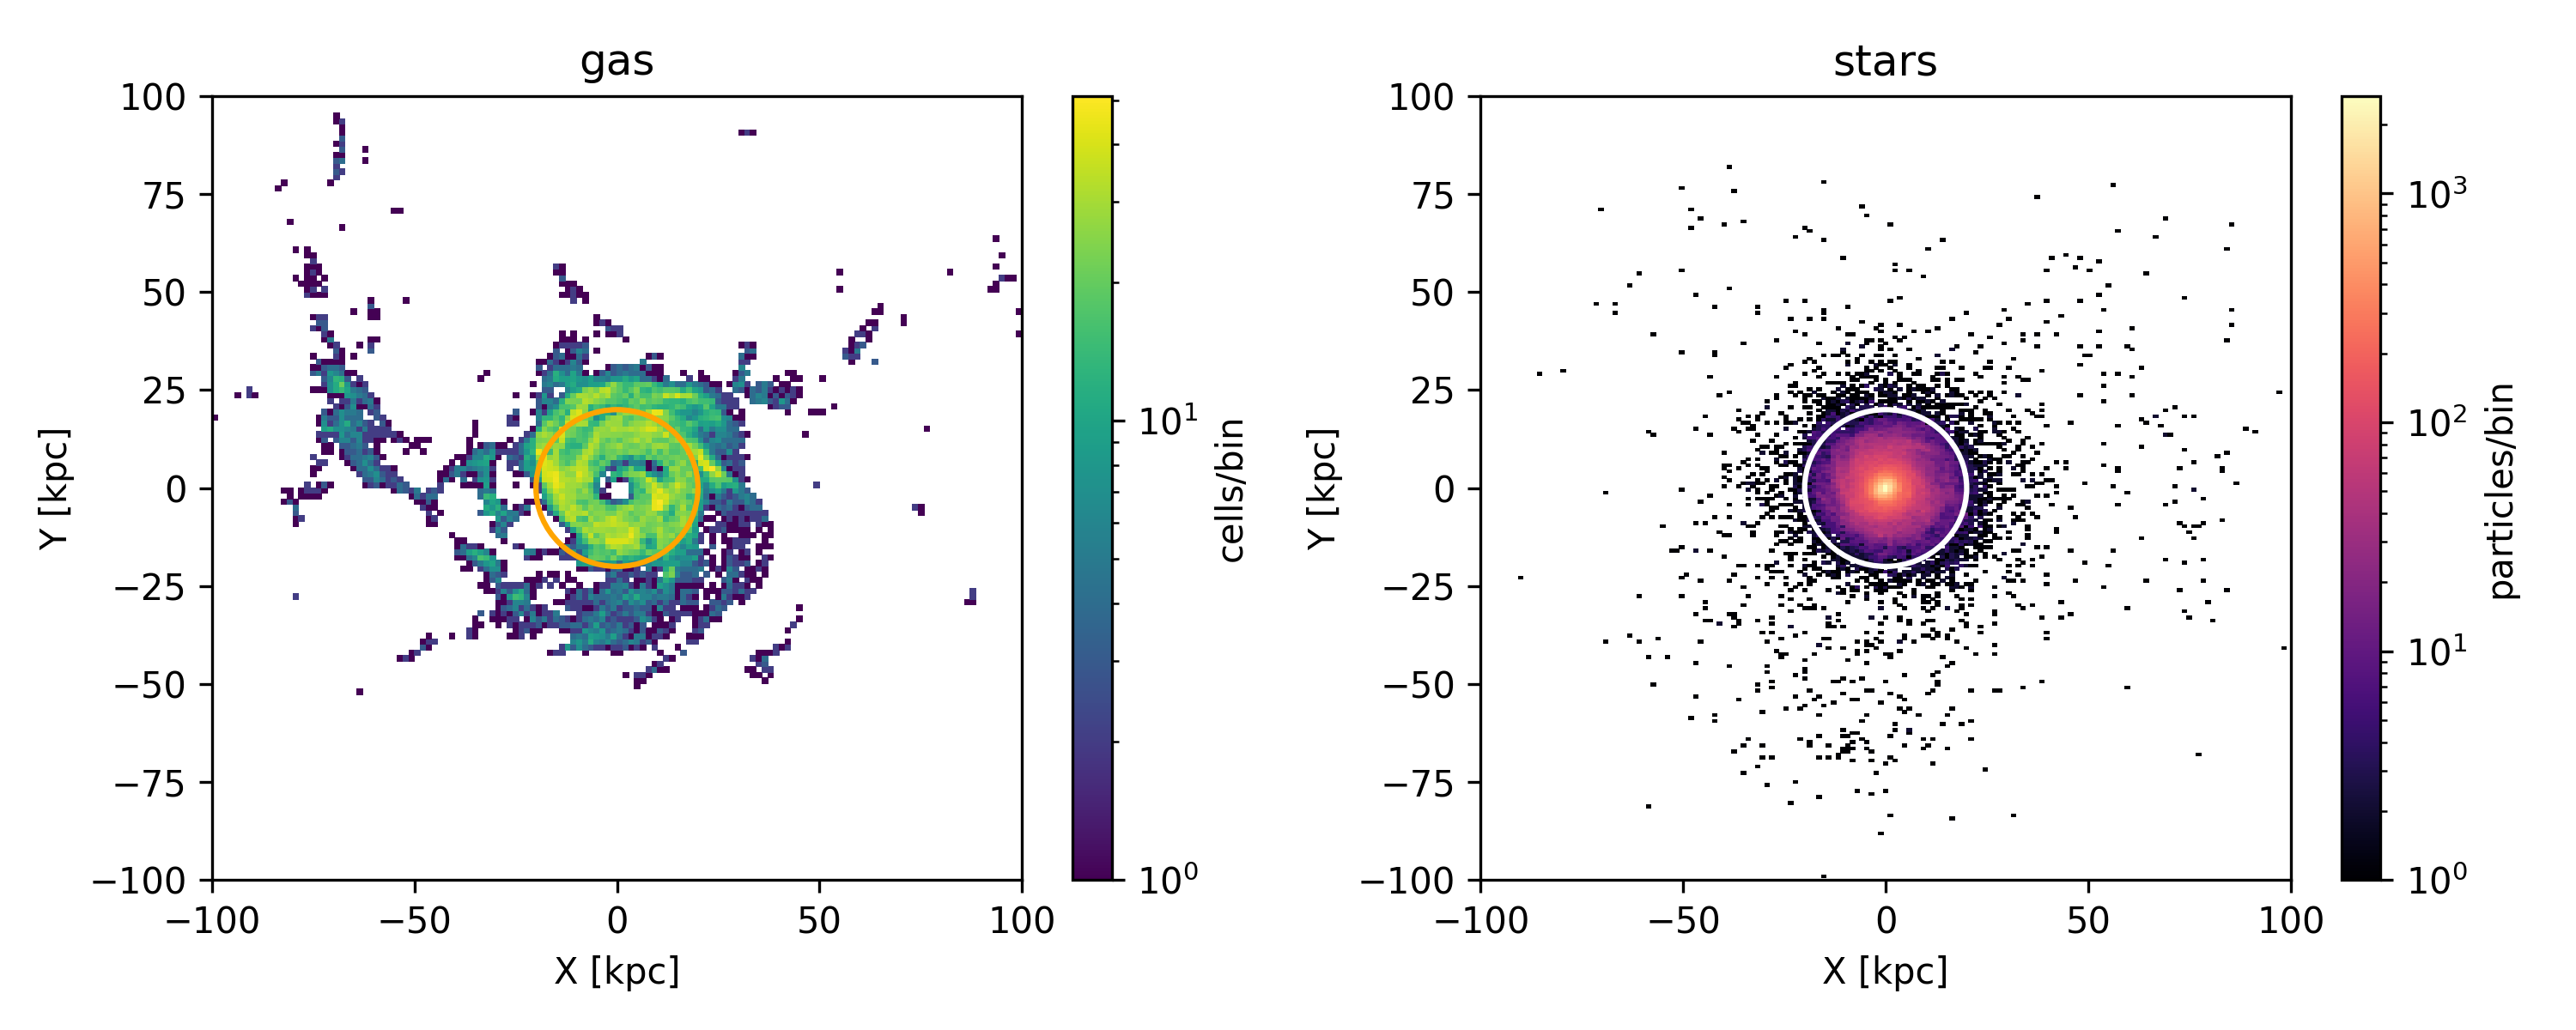
Appendix A Particle Density Plots for Example Analog 449972
Figure 10 shows a more detailed view of analog 449972’s geometry. The left panel shows the gas cell density in the inner 100 kpc of the simulated galaxy. The right panel shows the stellar particle density across the same extent. The orange and gray circles illustrates the 20 kpc region encompassing the data in the left and right panels, respectively. All rotation curves are calculated using particle/cell data within this 20 kpc region relative to the COM. For this M31 analog, 56% of gas cells with and 97% of stellar particles are encompassed by the 20 kpc radius, so the rotation curves used to calculate AD are representative of the most prominent inner regions of the M31 analogs with little contamination from non-spherical substructures.
Appendix B Primary Sample Rotation Curves
In this section, we show the rotation curves from the merger and no merger subgroups (Figure 11). These rotation curves are used to make the histograms of AD shown in Figure 8. The vertical gap between the stellar particle rotation curves and the gas data rotation curve is a visual representation of AD.