Onset of Cosmic Reionization: Evidence of An Ionized Bubble Merely 680 Myrs after the Big Bang
Abstract
While most of the inter-galactic medium (IGM) today is permeated by ionized hydrogen, it was largely filled with neutral hydrogen for the first 700 million years after the Big Bang. The process that ionized the IGM (cosmic reionization) is expected to be spatially inhomogeneous, with fainter galaxies playing a significant role. However, we still have only a few direct constraints on the reionization process. Here we report the first spectroscopic confirmation of two galaxies and very likely a third galaxy in a group (hereafter EGS77) at redshift , merely 680 Myrs after the Big Bang. The physical separation among the three members is 0.7 Mpc. We estimate the radius of ionized bubble of the brightest galaxy to be about 1.02 Mpc, and show that the individual ionized bubbles formed by all three galaxies likely overlap significantly, forming a large yet localized ionized region, which leads to the spatial inhomogeneity in the reionization process. It is striking that two of three galaxies in EGS77 are quite faint in the continuum, thanks to our selection of reionizing sources using their Lyman- line emission. Indeed, one is the faintest spectroscopically confirmed galaxy yet discovered at such high redshifts. Our observations provide direct constraints in the process of cosmic reionization, and allow us to investigate the properties of sources responsible for reionizing the universe.
1 Introduction
Cosmological simulations indicate that the process of reionization, which is expected to be patchy or spatially inhomogeneous (Furlanetto et al 2004, Iliev et al. 2006, Zahn et al. 2007, Mesinger A. et al. 2008, Jensen, H. et al 2014), started when intense UV radiation from individual galaxies or groups of galaxies first ionized their local surroundings, and formed local ionized bubbles. These ionized bubbles later grew to fill the entire IGM, marking the end of the reionization process.
Star-forming galaxies at high redshifts are expected to have contributed to the reionization process (e.g. Stiavelli et al., 2004; Bouwens et al., 2015). These same galaxies, via their Lyman- emission, provide a practical tool to study the reionization process the evolution of neutral hydrogen in the IGM. Currently however, we lack a clear observational evidence of the spatial inhomogeneity or the sources responsible for the cosmic reionization. Therefore, to study the nature of cosmic reionization, and quantify galaxies’ contribution to this process, we have carried out a unique narrow-band (NB) imaging survey, the Cosmic Deep And Wide Narrowband survey (DAWN; PI: Rhoads) to observe Lyman- emitting galaxies at high redshifts. The NB technique has been proven successful in identifying galaxies (Hu et al., 2010; Ouchi et al., 2010; Rhoads et al., 2012) which otherwise could go undetected in the traditional broad-band selection techniques (e.g. Steidel et al., 2003). Here we present discovery of the most distant galaxy group, identified using NB imaging, and confirmed via spectroscopic observations.
2 Imaging
2.1 Observations & Data Reduction
We obtained deep NB imaging observations of the Extended Groth Strip (EGS) field (RA 14:19:16 DEC +52:52:13), as part of the DAWN survey. This is a uniquely deep survey given its sensitivity as well as area coverage, with a primary objective of identifying galaxies at redshift . Here we present relevant details of the DAWN survey (Rhoads et al in prep, Coughlin et al 2018). The DAWN survey was carried out using a custom built narrow-band filter (FWHM=35Å, central wavelength= 10660Å), mounted on the NOAO Extremely Wide-Field InfraRed Imager (NEWFIRM)(Probst et al., 2004, 2008) at the Kitt Peak 4m Mayall telescope. The NEWFIRM instrument has a wide field of view (28x28 arcmin2) with a resolution of 0.4″ per pixel. We obtained individual images with 600s integration time and Fowler samples of 16 with 8 digital averages during the readout. To achieve clean sky background subtraction we used random dithering with a dither size of 45″.
The data reduction was primarily done using the NEWFIRM science data reduction pipeline (Swaters et al., 2009). However, for generating the final stack of all the images produced by the pipeline (sky subtracted, cosmic-rays cleaned, re-projected) we used our own scripts to remove bad frames that were visually inspected in order to maximize the signal-to-noise ratio of astronomical objects. The final NB stack is equivalent to a total integration time of 67 hrs, yielding line flux sensitivity of . In addition to the NB image described above, to select high-redshift Lyman- emission line candidates, we also used publicly available broadband images at visible wavelengths (HST/ACS F606W, F814W) and at near-IR wavelengths (HST/WFC3 F125W, F160W). The observations at visible wavelengths were taken as part of the GO10134 program (PI: M. Davis). Near-IR and IRAC observations were taken as part of the GO12063 program (PI: S. Faber), and GO61042 program (PI: G. Fazio), respectively.
2.2 Selection of Candidate Galaxies
To generate the source catalog we first aligned all images that include HST/ACS images (F606W, F814W), near-IR NB1066 image (NB from DAWN survey), and near-IR images (F125W, F160W) onto a common world coordinate system grid. We then used a source detection software (SExtractor; Bertin & Arnouts 1996) in dual image mode where the detection image (in this case the NB) is used to identify the pixels associated with each object, while the fluxes are measured from the respective photometry image.
For robust selection of candidate galaxies at we followed a set of criteria that has yielded a high spectroscopic success rate at = 4.5 and 5.7(Rhoads, & Malhotra, 2001; Rhoads et al., 2003; Dawson et al., 2004, 2007; Wang et al., 2009). Following this, each of our candidates had to satisfy all of the following criteria: 1) 5 detection in the NB filter, 2) 3 significant narrowband excess (compared to the F125W image), and 3) non-detection () in the individual optical images (F606W, F814W). Criteria 1 & 2 ensure real emission line sources while criterion 3 eliminates most low-redshift sources. Using this set of criteria we identified three candidates: , , and for spectroscopic follow-up. Formally, has a NB S/N 4 (just below our selection threshold), however it has an aggregate S/N=13 in NB+F125W+F160W. Given that it satisfied all other selection criteria, and given its proximity with other two galaxies, we included it for the spectroscopic follow-up observations. It should be noted that galaxy was independently identified previously by Oesch et al (2015) using Lyman-break selection technique.
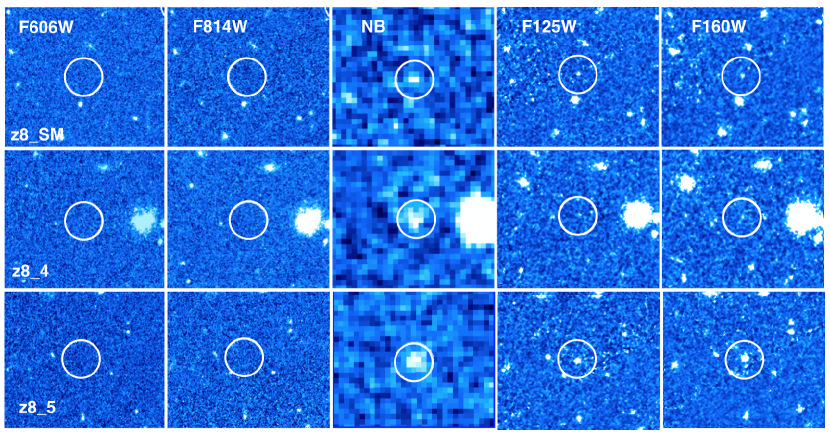
Figure 1 shows image cutouts of all three candidates in five filters. All three galaxies have significant fluxes in the NB filter, indicating the presence of strong emission lines, most likely Lyman- lines at the observed wavelength of . None of the galaxies have detectable fluxes at the visible wavelengths suggesting that these galaxies are consistent with being at redshifts . All three galaxies are detected in both F125W and F160W (see Table 1), despite two of them being faint, making the faintest galaxy discovered at such high redshifts, thanks to the NB selection technique in which detection of galaxies does not depend on the continuum brightness.
2.3 Photometric Redshifts And Spectral Energy Distributions
To measure the photometric redshifts, we made use of spectral energy distribution (SEDs) templates. We obtained the best-fit SEDs using (Brammer et al., 2008) which provides photometric redshift probability distribution by finding the best-fitting combination of redshifted galaxy spectral templates to the observed photometry. Because our galaxy sample is selected to have emission lines, to derive the best-fit SEDs and photometric redshifts, we chose a set of spectral templates that have emission lines (eazy_v1.3). These templates are corrected for the intergalactic absorption by neutral hydrogen, following the Madau prescription(Madau, 1995). We allowed a wide range of redshift grids ( to ) to search for the best-fit SED template. In addition to the photometry (discussed in Section 2.2), we also used HST/WFC3 F105W photometry (GO:13792, PI: Bouwens) for and CFHT-Y band photometry for and .
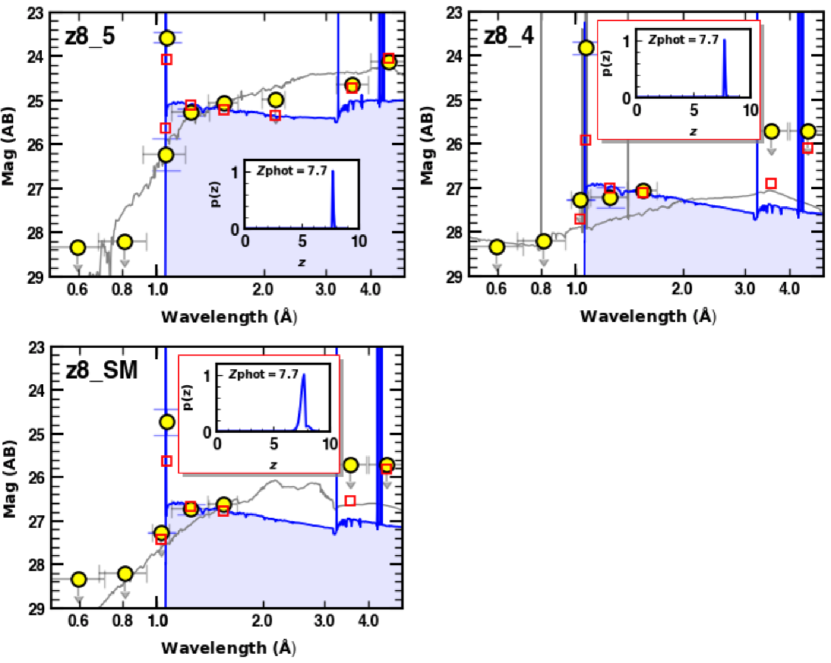
As shown in Figure 2, for all three galaxies the best-fit SEDs (shown in blue color) prefer spectral templates that correspond to a photometric redshift . This is also evident from the (shown in the inset); the presence of strong emission lines in the NB filter yield very tight constraints on the . For completeness, we also show the low-redshift galaxy templates (grey color), which however are disfavored due to much larger values of the SED fit. For the brightest galaxy (previously identified in Oesch et al 2015), the difference between best-fit value of low-redshift template and high-redshift template is 86. For the remaining galaxies , and while the difference between best-fit value of low-redshift template and high-redshift template is , it is not as high as for given their lower S/N. Furthermore, all three galaxies have large rest-frame Lyman- equivalent widths Å (see Table 1), which likely makes them visible as Lyman- emitting galaxies.
| ID | RA | DEC | F606W | F814W | NB | F125W | F160W |
|---|---|---|---|---|---|---|---|
| J2000 | J2000 | mag | mag | mag | mag | mag | |
| z8_SM | 14:20:35.694 | +53:00:09.318 | 28.31 | 28.21 | 24.760.35 | 26.760.13 | 26.660.11 |
| z8_4 | 14:20:35.169 | +52:59:40.613 | 28.31 | 28.21 | 23.850.15 | 27.250.21 | 27.100.16 |
| z8_5 | 14:20:34.872 | +53:00:15.242 | 28.31 | 28.21 | 23.600.12 | 25.290.03 | 25.080.03 |
| Spectroscopic measurements | |||||||
| ID | EWrest | LLyα | HII radii 2 | SNR | Distance3 | ||
| () | Å | () | pMpc | Trans LoS | |||
| z8_SM | 7.767 | 0.290.06 | 236 | 0.20.1 | 0.55 | 4.9 | 0.06 0.9 |
| z8_4 | 7.748 | 0.56 0.09 | 7118 | 0.4 0.1 | 0.69 | 6.0 | 0.09 0.2 |
| z8_5 | 7.728 | 1.7 0.14 | 373 | 1.2 0.1 | 1.02 | 12.1 | 0.08 -0.5 |
Note. — 1 magnitude limits. All magnitudes are AB magnitudes.
2HII bubble radii based on Fig 15 from Yajima et al 2018.
3Trans and LoS are the transverse and line-of-sight separation of each galaxy from the flux-weighted mean location of the group center, measured in pMpc.
3 Spectroscopic Observations
To confirm the photometric redshifts of these galaxies, we performed Y-band spectroscopy using Multi-Object Spectrometer for Infra-Red Exploration (MOSFIRE) spectrograph (McLean et al. 2012) on the Keck I telescope. The MOSFIRE instrument allows us to obtain spectroscopic observations of multiple objects simultaneously, with the Y-band covering Lyman- lines redshifted to . We targeted three Lyman- galaxy candidates in the EGS field, as our primary science targets, and used low-redshift emission line candidates as fillers. Observations were taken on May 06, 2017, with each individual exposures having 140 sec integration time and pattern dither offsets along the slit with offset of 1″ from the center. The spectroscopic conditions were good with a typical seeing of ″, and a total integration time of about 4 hrs per object.
We reduced data using the public MOSFIRE data reduction pipeline. It performs standard data reduction procedures including sky subtraction, rectification of the 2D spectra, and wavelength calibration. For a given object, it also produces corresponding signal-to-noise ratio (SNR) and a sigma image. The final 2D science spectra has a spatial resolution of 0.18″ per pixel and a dispersion of 1.086 Å per pixel. For absolute flux calibration of 1D spectra, we compared the measured line flux of with the calibrated flux from Oesch et al. (2015), and converted instrumental flux (in counts) to the absolute flux. The conversion factor derived for is then used to calibrate spectra of and .
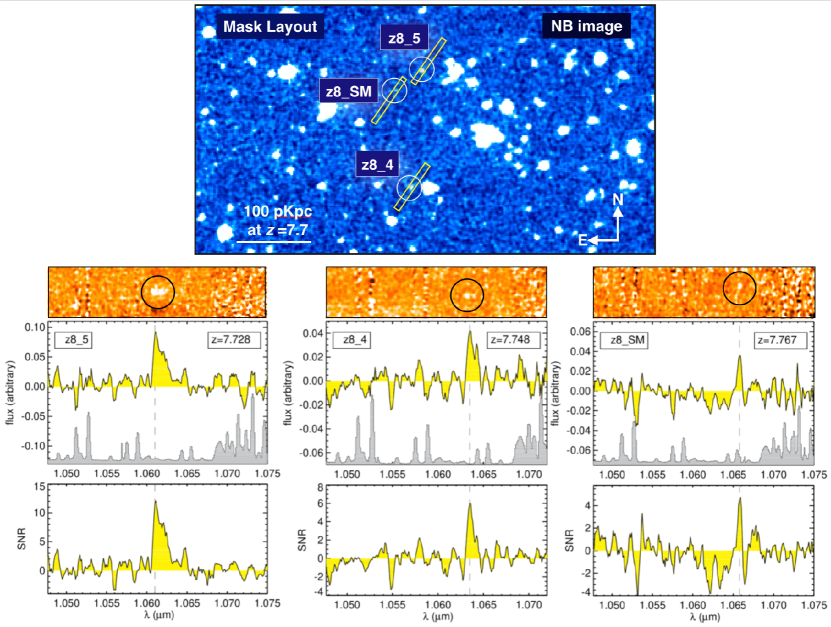
Figure 3 shows the final co-added two-dimensional (2D) and one-dimensional (1D) Y-band spectra of all three galaxies. As seen, both galaxies and show prominent emission lines(S/N 5) while has S/N=4.9. In the following we show that these are very likely Lyman- emission at .
For both galaxies and , emission lines are free from the night sky OH lines, as shown in shaded region (middle row). For , while its emission line is close to a faint night sky line, given its higher S/N compared to the night sky lines, it is very likely a genuine emission line. Furthermore, the observed Y-position of the emission line in the 2D spectrum of matches well with that expected based on the slit position in the mask (Fig 3 top panel), supporting our conclusion that this is a real emission line. We note that the presence of a faint night sky line at the position of the Lyman- line may possibly affect the Lyman- line flux measurements. However, given the faintness of the night sky line, we expect that it will have a minimal impact on the measurement of the Lyman- line flux. In the following we demonstrate that these are very likely Lyman- lines at .
One of the characteristics that distinguishes Lyman- emission from star-forming galaxies and other emission lines is the line asymmetry(Rhoads et al., 2003) or Skewness(Kashikawa et al., 2006). To quantify the Skewness in the line, we calculated the weighted skewness parameter , and found Å for . This confirms that is a galaxy because Å is not seen in low-redshift emission lines of [OII], [OIII], and H (Kashikawa et al., 2006). Indeed galaxy was previously identified as a Lyman break candidate (labelled as EGS-zs8-1), and spectroscopically confirmed as a galaxy(Oesch et al., 2015). Furthermore, recent H-band spectroscopic observations of this galaxy show presence of [CIII] 1909 doublet(Stark et al., 2017). Thus, given all the evidence, is unequivocally a Lyman- emitting galaxy at . For galaxy the weighted skewness parameter for the observed emission line is Å confirming the line to be Lyman- at . For , we can not reliably measure the asymmetry of the line given its lower S/N in the spectrum. However, based on the best-fit SEDs, both and favor high redshift solutions. Furthermore, if these were faint, low-redshift galaxies, the best-fit low redshift SEDs implies a clear detection in F606W and F814W filters. Thus, given all the evidence, and are unequivocally at redshifts and respectively, and is also very likely at redshift .
It is striking that while and are faint ( mag ), both show Lyman- emission lines. Moreover, despite low number density of such faint galaxies at , all three galaxies are spectroscopically confirmed. This high spectroscopic success rate is likely because (1) our NB technique preselects galaxies with detectably strong line emission, and (2) EGS77 is likely to have formed a large ionized bubble, allowing Lyman- photons to escape. We discuss this in more detail in the following section.
4 Visibility of Lyman-
The visibility of Lyman- emission from star-forming galaxies at high redshifts depends on several factors including star-formation rate, ionizing photon budget, galactic outflows, and the density of neutral hydrogen surrounding the galaxy. The star-formation rate and the ionizing photon budget will directly influence the amount of ionized gas forming an ionized bubble which in turn allows Lyman- photons to travel unattenuated along the line-of-sight(Malhotra, & Rhoads, 2006).
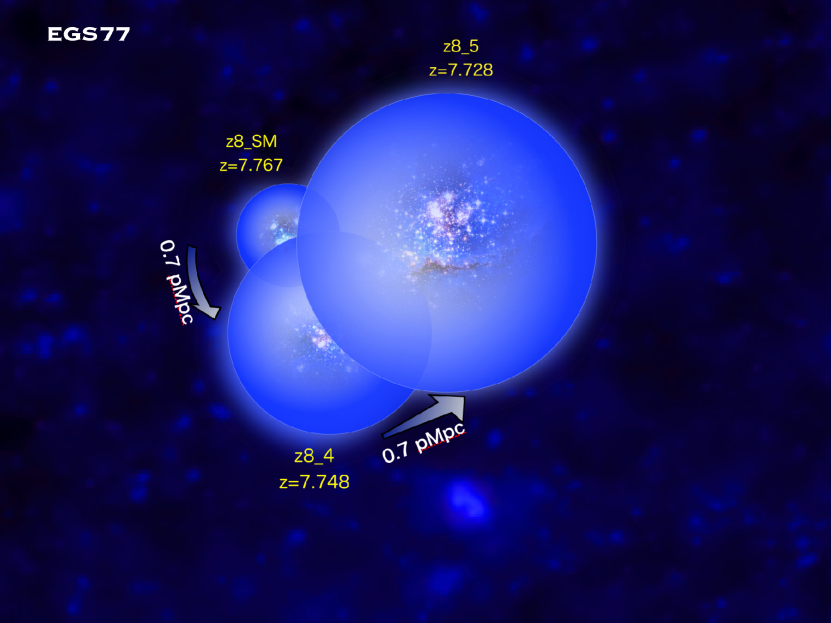
The separation between the most distant member () and () along the line-of-sight is about 0.7 pMpc (physical Mpc), which is same as the separation between and (). In the transverse direction (i.e. projection on the sky) all three members are much closer to each other. The separation between and in the transverse direction is 10″( pMpc), while the separation between and is 35″(0.18 pMpc). Thus, given the proximity of all three galaxies with each other in both the transverse direction and along the line-of-sight, these galaxies will form a continuous attenuation-free path for Lyman- photons if the radii of their ionized bubbles are 0.35 pMpc along the line-of-sight direction (Fig. 4). This is because the ionized region is large enough that the Lyman- photons are redshifted by the time they reach the neutral hydrogen boundary, and thus can escape. This is supported by recent spectroscopic observations of the brightest galaxy , showing a [CIII] 1909 doublet(Stark et al., 2017), which yields a velocity offset =340. When compared to a FWHM=360 for this line(Oesch et al., 2015), it implies that a substantial fraction of Lyman- photons are leaving the galaxy at 340- 520 .
4.1 Estimation of Bubble Sizes
We now estimate the sizes of ionized bubbles formed by these galaxies, based on theoretical model where the relation between Lyman- luminosities and bubble sizes has been predicted through simulations, while the star formation rates is derived using growth rate of halo mass with a constant tuning parameter (Yajima et al., 2018). The growth rate of halos is calculated using the halo merger trees based on an extended Press-Schechter formalism (Somerville, & Kolatt, 1999; Khochfar, & Burkert, 2001). These simulations reproduce the observed star formation rate density as well as the UV luminosity function of Lyman break selected galaxies at and (Bouwens et al., 2012). Next, to estimate the sizes of ionized bubble which is proportional to the ionizing photon budget, they use star formation history of each halo using stellar population synthesis code STARBURST99 (Leitherer et al., 1999). Finally, the Lyman- luminosity of each galaxy is calculated based on the number of ionizing photons absorbed within the galaxy. Photons that are absorbed will produce Lyman- photons while photons that escape cause the cosmic reionization. Based on these simulations (Figure 15 from Yajima et al 2018), the luminosity of our brightest galaxy yields a radius of 1.02 pMpc for the HII bubble. For the remaining two galaxies and we get the bubble sizes of 0.69 and 0.55 pMpc respectively (see Fig 4). This implies that the ionized bubbles produced by individual galaxies overlap significantly, forming a continuous non-attenuating path through which Lyman- photons can easily escape and hence be observed(Larson et al., 2018). This is currently the only observational evidence of an ionized bubble formed by a group of three galaxies (EGS77) during the onset of cosmic reionization. This localized ionized region leads to the expected spatial inhomogeneity in the reionzation process, and provides evidence of fainter galaxies’ contribution to this process.
5 summary
In this Letter we reported the discovery of the farthest galaxy group EGS77 at , merely 680 Myrs after the Big Bang. EGS77 was initially identified using NB imaging observations from the DAWN survey, and later confirmed via spectroscopic observations using MOSFIRE spectrograph on the Keck telescope. It is striking that all three galaxies in EGS77 are spectroscopically confirmed via Lyman- emission line () despite two of them being faint in the continuum. In fact EGS77 contains the faintest galaxy (in terms of the continuum brightness) discovered and spectroscopically confirmed at this redshift. Based on model and simulations from literature, we found that the ionized bubbles produced by all three galaxies overlap significantly, producing a large, yet localized ionized region giving rise to the expected inhomogeneity in the reionization process. Thus, this is the first observations of a galaxy group responsible for the cosmic reionization. The James Webb Space Telescope will be sensitive to the rest-frame UV continuum of such fainter galaxies in the reionization epoch, and therefore can provide a much larger sample of galaxies responsible for the re-ionization process. Furthermore, future 21cm observations from SKA-2(Dewdney et al., 2009) will be able to probe the ionized structures with angular size as large as ′, similar to the size of ionized bubble produced by at .
References
- Bertin, & Arnouts (1996) Bertin, E., & Arnouts, S. 1996, A&AS, 117, 393
- Brammer et al. (2008) Brammer, G. B., van Dokkum, P. G., & Coppi, P. 2008, ApJ, 686, 1503
- Bouwens et al. (2012) Bouwens, R. J., Illingworth, G. D., Oesch, P. A., et al. 2012, ApJ, 754, 83
- Bouwens et al. (2015) Bouwens, R. J., Illingworth, G. D., Oesch, P. A., et al. 2015, ApJ, 811, 140
- Coughlin et al. (2018) Coughlin, A., Rhoads, J. E., Malhotra, S., et al. 2018, ApJ, 858, 96
- Dawson et al. (2004) Dawson, S., Rhoads, J. E., Malhotra, S., et al. 2004, ApJ, 617, 707
- Dawson et al. (2007) Dawson, S., Rhoads, J. E., Malhotra, S., et al. 2007, ApJ, 671, 1227
- Dewdney et al. (2009) Dewdney, P. E., Hall, P. J., Schilizzi, R. T., et al. 2009, IEEE Proceedings, 97, 1482
- Hu et al. (2010) Hu, E. M., Cowie, L. L., Barger, A. J., et al. 2010, ApJ, 725, 394
- Kashikawa et al. (2006) Kashikawa, N., Shimasaku, K., Malkan, M. A., et al. 2006, ApJ, 648, 7
- Khochfar, & Burkert (2001) Khochfar, S., & Burkert, A. 2001, ApJ, 561, 517
- Larson et al. (2018) Larson, R. L., Finkelstein, S. L., Pirzkal, N., et al. 2018, ApJ, 858, 94
- Leitherer et al. (1999) Leitherer, C., Schaerer, D., Goldader, J. D., et al. 1999, ApJS, 123, 3
- Madau (1995) Madau, P. 1995, ApJ, 441, 18
- Malhotra, & Rhoads (2006) Malhotra, S., & Rhoads, J. E. 2006, ApJ, 647, L95
- Oesch et al. (2015) Oesch, P. A., van Dokkum, P. G., Illingworth, G. D., et al. 2015, ApJ, 804, L30
- Ouchi et al. (2010) Ouchi, M., Shimasaku, K., Furusawa, H., et al. 2010, ApJ, 723, 869
- McLean et al. (2012) McLean, I. S., Steidel, C. C., Epps, H. W., et al. 2012, Proc. SPIE, 84460J
- Probst et al. (2004) Probst, R. G., Gaughan, N., Abraham, M., et al. 2004, Proc. SPIE, 1716
- Probst et al. (2008) Probst, R. G., George, J. R., Daly, P. N., et al. 2008, Proc. SPIE, 70142S
- Rhoads, & Malhotra (2001) Rhoads, J. E., & Malhotra, S. 2001, ApJ, 563, L5
- Rhoads et al. (2012) Rhoads, J. E., Hibon, P., Malhotra, S., et al. 2012, ApJ, 752, L28
- Rhoads et al. (2003) Rhoads, J. E., Dey, A., Malhotra, S., et al. 2003, AJ, 125, 1006
- Somerville, & Kolatt (1999) Somerville, R. S., & Kolatt, T. S. 1999, MNRAS, 305, 1
- Stark et al. (2017) Stark, D. P., Ellis, R. S., Charlot, S., et al. 2017, MNRAS, 464, 469
- Steidel et al. (2003) Steidel, C. C., Adelberger, K. L., Shapley, A. E., et al. 2003, ApJ, 592, 728
- Stiavelli et al. (2004) Stiavelli, M., Fall, S. M., & Panagia, N. 2004, ApJ, 610, L1
- Swaters et al. (2009) Swaters, R. A., Valdes, F., & Dickinson, M. E. 2009, Astronomical Data Analysis Software and Systems XVIII, 506
- Wang et al. (2009) Wang, J.-X., Malhotra, S., Rhoads, J. E., Zhang, H.-T., & Finkelstein, S. L. 2009, ApJ, 706, 762
- Yajima et al. (2018) Yajima, H., Sugimura, K., & Hasegawa, K. 2018, MNRAS, 477, 5406