Modelling the strongest silicate emission features of local type 1 AGN
Abstract
We measure the 10 and m silicate features in a sample of 67 local () type 1 active galactic nuclei (AGN) with available Spitzer spectra dominated by non-stellar processes. We find that the m silicate feature peaks at m with a strength (Si = ln f(spectrum)/f(continuum)) of , while the m one peaks at m with a strength of . We select from this sample sources with the strongest 10m silicate strength (, 10 objects). We carry out a detailed modeling of the IRS/Spitzer spectra by comparing several models that assume different geometries and dust composition: a smooth torus model, two clumpy torus models, a two-phase medium torus model, and a disk+outflow clumpy model. We find that the silicate features are well modeled by the clumpy model of Nenkova et al. 2008, and among all models those including outflows and complex dust composition are the best (Hoenig et al. 2017). We note that even in AGN-dominated galaxies it is usually necessary to add stellar contributions to reproduce the emission at the shortest wavelengths.
1 Introduction
A dusty torus surrounds the central engine of active galactic nuclei (AGN) on a scale of few pc (e.g., Krolik_Begelman88; Antonucci93; Robson95; Peterson97). It shines at infrared (IR) wavelengths between 1 to 1000 m peaking at around 20 m (e.g, Sanders89; Elvis94). This emission is the result of the IR re-radiation of optical-UV light generated around the central black hole (BH) that has been absorbed by the dusty torus (Neugebauer79). The main observational components that describe it are the slope of the spectral energy distribution (SED) between 1-8 m, and the strength of the silicate features around 10m and 18m, that are produced within the warm dust of the torus that the AGN directly illuminates. The silicate features have been observed mostly in emission with the mid-infrared (MIR) infrared spectrometer (IRS) Spitzer in type 1 AGN (Siebenmorgen05; Hao05; Hatziminaoglou15). In these AGN the 10m silicate feature is broader and peaks at much longer wavelengths ( m) than the “normal” silicate emission feature of the Galactic inter-stellar medium (ISM) (e.g, Hao05; Siebenmorgen05; Sturm05; Li08). This suggests different silicate compositions, such as a different proportion and/or size of grains (e.g., Shi06; Li08).
Martinez-Paredes17 used the starburst-subtracted IRS/Spitzer spectra of 20 quasi stellar objects (QSOs) between to 15 m plus the unresolved near-infrared (NIR) emission to constrain the parameters of the dusty torus using the CLUMPY models of Nenkova08a; Nenkova08b. They noted that in most cases the spectral range around 8m is underestimated by the CLUMPY models and that trying to fit this part of the spectrum resulted in a bad fit of the silicate feature at 10m. Furthermore, in most cases the peak of the 10m silicate feature was shifted from the model location.
Considering that the shape and peak of the silicate features are strongly correlated with the properties of the dust (e.g., Draine07; Sirocky08), in this work we use five of the most popular torus models to investigate how well they reproduce the strongest silicate emission features observed in type 1 AGN. Recently, Gonzalez-Martin19a compared these models and found that they can be distinguished according to the continuum slopes and silicate strengths, and in a second work (Gonzalez-Martin19b) they used MIR spectroscopy data of type 1 and type 2 AGNs in the Swift/BAT survey to investigate how these models reproduce their spectral continuum. We focus our study on type 1 AGN with strong silicate emission features because: 1) for type 2 AGN, the inclusion of a fraction () of silicate grains, either based on Draine03 or Ossenkopf92 are enough to reproduce the observed silicate features in absorption (see e.g., RamosAlmeida11; Alonso-Herrero11; Martinez-Paredes15); and 2) the silicate features are well above the continuum in the low resolution Spitzer spectra, which support the interpretation that the silicate features are due to AGN activity.
In this paper we aim at exploring how accurately smooth, clumpy, two-phase, and outflow torus models reproduce the IRS/Spitzer spectra of these objects, and analyzing the results in terms of physical differences like the geometry and dust composition assumed. The first model that we consider is the smooth torus model of (Fritz06, Fritz06 hereafter), which assumes a continuous distribution of dust composed of graphite and silicate grains in almost equal percentages. The second model is the CLUMPY torus model of (Nenkova08a; Nenkova08b, Nenkova08), which assumes a standard ISM dust composition of silicates and graphite with sizes between 0.025 and 0.25 m. The third torus model is clumpy (Hoenig10, Hoenig10) and assumes three dust components that include the standard ISM composition, the standard ISM composition with larger grains (0.1 - 1.0 m), and a larger fraction of graphite grains ( silicates and graphite, with sizes between 0.05 and 0.25 m). The fourth model (Hoenig17, Hoenig17) has two components: a dusty clumpy disk that takes into account the emission from the hotter dust close to the central engine; and a hollow cone formed by a wind of clumpy dusty clouds elongated toward the polar direction. This model assumes that the wind is originated close to the sublimation zone of the dusty disk. Because of that, the dust in the wind has similar properties to the dust in the sublimation zone.
The paper is organized as follows: in Section 2 we present our sample selection and data; in Section 3 we describe the models; in Section 4 we present the analysis; and in Section 5 the discussion. Our summary and conclusions are presented in Section 6. We adopt the following cosmology: H = 73 km s Mpc, and .
2 The sample and data
2.1 The silicate dominated local AGN
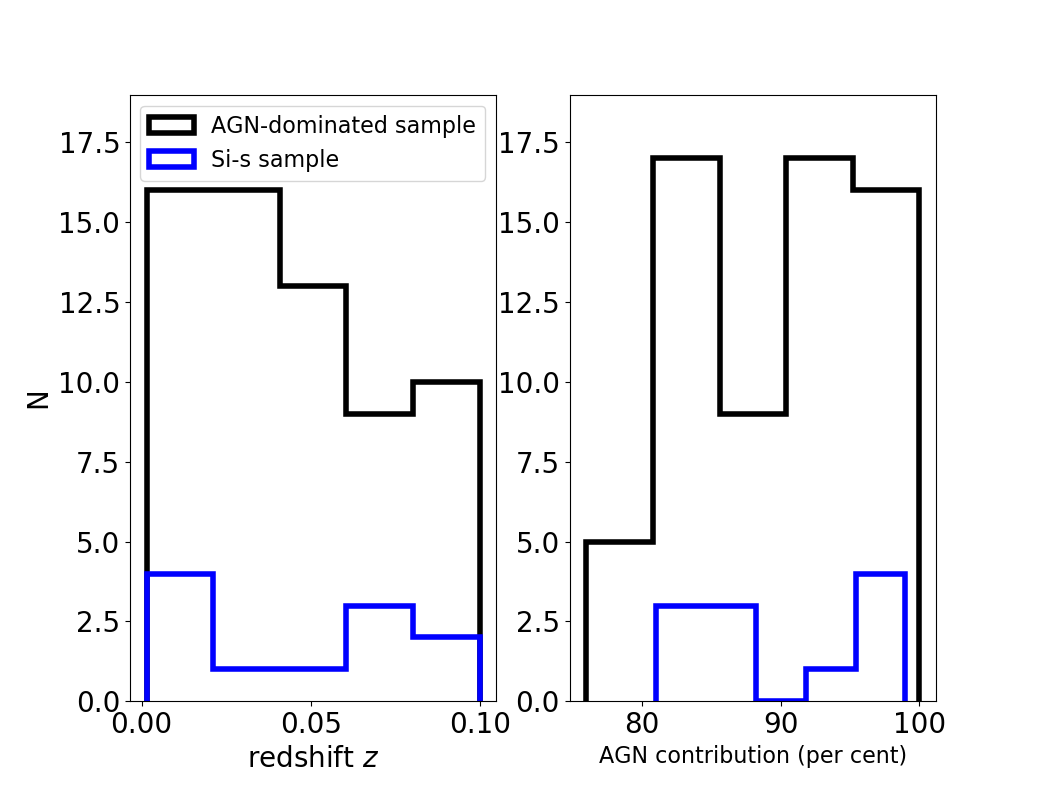
We use the latest version of the AGN catalog of Veron_Veron10 and the sample of low luminosity type 1 AGN in Mason12 to select AGN that have redshifts and available 2D low-resolution IRS/Spitzer spectra in the CASSIS database (v6., Lebouteiller11). We select those objects with spectra extracted as point-sources that cover the m spectral range. The first criterion allows us to probe the MIR emission from the central region of the AGN, and the second one allows us to study both the 10 and 18m silicate features. As an exception, we include NGC 3998, a strong silicate emitter (e.g., Mason12), which has a low-resolution spectrum in the 7.5-14.5m range and a high-resolution spectrum in the 14-35m range. In order to ensure that the emission in the IRS/Spitzer spectra is mostly dominated by dust heated by the AGN, we decompose them into their stellar, ISM and AGN emission (dust heated by AGN) components at m, using the spectral decomposition tool DeblendIRS (Hernan-Caballero15). For more details on the spectral decomposition we refer the reader to Appendix A. We select only those objects (67) for which the spectral contribution due to AGN is (see Figure 1). Hereafter, we refer to the spectra of these objects as the AGN-dominated IRS/Spitzer spectra. Note that we refer here to the original spectra, not to the component obtained from the decomposition.
2.2 The IRS/Spitzer spectra
We obtained the reduced low resolution () IRS/Spitzer spectra from the CASSIS database (v6., Lebouteiller11). The spectra include the SL1 (m) and SL2 (m) modules with a slit-width of 3.6 arcsec, and the LL1 (m) and LL2 (m) modules with a slit-width of 10.5 arcsec (Werner04; Houck04). We use the final stitched spectra between m. The different module spectra were stitched by scaling the LL and SL1 flux modules to the shortest module SL2 flux.
2.3 Measuring the silicate emission features
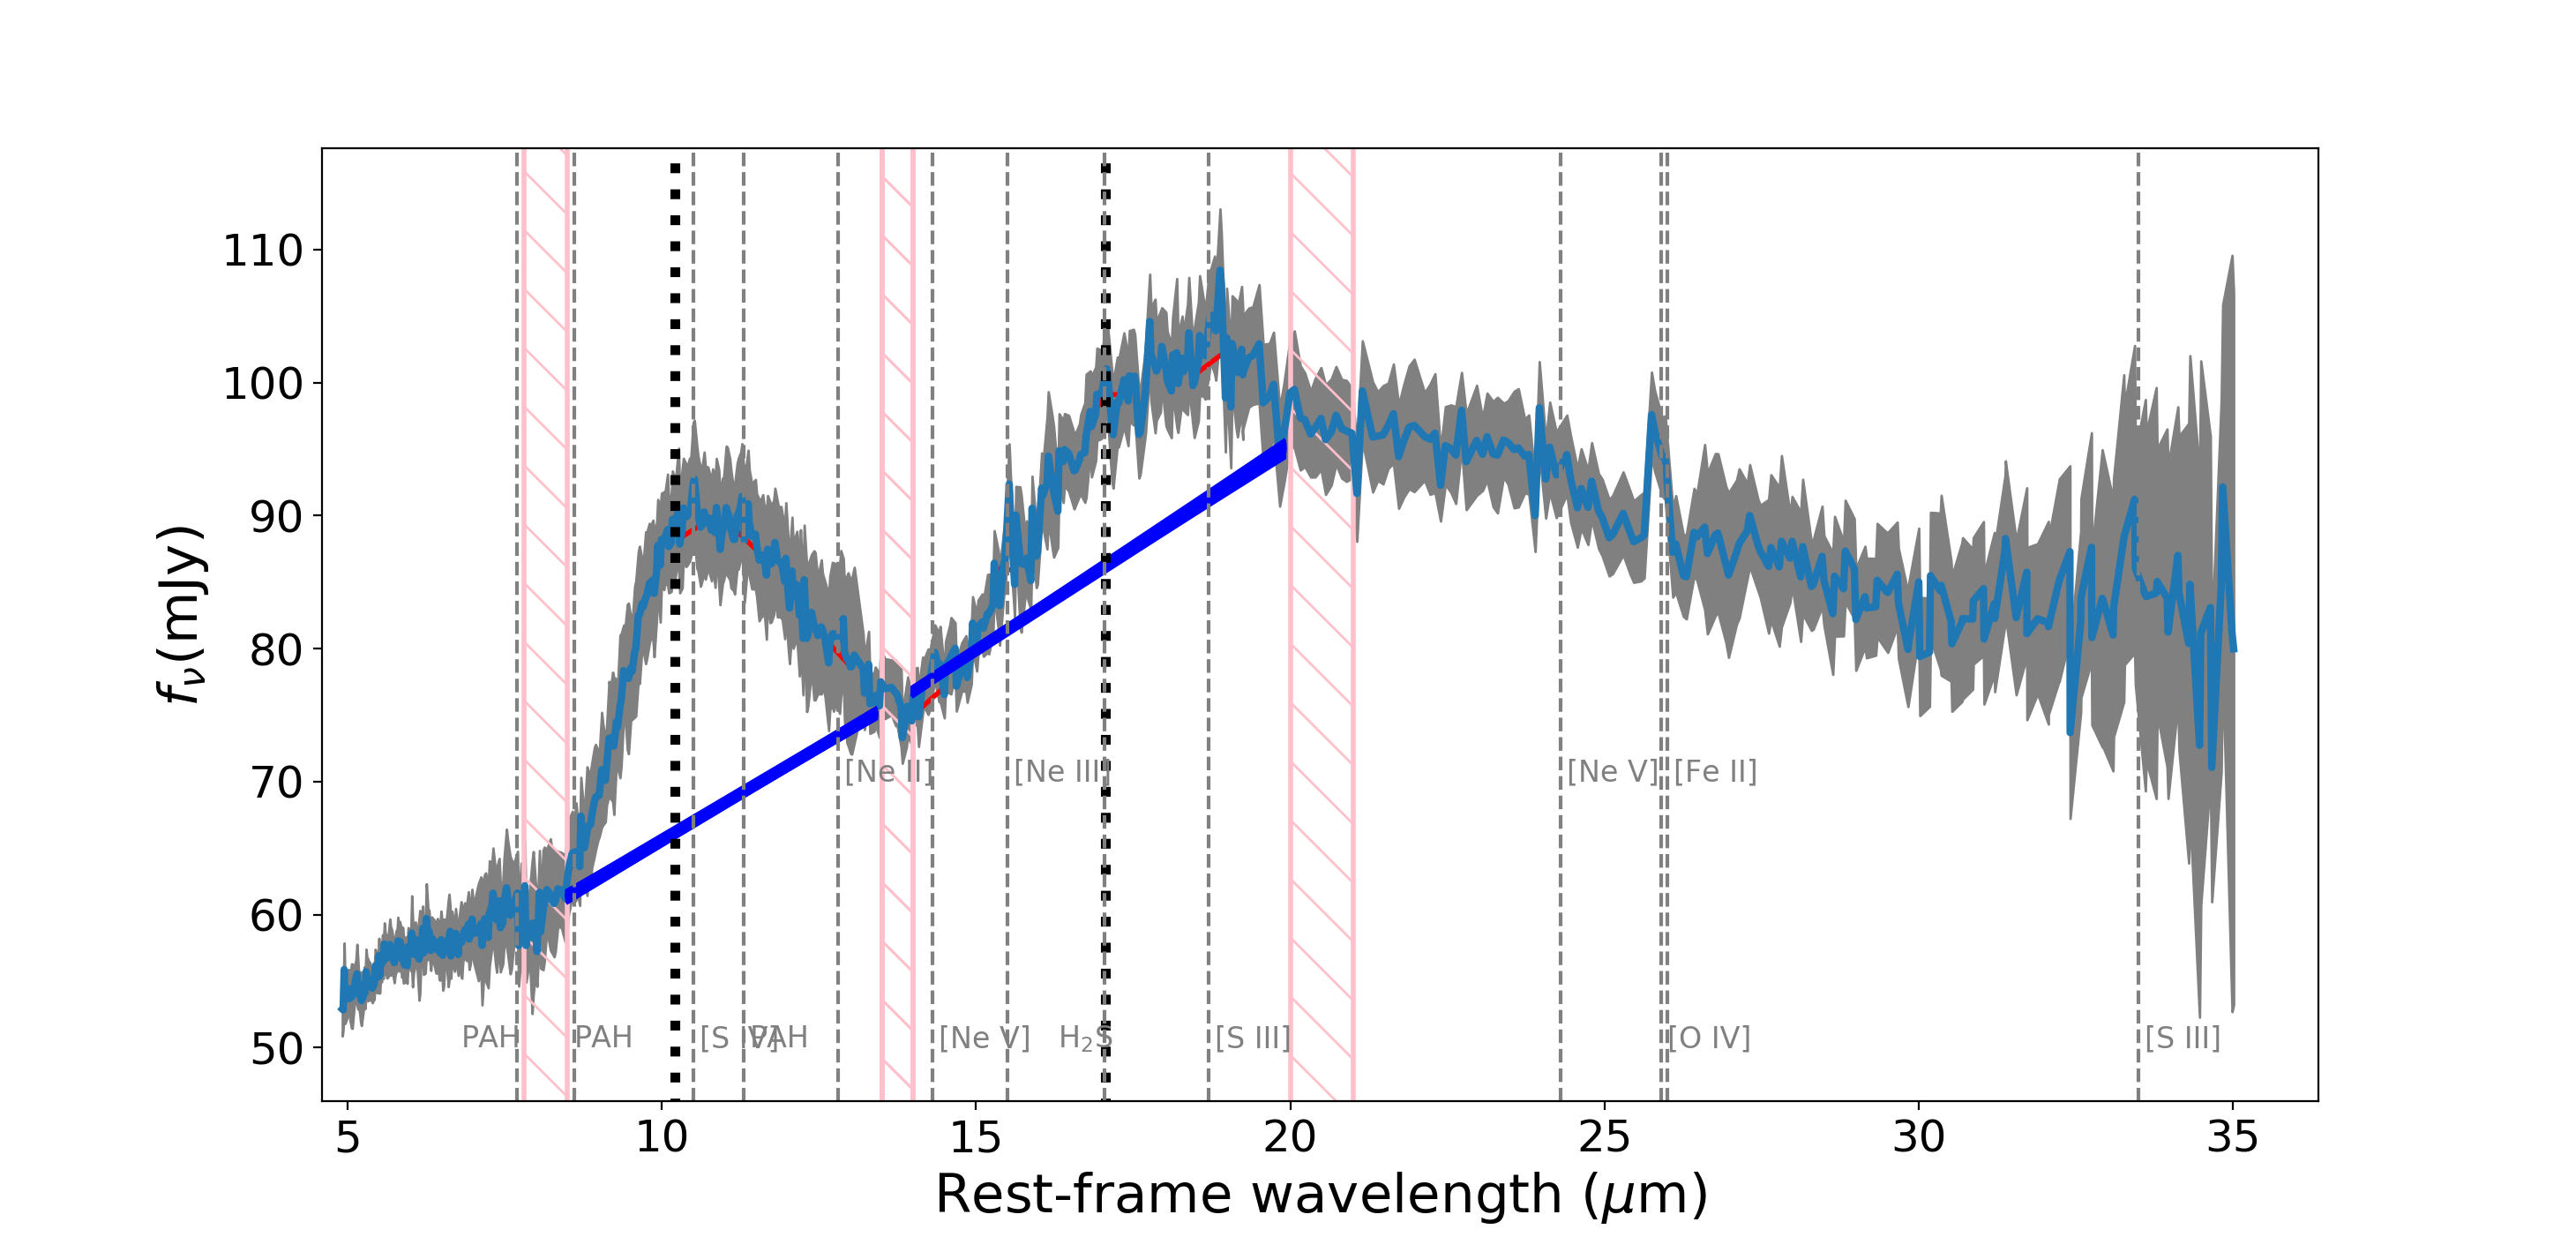
To measure the silicate emission features we start by interpolating a local continuum between both sides of the emission line complexes. We inspect each spectrum visually and choose three bands in which to measure the continuum. Band 1 is located at the blue extreme of the 10m silicate feature, while band 3 is located at the red extreme of the 18m silicate feature, and band 2 is located between the two silicates features. Band 1, 2 , and 3 are located within the , and m ranges.
In order to better define uncertainties in the continuum definition, which might be affected by the presence of Polycyclic Aromatic Hydrocarbon (PAH) molecular emission lines around 7m, and in some cases by the artificial “teardrop”111An excess of emission present in the 2D SL1 spectrum of some objects. feature around 14m, we trace fiducial mean values of each continuum band by bootstrapping on the measured fluxes (hatched pink regions in Figure 2). We generate 100 continuum values, considering the uncertainties, between band 1 and 2, and between band 2 and 3. We randomly associate shorter and longer wavelength mean continuum values to generate linear continua below the silicate features. We note that fitting a spline continuum gives similar results. The dark blue solid lines in Figure 2 are bootstrapped local continua derived from the continuum bands and they define the regions where we measure the strength of the silicate features.
Considering that the peak of the silicate features vary from object to object, we choose to measure the strength of the features at the wavelengths where they peak. However, for simplicity we still call them the 10 and 18m silicate features. The silicate strength is, hence, defined as the silicate peak relative to the continuum, at the wavelength where the silicate feature peaks (see e.g., Hao07), according to the equation:
| (1) |
In Table 1 we list the mean and the 68 percent intervals for the objects with the largest silicate feature strengths. In Appendix B (Table LABEL:tab:silicates_IRS_all) we list the silicate emission strengths for the full sample. On average, we find that type 1 AGN have a 10m silicate strength that peaks at m, and a 18m silicate strength that peaks at 17.3m.
| Name | Activity | z | Ref. | Si | Si | |||
|---|---|---|---|---|---|---|---|---|
| erg s | (m) | (m) | ||||||
| NGC7213 | LINER | 0.0058 | 42.2 | 6 | ||||
| PG2304+042 | Sy1.2 | 0.0420 | 43.4 | 9 | ||||
| PKS0518-45 | LINER | 0.0420 | 44.9 | 8 | ||||
| PG0844+349 | Sy1/QSO | 0.0640 | 43.7 | 1 | ||||
| PG1351+640 | Sy1.5/QSO | 0.0882 | 43.1 | 6 | ||||
| PG2214+139 | Sy1.0/QSO | 0.0658 | 43.8 | 1 | ||||
| PG0804+761 | Sy1/QSO | 0.1000 | 44.5 | 1 | ||||
| OQ208 | Sy1.5 | 0.0766 | 40.8 | 3 | ||||
| NGC4258 | LINER | 0.0015 | 40.9 | 5 | ||||
| NGC3998 | LINER | 0.0035 | 41.2 | 4 |
Note.-This value needs to be used carefully, since we are using the high angular resolution spectrum to fix the band 3 and measure the m silicate feature strength. References:NED and Veron_Veron10, Mason12. Estimated from (15-150)+keV X-ray luminosity assuming a spectral power law with an index . References for hard X-ray luminosity: 1: Zhou2010; 2: Sambruna11; 3: Ueda05; 4: Younes11; 5: Cappi06; 6: Bianchi09; 7:Brightman_Nandra11; 8: Winter12; 9: Tueller10; 10: Cusumano10.