Accepted for publication in The Astrophysical
Journal Supplement Series (12-31-2019)
Superhydrogenated Polycyclic Aromatic Hydrocarbon Molecules:
Vibrational Spectra in the Infrared
Abstract
Superhydrogenated polycyclic aromatic hydrocarbons (PAHs) may be present in H-rich and ultraviolet-poor benign regions. The addition of excess H atoms to PAHs converts the aromatic bonds into aliphatic bonds, the strongest of which falls near 3.4. Therefore, superhydrogenated PAHs are often hypothesized as a carrier of the 3.4 emission feature which typically accompanies the stronger 3.3 aromatic C–H stretching feature. To assess this hypothesis, we use density function theory to compute the infrared (IR) vibrational spectra of superhydrogenated PAHs and their ions of various sizes (ranging from benzene, naphthalene to perylene and coronene) and of various degrees of hydrogenation. For each molecule, we derive the intrinsic oscillator strengths of the 3.3 aromatic C–H stretch () and the 3.4 aliphatic C–H stretch (). By comparing the computationally-derived mean ratio of with the mean ratio of the observed intensities , we find that the degree of superhydrogenation — the fraction of carbon atoms attached with extra hydrogen atoms — is only 2.2% for neutral PAHs which predominantly emit the 3.3 and 3.4 features. We also determine for each molecule the intrinsic band strengths of the 6.2 aromatic C–C stretch () and the 6.85 aliphatic C–H deformation (). We derive the degree of superhydrogenation from the mean ratio of the observed intensities and for neutrals and for cations to be 3.1% for neutrals and 8.6% for cations. We conclude that astrophysical PAHs are primarily aromatic and are only marginally superhydrogenated.
1 Introduction
The so-called “unidentified” infrared (IR) emission (UIE) bands, which are composed of a distinctive set of broad emisison features at 3.3, 6.2, 7.8, 8.6 and 11.3, are ubiquitously detected in a wide range of Galactic and extragalactic environments (see Tielens 2008). The hypothesis of polycyclic aromatic hydrocarbon (PAH) molecules as a viable carrier of the UIE bands, originally proposed by Léger & Puget (1984) and Allamandola et al. (1985), has been widely accepted. The PAH hypothesis attributes the UIE bands to the vibrational modes of PAHs, with the 3.3 feature assigned to C–H stretching modes, the 6.2 and 7.7 features to C–C stretching modes, the 8.6 feature to C–H in-plane bending modes, and the 11.3 feature to C–H out-of-plane bending modes. According to this hypothesis, PAHs are present in the interstellar medium (ISM) in various sizes, geometries, and charging states (Allamandola et al. 1989, Peeters 2004). The relative strengths of these bands depend on the size, charge and molecular structure of the PAH molecule (Allamandola et al. 1999, Draine & Li 2001) and the physical conditions (e.g., the intensity and hardness of the starlight illuminating the molecule, the electron density and gas temperature; see Bakes & Tielens 1994, Weingartner & Draine 2001).
In the diffuse ISM and photodissociated regions (PDRs) where hydrogen (H) atoms are abundant, astronomical PAHs are exposed to the continuous bombardment of H atoms and may likely have excess peripheral H atoms (see Andrews et al. 2016 and references therein). In the following, we term superhydrogenated PAHs as those PAHs whose edges contain excess H atoms. In the literature, superhydrogenated PAHs are often also called hydrogenated PAHs. In this work we will use the term “superhydrogenated PAHs” (or “superhydrogenation”) interchangeably used with the term “hydrogenated PAHs” (or “hydrogenation”). The interaction between PAHs and H atoms has been studied both theoretically (Cassam-Chenaï et al. 1994, Bauschlicher 1998, Le Page et al. 2009) and experimentally (Ricks et al. 2009, Boschman et al. 2012, Klrke et al. 2013, Cazaux et al. 2016). These studies have demonstrated that it is possible to superhydrogenate PAH cations, particularly in regions rich in ultraviolet (UV) photons (e.g., the surface of PDRs). Theoretical studies have also shown that superhydrogenation of neutral PAHs in H-rich, UV-poor benign regions (e.g., protoplanetary nebulae) is possible (e.g., see Rauls & Hornekr 2008, Rasmussen et al. 2011). Experimentally, it has been demonstrated that coronene (C24H12) could be fully superhydrogenated to form perhydrocoronene (C24H36) in low UV flux regions (see Thrower et al. 2012, 2014). Wolf et al. (2016) explored experimentally the photo-stability of cationic pyrene (C16H10+) with six (C16H16+) or 16 extra H atoms (C16H26+) and found superhydrogenated pryene cations would undergo backbone fragmentation upon absorption of two (for C16H16+) or one (for C16H26+) photons of energy just below 3 eV. On the other hand, by combining thermal desorption mass spectrometry measurements and density functional theory (DFT) calculations, Jensen et al. (2019) have shown the existence of stable configurations of superhydrogenated neutral coronene. Halasinski et al. (2005) and Hammonds et al. (2009) obtained the electronic spectra of hydrogenated PAHs and their ions, respectively through the matrix isolation spectroscopy experiments and the time-dependent DFT computations. They argued that hydrogenated PAHs might be responsible for some of the diffuse interstellar bands.
Superhydrogenated PAHs have been suggested to be (at least partly) responsible for the 3.4 emission feature detected in many UIE sources which always accompanies the (often much stronger) 3.3 feature (e.g., see Geballe et al. 1985, 1989, Jourdain de Muizon et al. 1986, 1990, Nagata et al. 1988, Allamandola et al. 1989, Sandford et al. 1991, Joblin et al. 1996, Sloan et al. 1997, Goto et al. 2003, Smith et al. 2004, Kondo et al. 2012, Yamagishi et al. 2012, Seok & Li 2017, Quitián-Lara et al. 2018). The exact carrier of the 3.4 emission feature remains unidentified, although it is often thought to arise from the aliphatic side chains attached as functional groups to PAHs (see Yang et al. 2017a and references therein). However, Wagner et al. (2000) obtained the IR emission spectra of five gas-phase UV laser-excited PAHs, two of which are methylated and three of which are peripherally hydrogenated. They found that hydrogenated PAHs produce a better match to astrophysical data than methylated PAHs. The 3.4 emission feature could also be due to the anharmonicity of the aromatic C–H stretching vibration (see Barker et al. 1987, Maltseva et al. 2016). Let be the vibrational quantum number. In a harmonic oscillator, the spacing between all adjacent vibrational energy levels is constant, hence the vibrational transitions between high levels result in the same spectral line as that of the transition. In contrast, anharmonicity would continuously decrease the spacing between the adjacent vibrational states for higher values of , and therefore the transitions between higher levels occur at increasingly longer wavelengths. The anharmonicity model interprets the weaker feature at 3.4 as the “hot band” of the 3.3 fundamental aromatic C–H stretching mode (see Barker et al. 1987).111The anharmonicity model also predicts a weak band at 1.6–1.8, the overtone of the aromatic C–H stretch and/or combination bands (Brenner & Barker 1992, Geballe et al. 1994, Chen et al. 2019).
In superhydrogenated PAHs, some peripheral C atoms have two H atoms and the extra H atom converts the originally aromatic ring into an aliphatic ring. This creates two aliphatic C–H stretching bands: one due to the symmetric and the other to the asymmetric C–H stretching modes. These bands would fall near 3.4 and could (at least partly) account for the 3.4 emission (Schutte et al. 1993, Bernstein et al. 1996, Sandford et al. 2013, Steglich et al. 2013). Pauzat & Ellinger (2001) suggested that hydrogenated PAHs also produce series of bands that may be at the origin of the broad plateau observed below the 3.4 feature.
Superhydrogenated PAHs also exhibit two aliphatic C–H deformation bands at 6.85 and 7.25 (e.g., see Sandford et al. 2013). Their low intensities put them at the limit of modern observational techniques. Observationally, these two bands have been detected both in the Milky Way and in the Large and Small Magellanic Clouds (e.g., see Acke et al. 2010, Sloan et al. 2014, Materese et al. 2017), but only in a limited number of objects (see Table 3 of Yang et al. 2016a for a summary). This will change with the launch of the James Webb Space Telescope (JWST). The Mid-IR Instrument (MIRI) on JWST will cover the wavelength range of the aliphatic C–H deformation bands with a medium spectral resolution of 1550–3250 and unprecedented sensitivity. On the other hand, the Near-IR Spectrograph (NIRSpec) on JWST with a spectral resolution up to 2700 will allow one to probe the aromatic and aliphatic C–H stretches at 3.3 and 3.4 in depth. JWST’s unique high sensitivity and near- and mid-IR medium spectral resolution capabilities will open up an IR window unexplored by the Spitzer Space Telescope and unmatched by the Infrared Space Observatory (ISO) and thus will probably place the detection of superhydrogenated PAHs on firm ground and enable far more detailed band analysis than previously possible.
The opportunity to thoroughly probe superhydorgenated PAHs in various astrophysical regions using JWST motivates us to employ DFT to compute the IR spectra of a series of superhydrogenated PAH molecules and their cations, with special attention paid to the intrinsic strengths of the aliphatic C–H bands at 3.4, 6.85 and 7.25. In §2 we briefly describe the computational methods and the structures of our target molecules. §3 presents the computed IR spectra as well as the intrinsic oscillator strengths of the aromatic and aliphatic C–H bands. The astrophysical implications are discussed in §4. Finally, we summarize our major results in §5.
2 Computational Methods and Target Molecules
We use the Gaussian09 and Gaussian16 softwares (Frisch et al. 2009) to calculate the IR vibrational spectra of a range of superhydrogenated PAHs and their cations. We employ the hybrid DFT method B3LYP (Frisch et al. 2009) in conjunction with the 6-311+G∗∗ basis set, i.e., triple functions are included to describe the valence orbitals, diffuse functions are applied to the heavy (i.e., carbon) atoms, and polarization functions are applied to both heavy atoms and hydrogen atoms. The neutral hydrocarbons are closed-shell systems and they will be computed with restricted wave functions (RB3LYP). The cationic hydrocarbons are the result of single electron oxidation and these radical cations will be computed with unrestricted wave functions (UB3LYP). We optimize the molecule structures and then calculate the harmonic vibrational spectra (see Yang et al. 2017b and references therein).
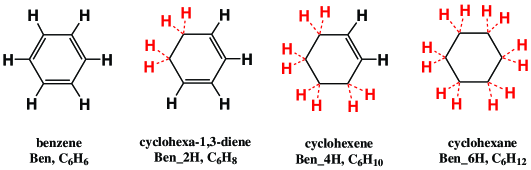
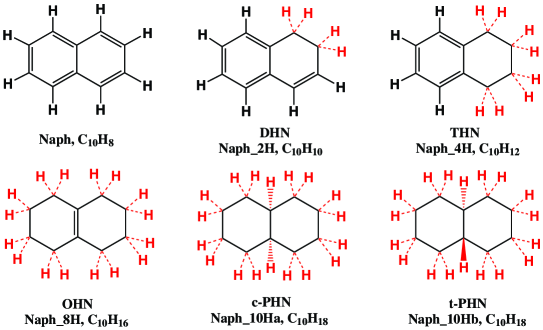
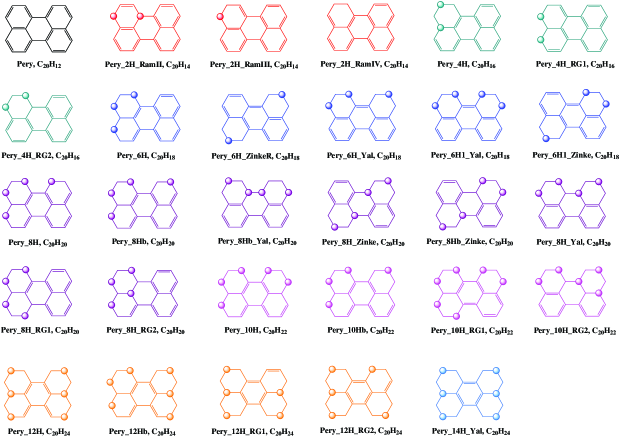
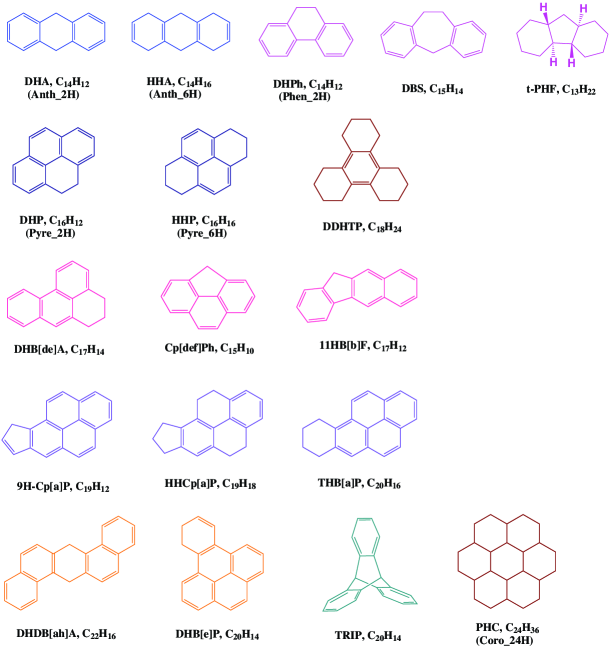
Our target molecules include the derivatives of benzene (Figure 1), of naphthalene (Figure 2), of perylene (Figure 3) and of those experimentally investigated by Sandford et al. (2013; see Figure 4). For all our target molecules, we consider hydrogenation products that result from the addition of an even number of H atoms. The radical species resulting from the addition of an odd number of H atoms are likely to have short lifetimes. We will refer to hydrogenated species by the abbreviation of the first three or four letters of their parent PAH name followed by the number of extra H atoms (e.g., Pery2H refers to perylene attached with 2 extra H atoms). But for those molecules studied by Sandford et al. (2013), we shall adopt the abbreviations given by them (see Table 1 of Sandford et al. 2013). More descriptive names shall also be used if such names are common. Many of the structures allow for structural isomers (i.e., H atoms are attached at different positions) and some of the structural isomers may adopt several conformations of the same connectivity but different spacial arrangement. Isomers and conformers will be distinguished by the addition of a letter.
In general, we will focus on the most likely and/or most stable structure. For benzene, for example, we will only consider cyclo–1,3–hexadiene (Ben2H; see Figure 1) and ignore the less stable isomer cyclo–1,4–hexadiene. Also, we will consider only cyclohexene (Ben4H; see Figure 1) and ignore all derivatives in which the CH groups are not geminal. Moreover, we will consider only the best conformation for all these systems such as the chair conformation of cyclohexane (Ben6H; see Figure 1) while ignoring the less stable boat conformations. For dihydroperylene (Pery2H; see Figure 3) we will consider three structural isomers (Pery2HRamII, Pery2HRamIII, and Pery2HRamIV; see Figure 3). We will describe these isomers and their conformations in more detail below along with the structures of the other superhydrogenated perylenes.
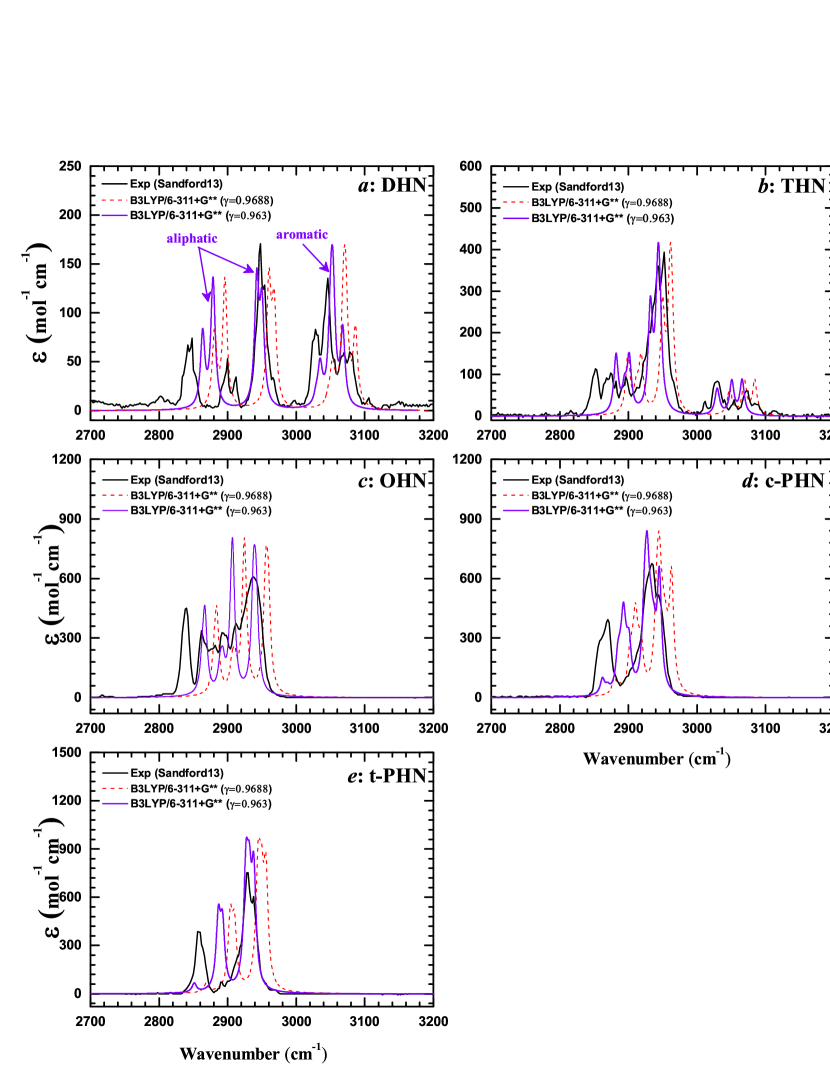
To verify our computations, we compare our computational results with experimental measurements. Figure 5 shows the computed IR spectra (color lines) along with the experimental results (black line) for the hydrogenated species of naphthalene, i.e., Series A marked by Sandford et al. (2013).222 We note that here the band strengths of the experimental spectra are scaled to that of the calculated spectra since Sandford et al. (2013) did not report the absolute band strengths of these molecules. In Figure 5, the red dashed lines represent the computational spectra applied with the frequency scale factor () of 0.9688 given by Borowski (2012). As we can see that the scaled computational spectra are systematically blue-shifted with respect to the experimental spectra. Hence, we determine an optimized scale factor of . With this scale factor, the agreement between computations (purple solid lines) and experiments (black solid lines) is remarkably improved for bands which correspond to pure fundamental vibrations, and this fact attests to the quality of our computations.
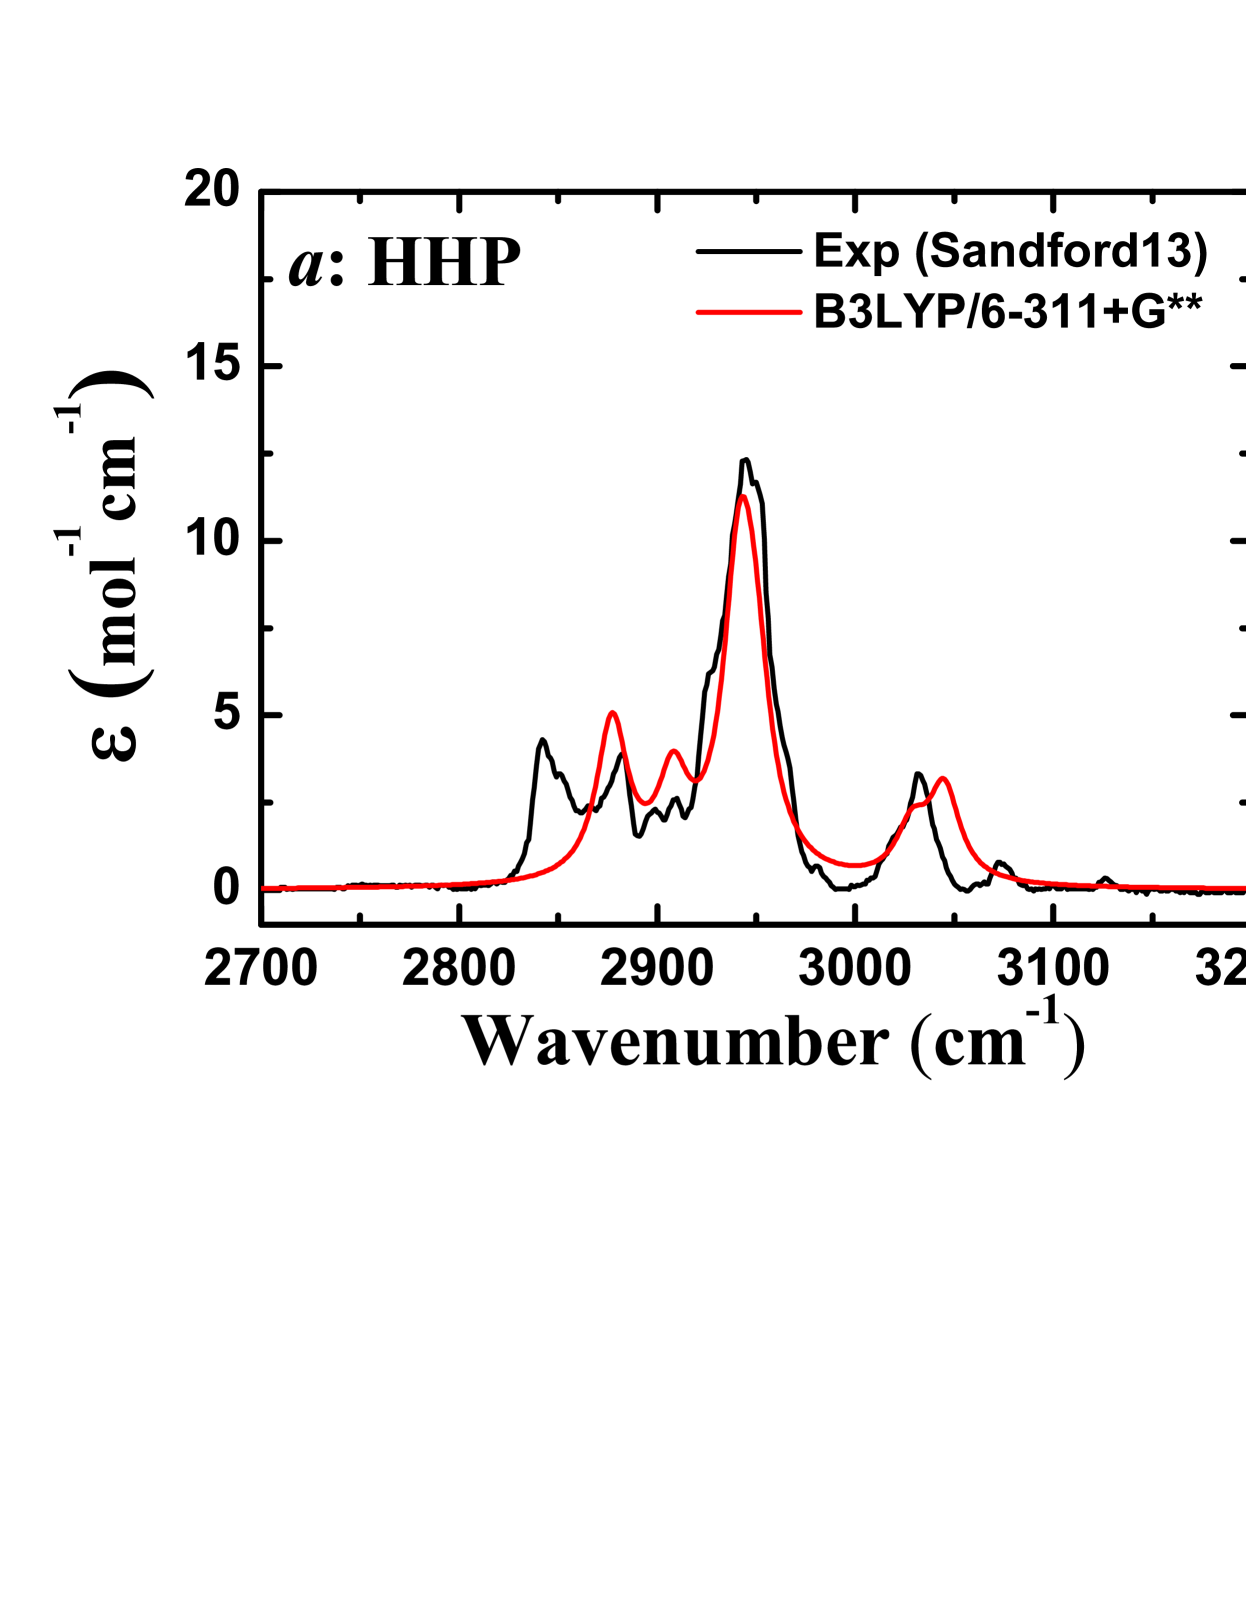
In Figure 6, we further compare our computational spectra of HHP (i.e., Pyre6H, C16H16) and THB[a]p (C20H16; see Figure 4) with the experimental spectra of Sandford et al. (2013). As we can see, with a line width of 10 and a scale factor of 0.963 for the frequencies, our calculations agree quite well with the experiments. Therefore, we believe that our calculations are reliable, and the optimized scaling factor of = 0.963 for frequencies will be applied in the following.
The intensity scaling is much more complicated than the frequency scaling since the experimental data for the band intensities of hydrogenated PAHs are rare and, in band assignment, it is often difficult to obtain a one-to-one correspondence between the experimental and computational spectra. Therefore, a common way is to derive the relative strength, the strength of one band (e.g., the 3.4 band) relative to another band (e.g., the 3.3 band), and then compare the relative band strengths of the computational data with that of experimental data, with the band intensity obtained by integrating the intensity profile of the band which contains several neighboring peaks. This will be discussed in detail in §3.4. In the following, we will present the calculated intensities without any scaling.
3 Results
3.1 Benzene Derivatives
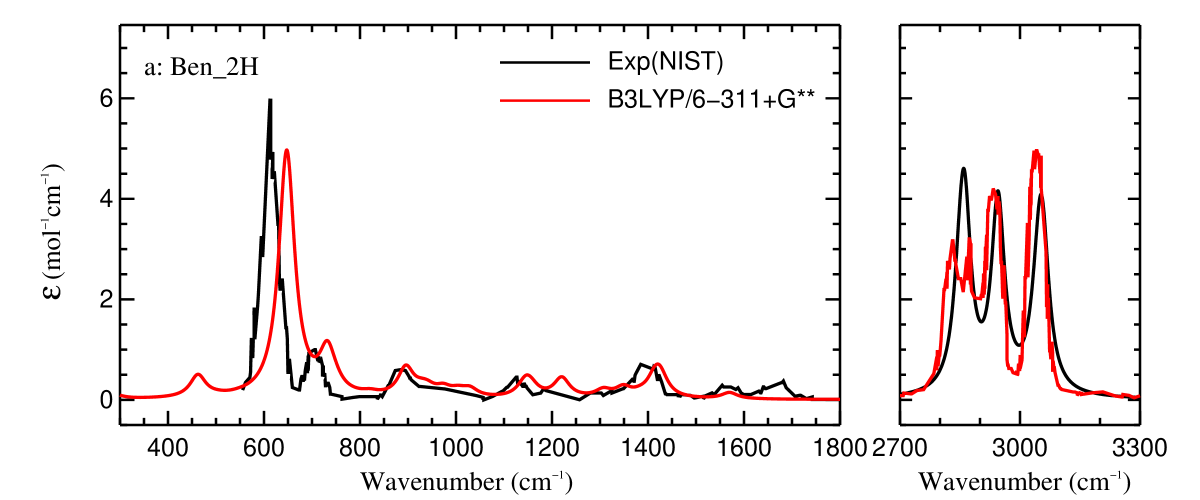
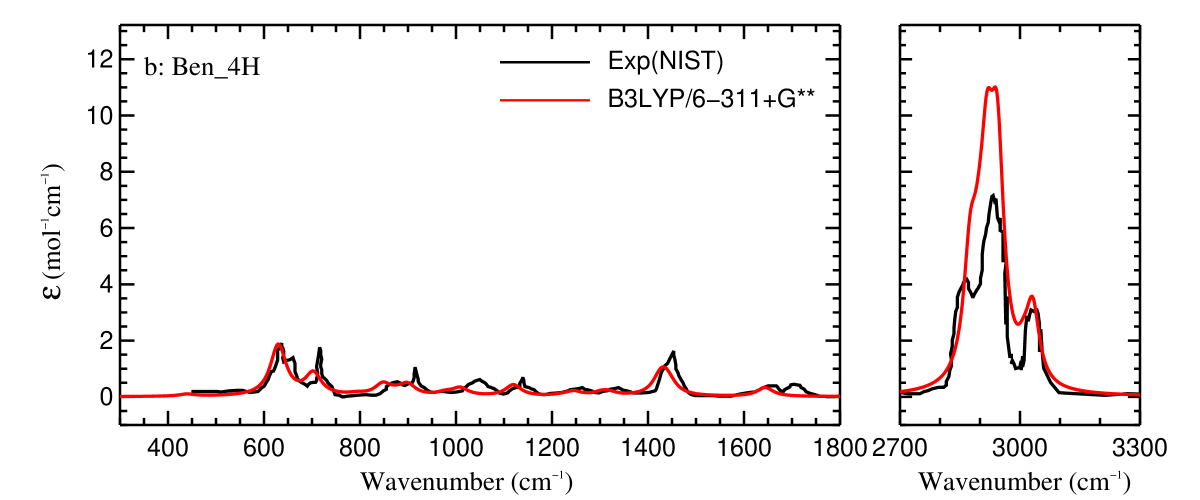
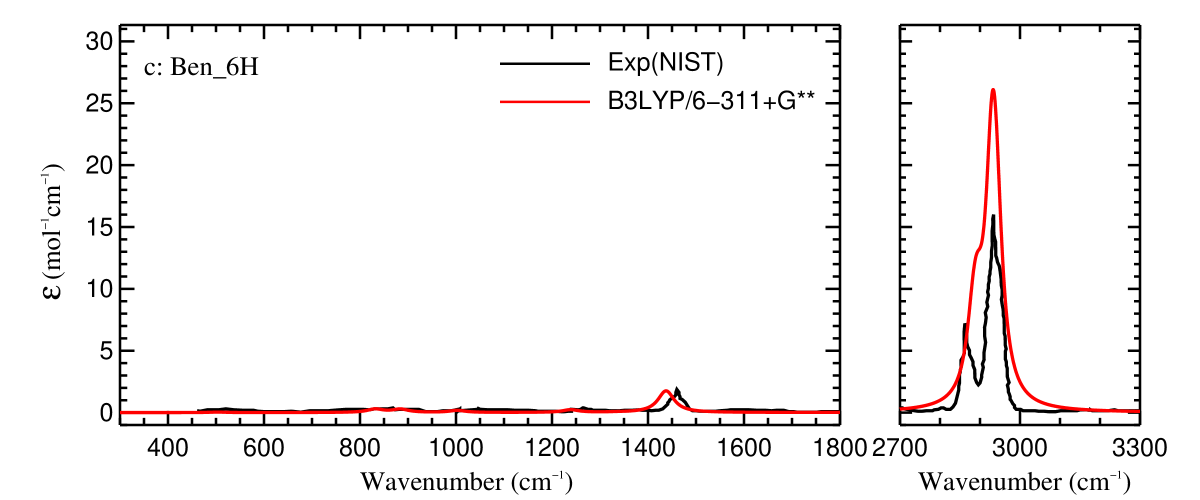
We start from the smallest PAH molecule benzene and its hydrogenated derivatives. The computed total energies and thermochemical parameters are given in Table 1. The calculated spectra for neutral Ben2H, Ben4H and Ben6H are shown in Figure 7 along with the corresponding experimental spectra from the National Institute of Standards and Technology (NIST). The calculated frequencies are scaled with our optimized factor of . For each spectral feature, we assign a line width of 20. Since NIST only provides information about the absorbance but not the condensations, we cannot derive the absolute intensities for the features of the NIST experimental spectra. Therefore, we just scale the intensity of the NIST spectra with an appropriate factor to match our calculated spectra. Figure 7 shows that for Ben2H, the calculation is in good agreement with the NIST experimental spectrum in the range of 2700–3300. In the range of 500–1500, a smaller scaling factor would lead to a better match. For Ben4H and Ben6H, the current scaling factor for frequencies already gives a satisfactory agreement with the experiment.
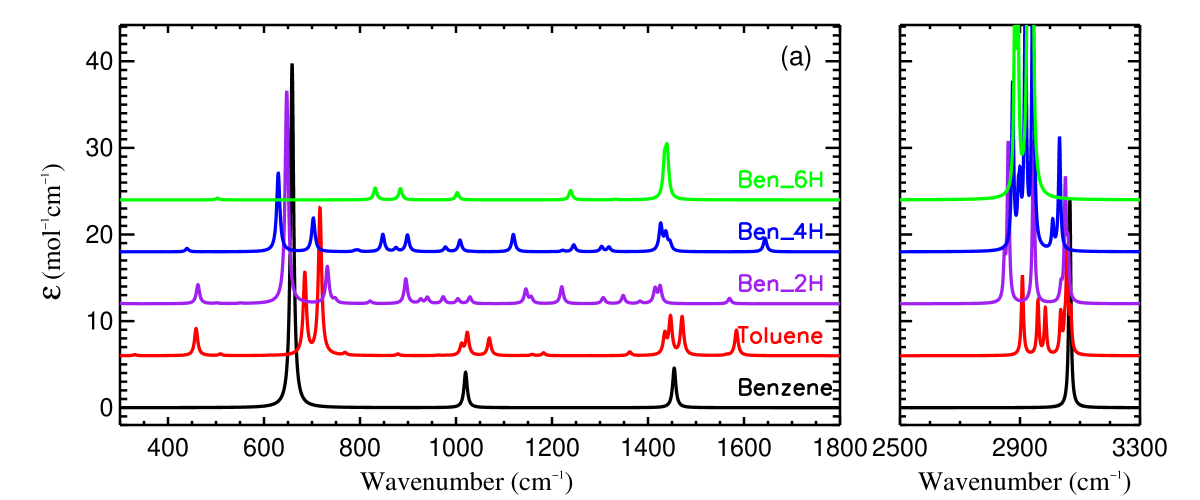
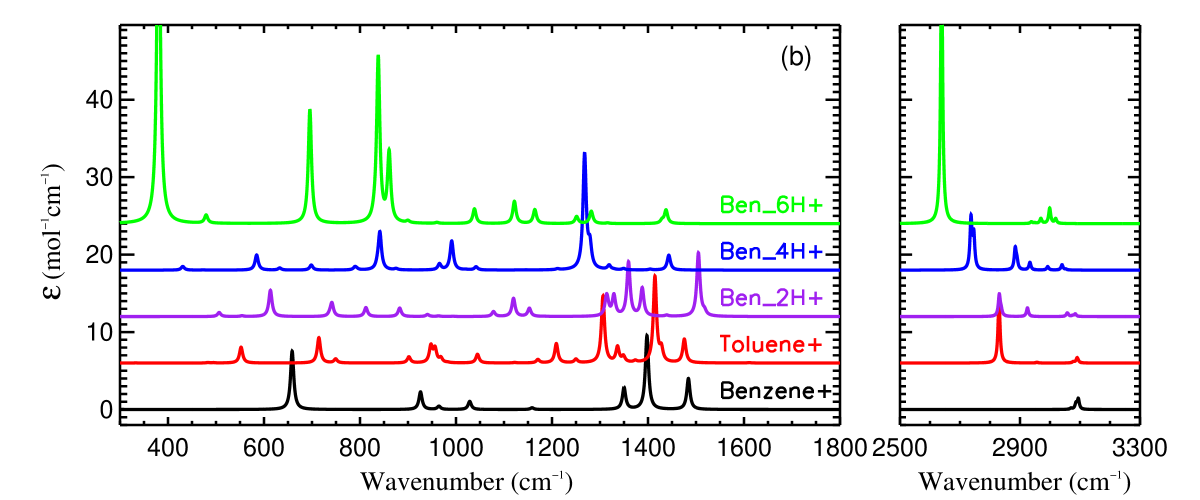
The upper panel of Figure 8 shows the spectra of neutral benzene, toluene (i.e., methyl-benzene) and all the hydrogenated sepcies of benzene. It is quite clear that with the presence of aliphatic C–H bonds, the 3.4 feature (at 2900) arising from the aliphatic C–H stretch shows up.333For benzene, all the C atoms are aromatic, while for Ben6H, all the C atoms are aliphatic. Meanwhile, all the benzene derivatives except benzene also exhibit a feature at 450–500 which arises from the out-of-plane bending of aliphatic C–H. The aromatic C–C stretch at 6.8 (around 1470) of benzene becomes weaker in toluene, Ben2H and Ben4H, and is absent in Ben6H in which all the C atoms are aliphatic.
The lower panel of Figure 8 shows the spectra of the cations of benzene and its hydrogenated derivatives as well as toluene. It is apparent that highly hydrogenated cations exhibit several strong features that are not seen in their neutral counterparts. For Ben4H+, a feature at 1300 originating from the aliphatic C–H out-of-plane bending is quite prominent. Ben6H+ shows strong features at 380 from the aliphatic C–C stretch, at 700 from the aliphatic C–H out-of-plane bending, and at 840 from the aliphatic C–H in-plane bending. Furthermore, the aliphatic C–H stretch features of cations occur at longer wavelengths with respect to the neutrals, especially for Ben6H+. Moreover, all the C–H stretch features are significantly suppressed for cations, while their features in the range of 1200–1600 are significantly enhanced.
The calculated intensities for the major aliphatic vibrational modes as well as the 3.3 and 6.2 aromatic modes are accumulated in Table 2. Unless otherwise noted, , the band strength or intensity of the 3.4 aliphatic C–H stretch, and , the band strength of the 6.85 aliphatic C–H deformation, are given on a per aliphatic C–H bond basis all through this paper. While , the band strength of the 3.3 aromatic C–H stretch is given on a per aromatic C–H bond basis, , the band strength of the 6.2 C–C stretch, is given on a per aromatic C atom basis. The mean intensity for each feature obtained by averaging over all the hydrogenated derivatives of benzene (i.e., Ben2H+, Ben4H+, and Ben6H+) is also tabulated in Table 2.
3.2 Naphthalene Derivatives
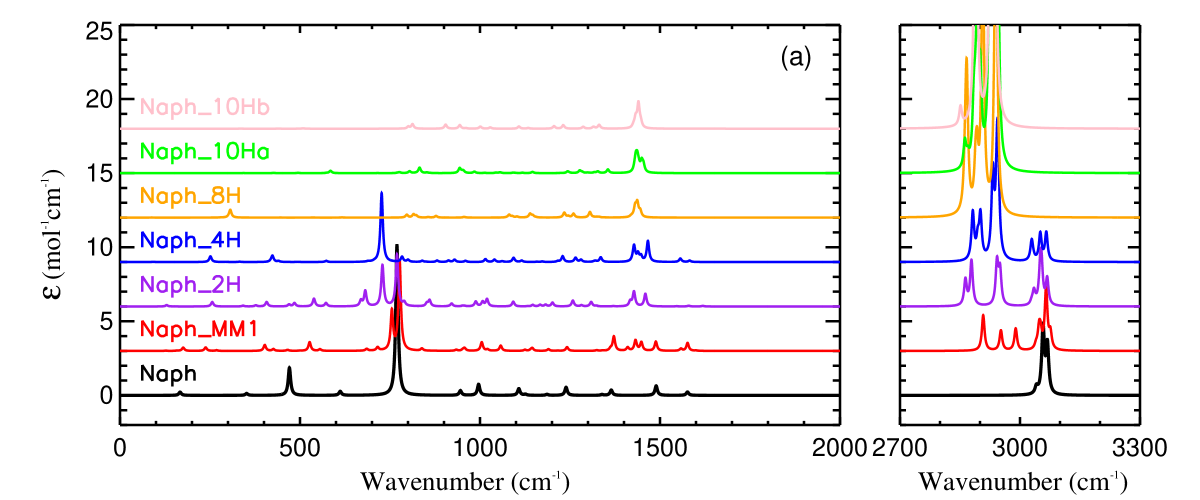
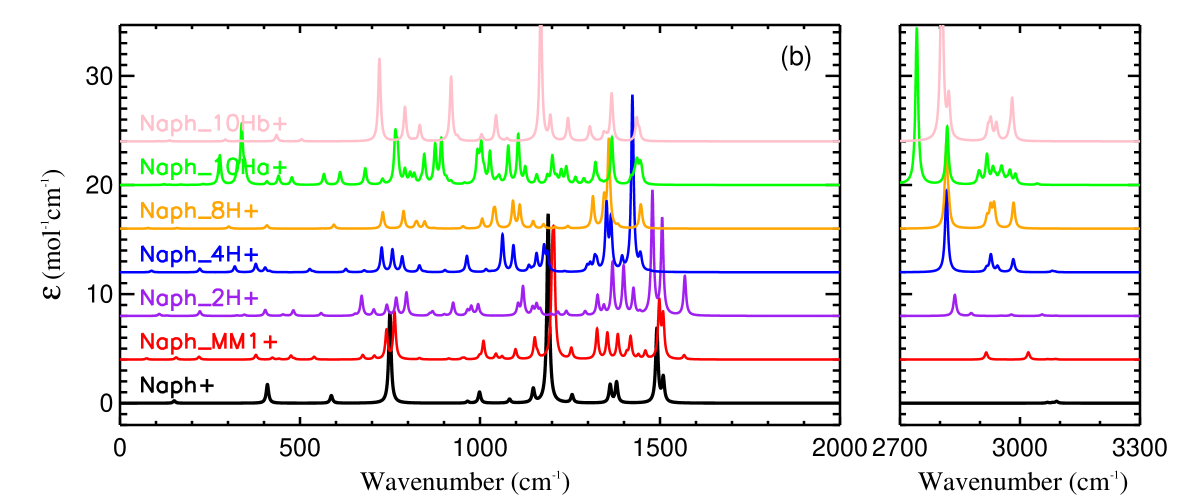
We then consider PAH molecules with two benzene rings, i.e., naphthalene and its hydrogenated derivatives. For this group, we calculate the vibrational spectra of five molecules (see Figure 2). The vibrational spectra of these molecules, marked as “Series A” in Sandford et al. (2013), were experimentally obtained by Sandford et al. (2013). This allows us to confront our computational spectra with the experimental spectra. The computed total energies and thermochemical parameters are given in Table 3.
The calculated spectra are shown in Figure 9 which clearly shows that for the aliphatic C–H stretch features, the neutrals have much higher intensities and peak at shorter wavelengths with respect to cations. For highly hydrogenated cations, e.g., Naph10H, the aliphatic C–H stretch peaks at 3.5. Meanwhile, the cations have much stronger features at 1300–1500 than the neutrals, just as the benzene derivatives. For methylated naphthalene, as shown in Figure 9, the aliphatic C–H stretch also shows up in the computed spectra, but not as pronounced as hydrogenated naphthalene. Also, compared with hydrogenated naphthalene, the aliphatic C–H stretch of methylated naphthalene occurs at somewhat shorter wavelengths.
The intensities of the major aliphatic vibrational modes for the hydrogenated cations are shown in Table 4. Also tabulated are the mean intensities of individual features obtained by averaging over all five hydrogenated cations. For c-PHN (i.e., Naph10Ha; see Figure 2) and t-PHN (i.e., Naph10Hb; see Figure 2), they are fully hydrogenated and thus have no aromatic features.444The fully hydrogenated species c-PHN and t-PHN are isomers. For c-PHN, the hydrogen atoms attached to the two carbon atoms at the junction of the two benzene rings are on the same side of the PAH plane, while for t-PHN the hydrogen atoms are on the opposite side. They are both fully hydrogenated and thus have no aromatic features. For OHN (i.e., Naph8H; see Figure 2), although it is not fully hydrogenated, it has no H attached to aromatic C atoms and thus the 3.3 aromatic C–H stretch is also absent. The aromatic C–C stretch features are seriously suppressed and essentially have negligible intensities for both neutrals and cations.
3.3 Perylene Derivatives
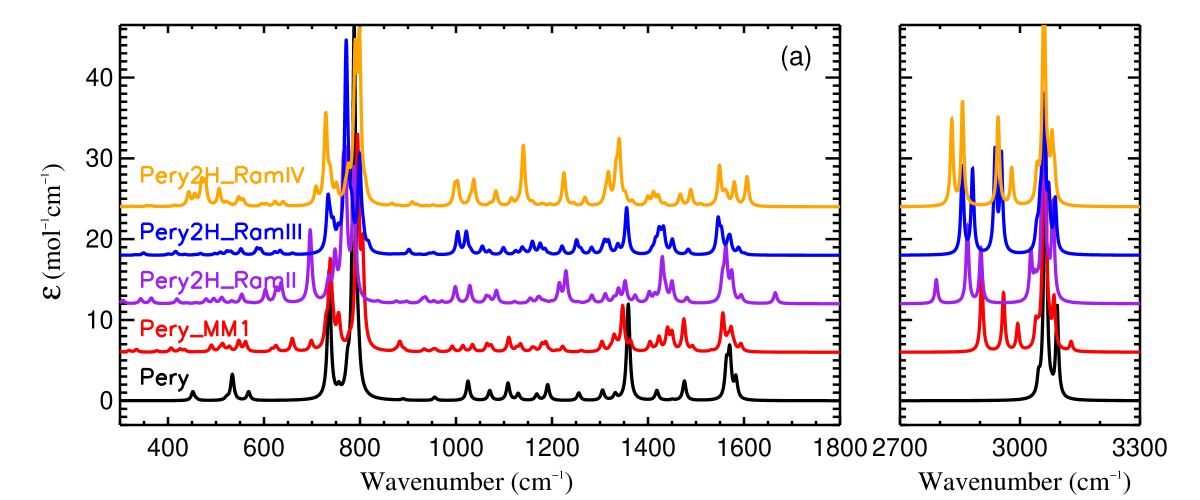
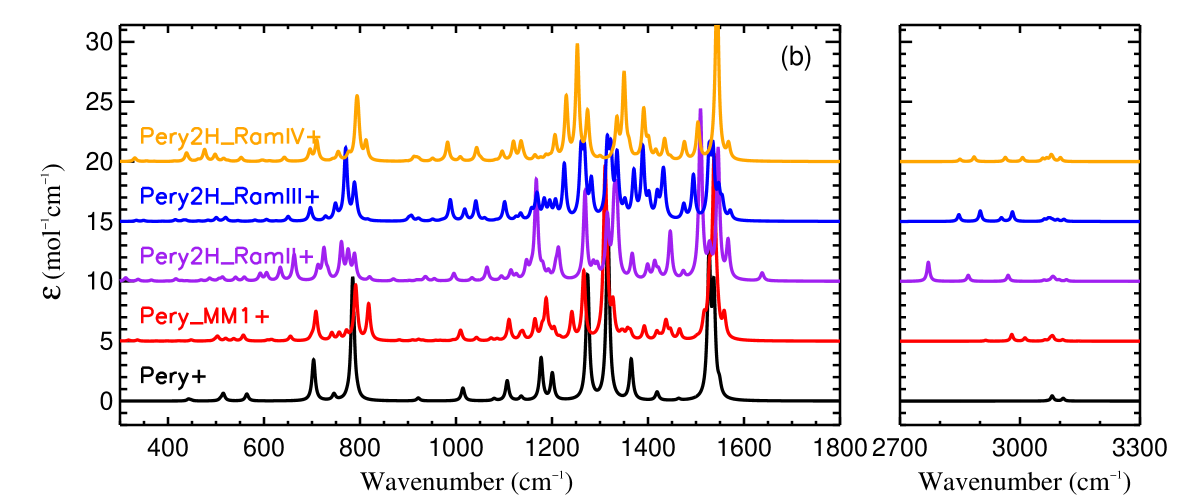
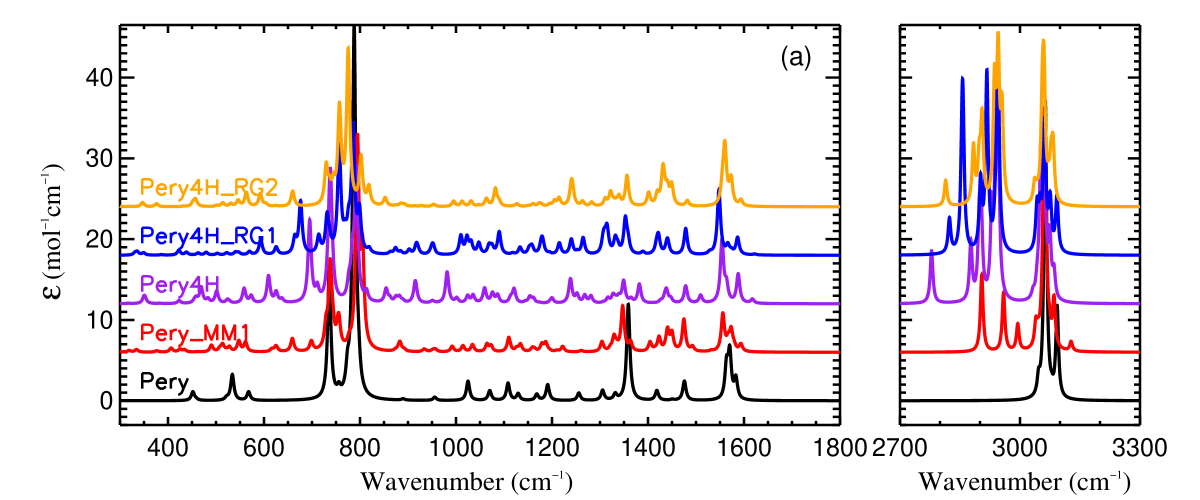
A larger PAH molecule, perylene (C20H12), which has as many edge C atoms as possible to be hydrogenated for PAHs of five six-membered rings, is selected as our next sample. A series of extra H atoms has been considered, from two all the way up to 14 which corresponds to a complete hydrogenation of all the edge C atoms. For each situation, we consider several isomers of which the extra H atoms are attached at different positions. Table 5 present the computed total energies and thermochemical parameters for the neutrals and cations, respectively.
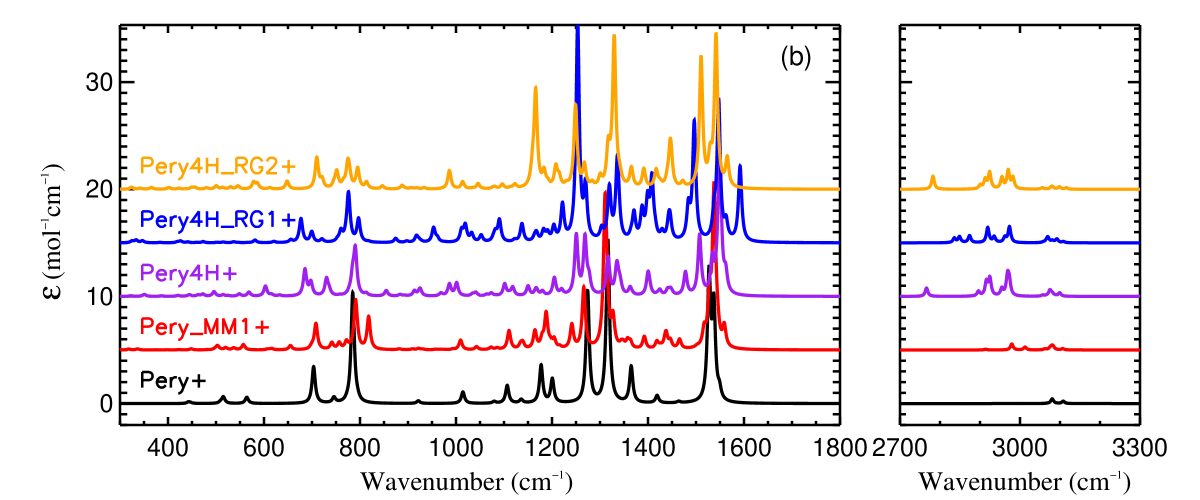
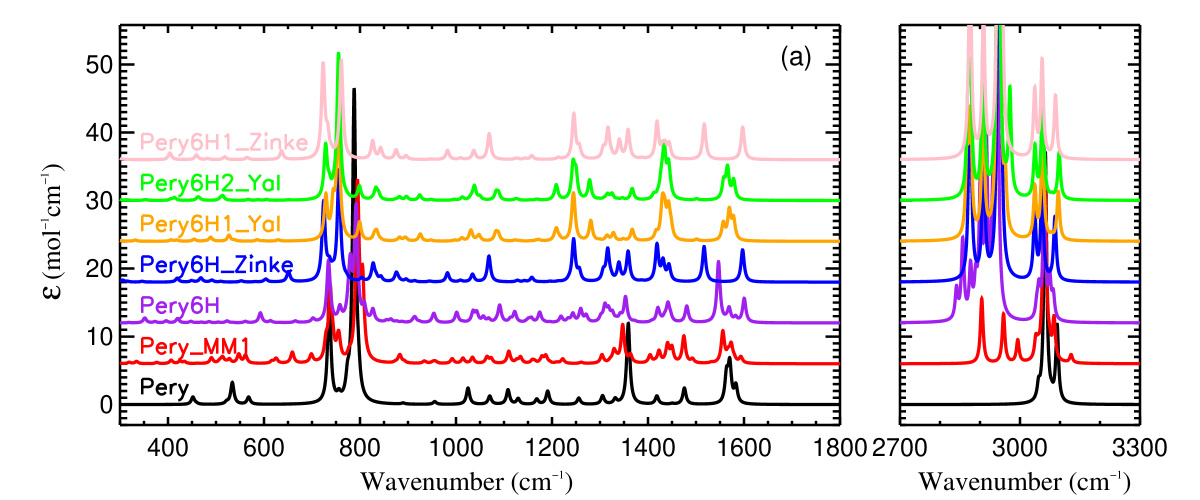
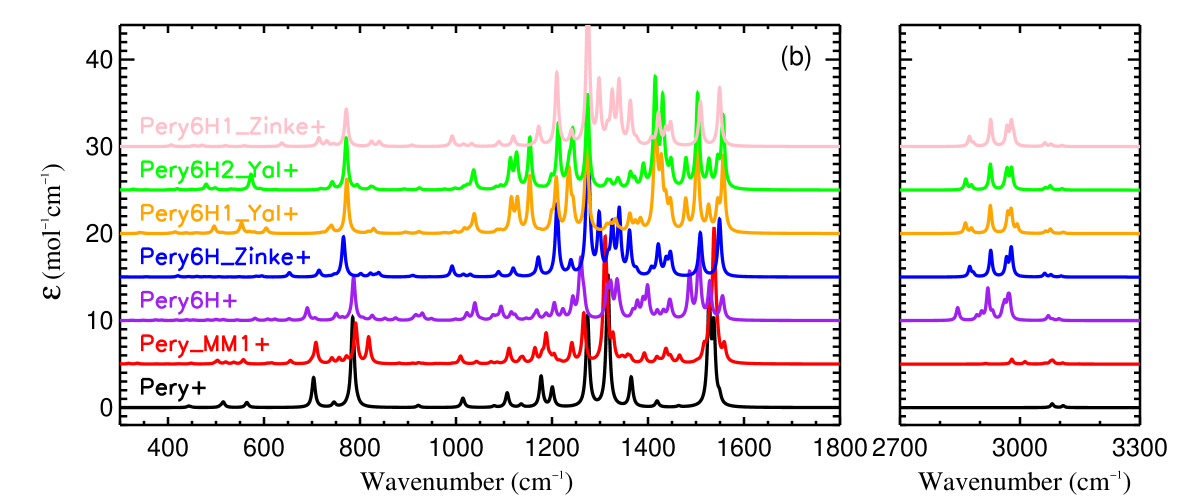
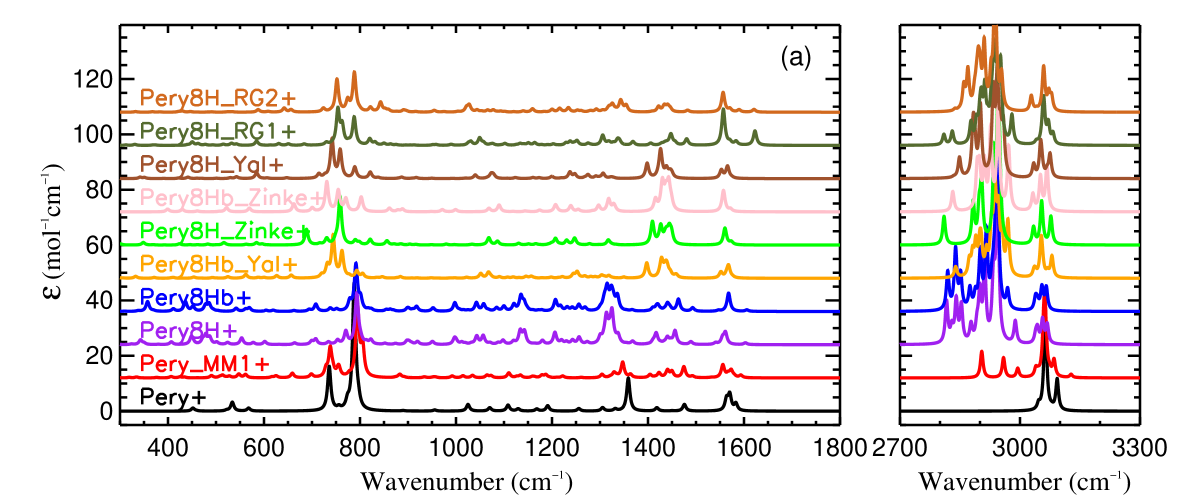
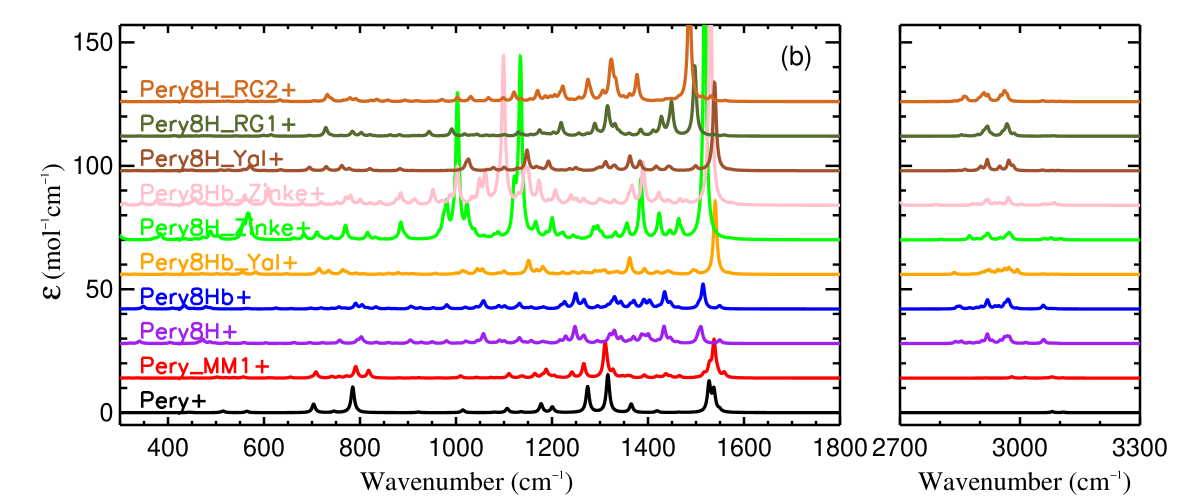
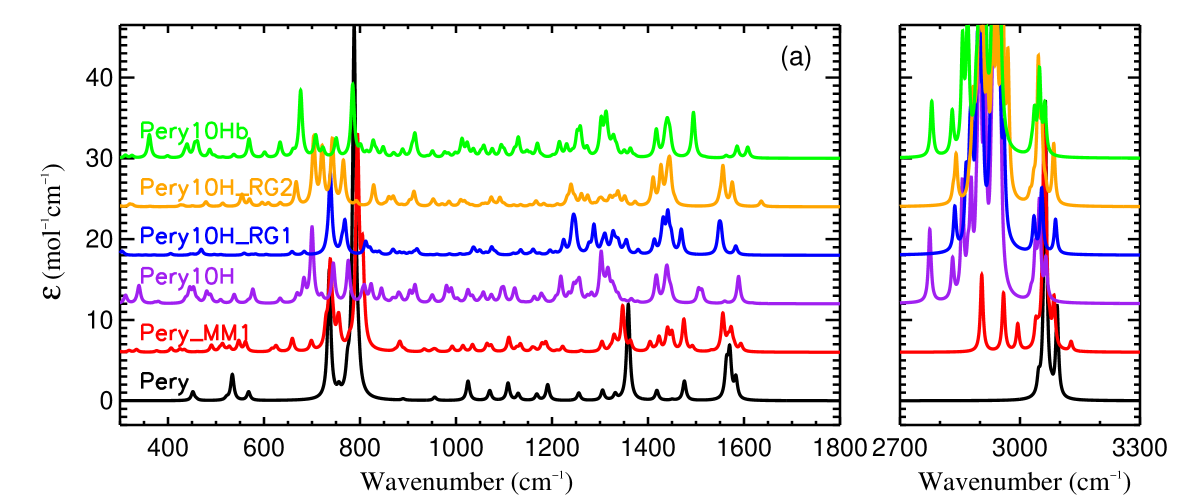
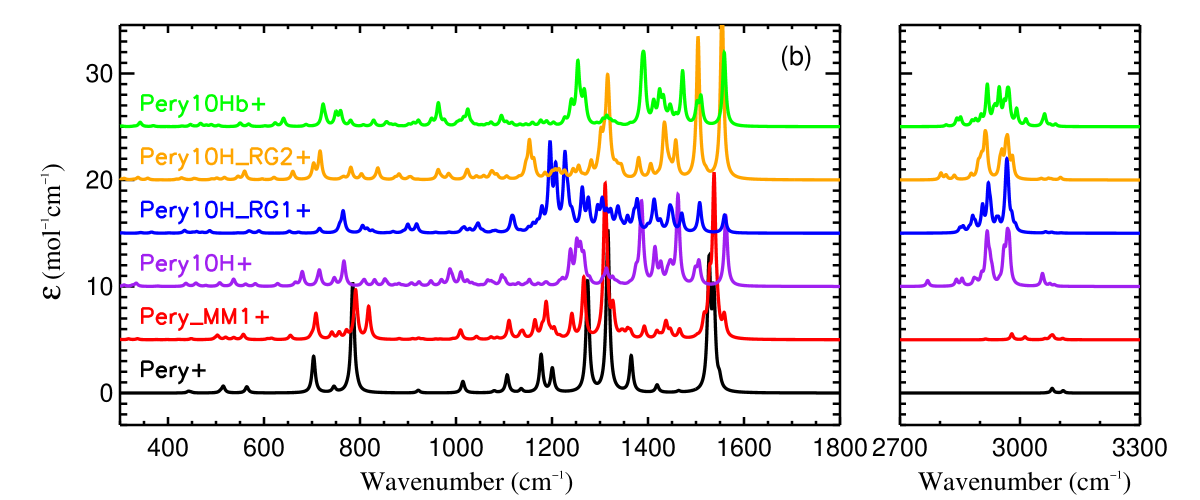
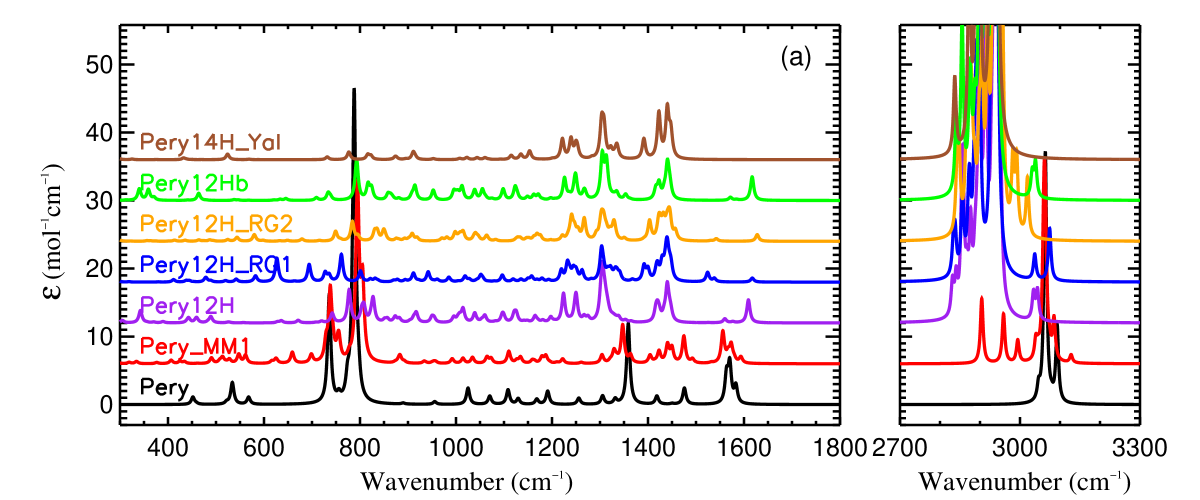
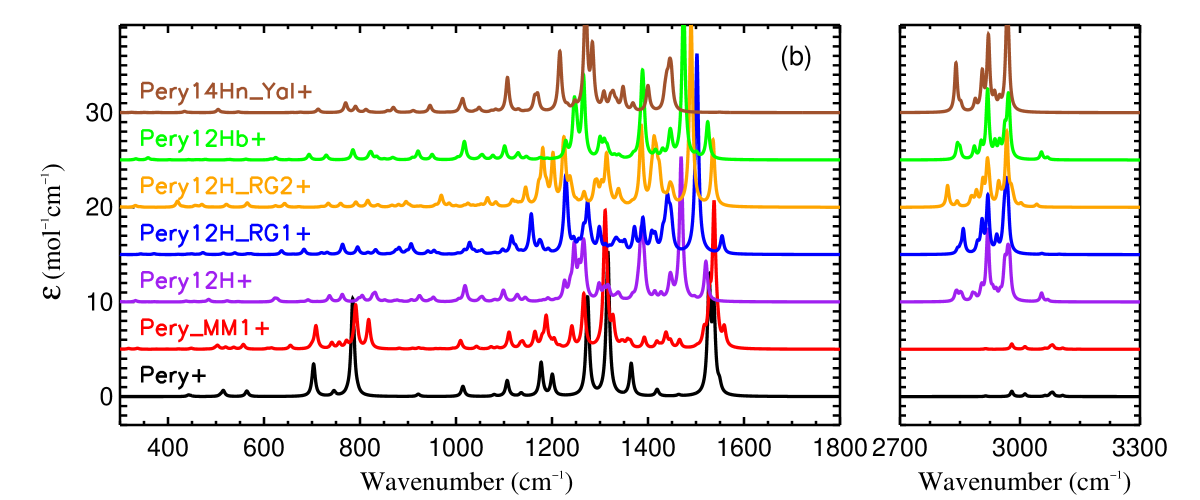
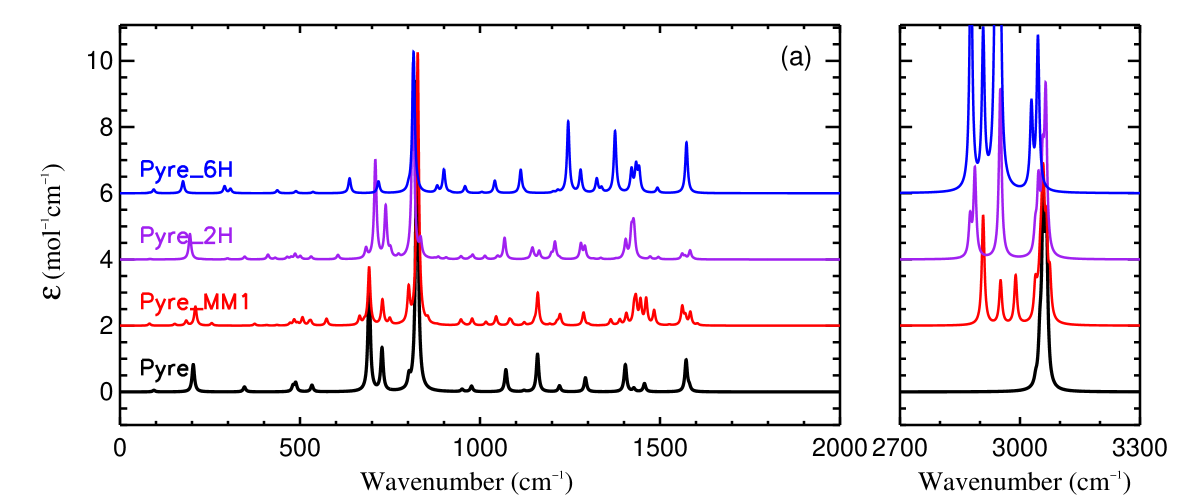
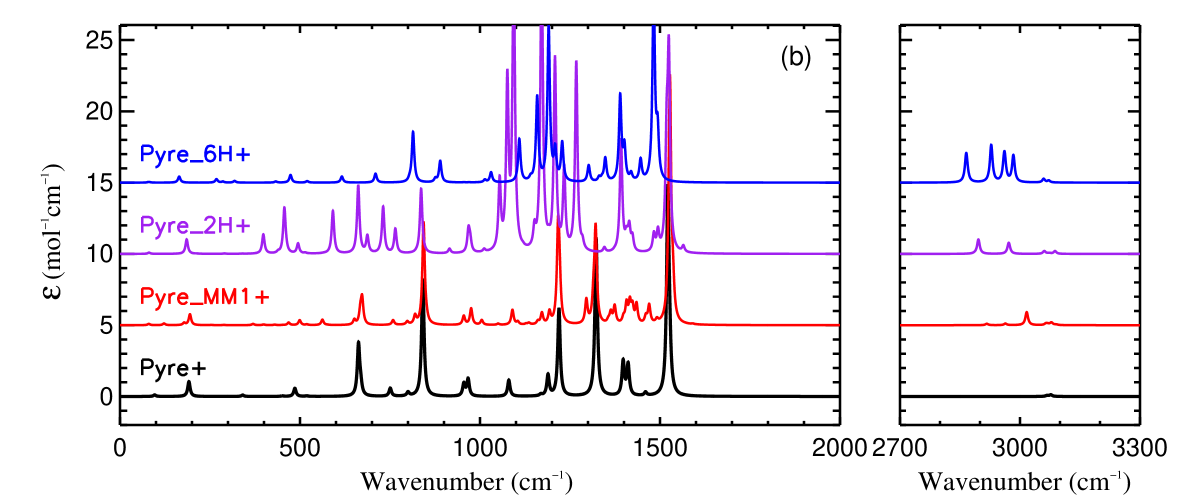
We show in Figure 10 the calculated spectra for each hydrogenation along with that of perylene and methyl-perylene.555For Pery14H, only one isomer is calculated, so its spectrum is shown with the Pery12H isomers in Figure 10. In all these figures, the neutrals are displayed in the upper panels, and the cations in the lower ones. For the neutrals, the spectra do not seem to exhibit significant differences among different isomers. Again, the most prominent aliphatic feature is the aliphatic C–H stretch at 3.4 for all the neutrals which becomes stronger with the degree of hydrogenations and shows a strong peak around 2950 accompanied by a series of satellite features at longer wavelengths. As the number of extra H atoms increases, the aromatic features becomes weaker as expected, and intend to shift to the red side, especially for heavy hydrogenations (e.g., superhydrogenated perylene with eight or more extra H atoms). On the other hand, the aliphatic C–H deformation bands at 6.85 (1470) and 7.45 (1310) become stronger as the hydrogenation increases. Moreover, the aliphatic C–H stretch of methyl-perylene appears to occur at a shorter wavelength than perylene. Compared with that of the neutral molecules, both the 3.3 aromatic and 3.4 aliphatic C–H stretch features are significantly suppressed for all the cations, while the cationic C–C stretch and C–H bending bands at 1200–1600 are considerably enhanced. This is similar to benzene and naphthalene and their derivatives. Unfortunately, we cannot compare these computed spectra with the experimental spectra since, to our knowledge, there are no experimental data available for the perylene derivatives.
3.4 The Sandford et al. (2013) Molecules
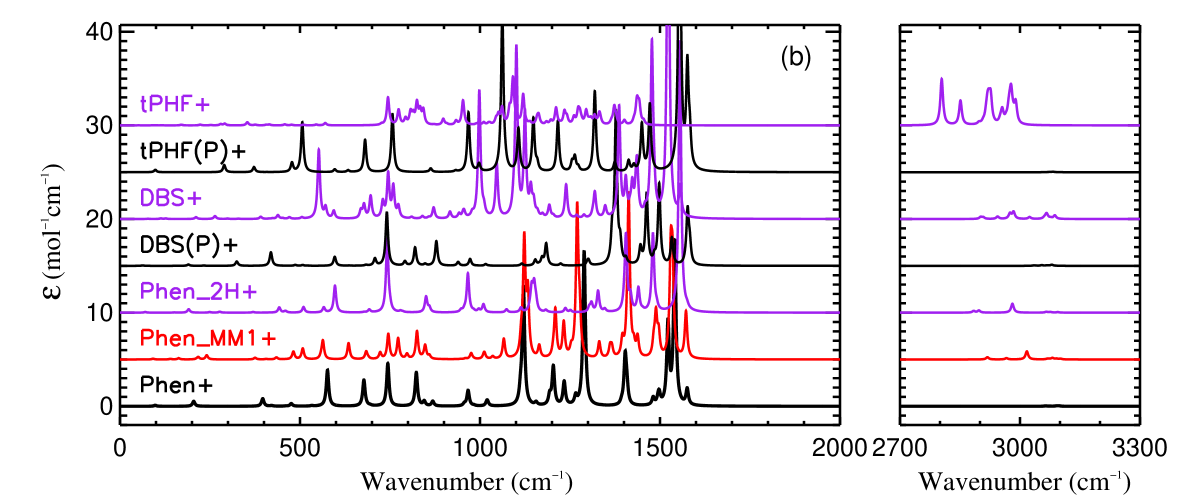
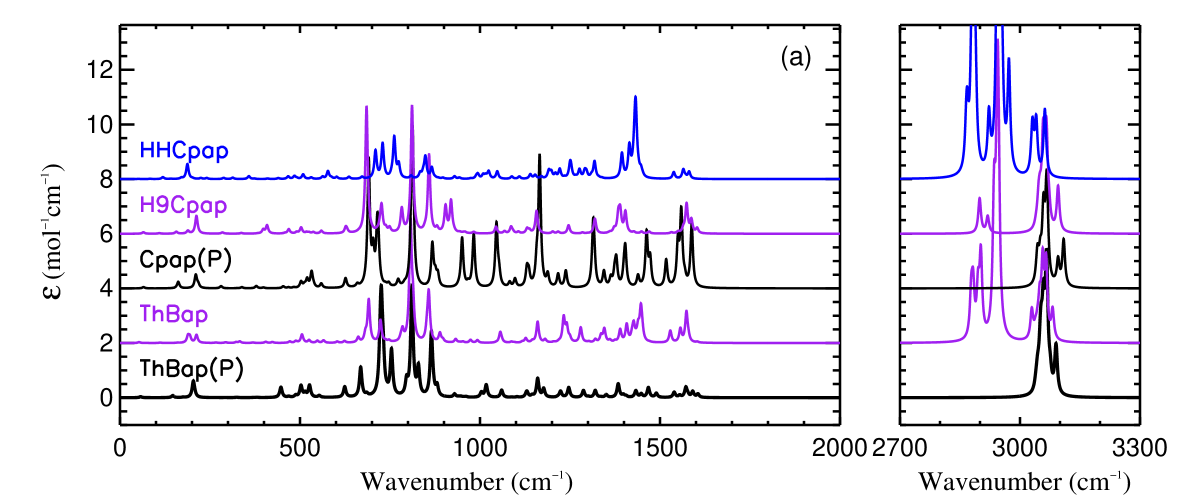
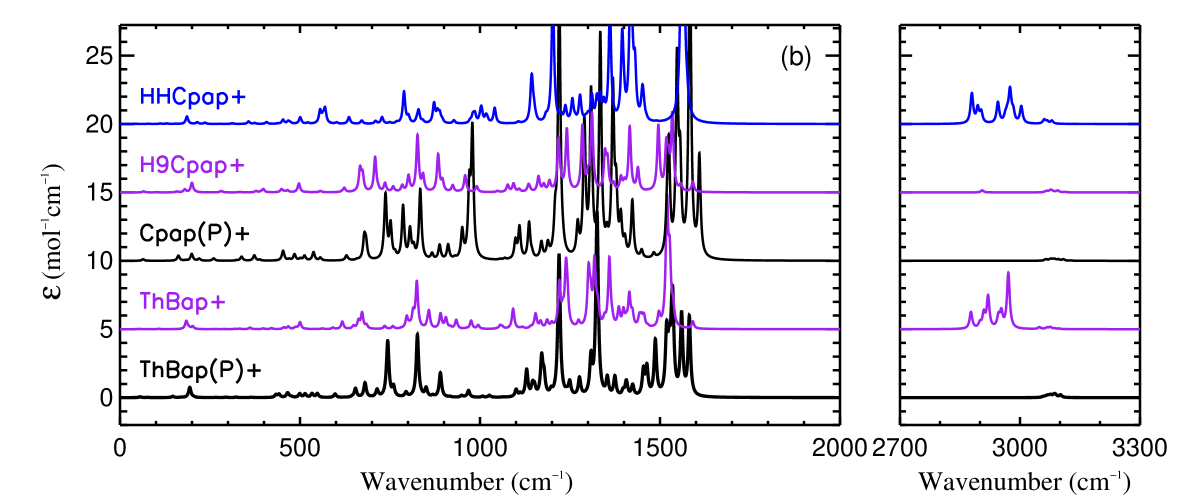
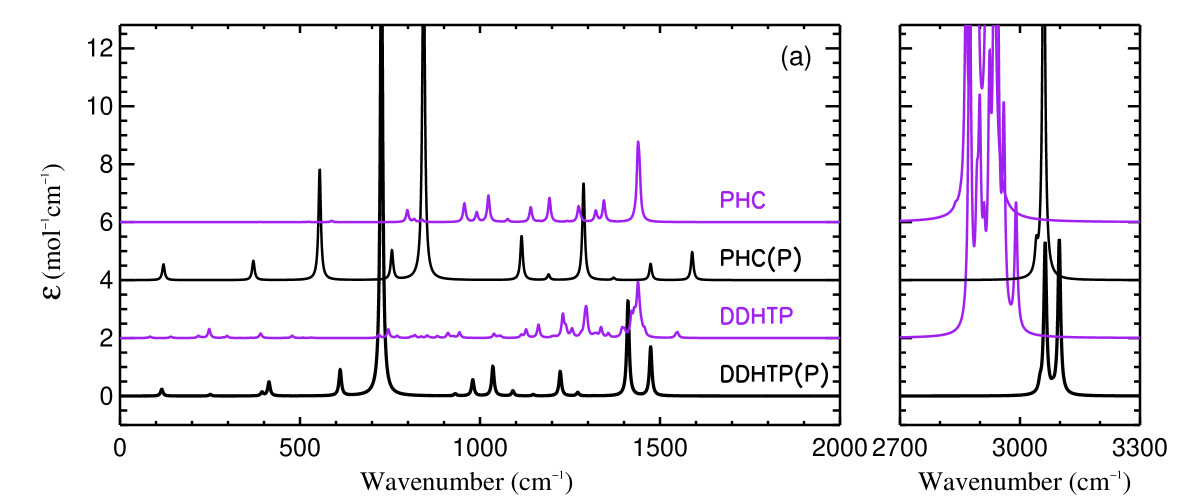
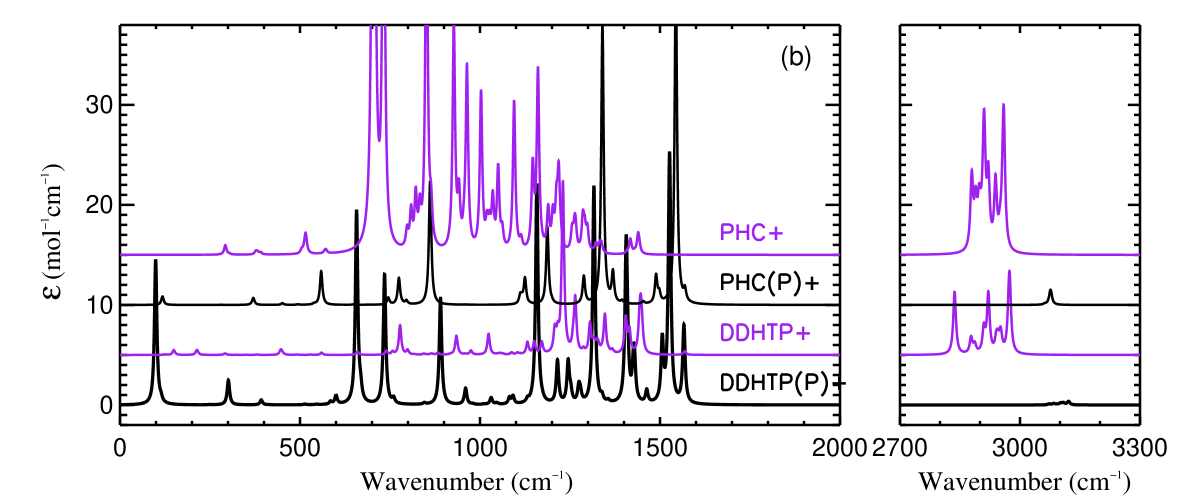
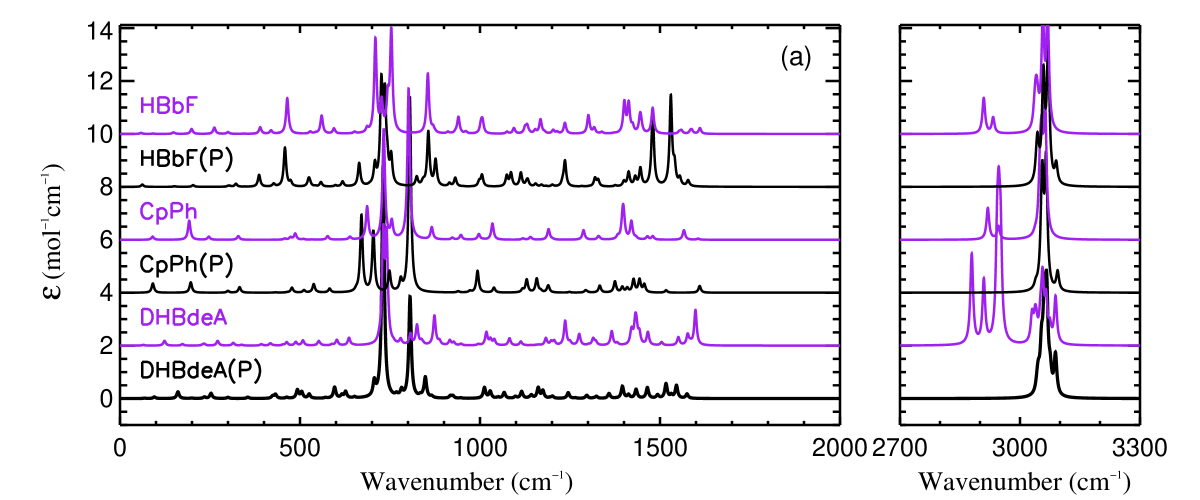
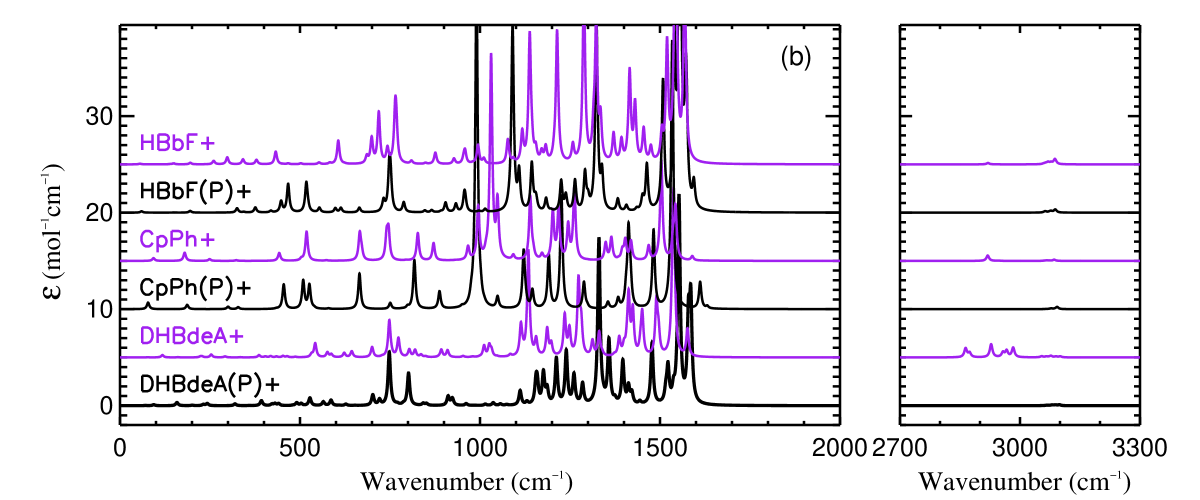
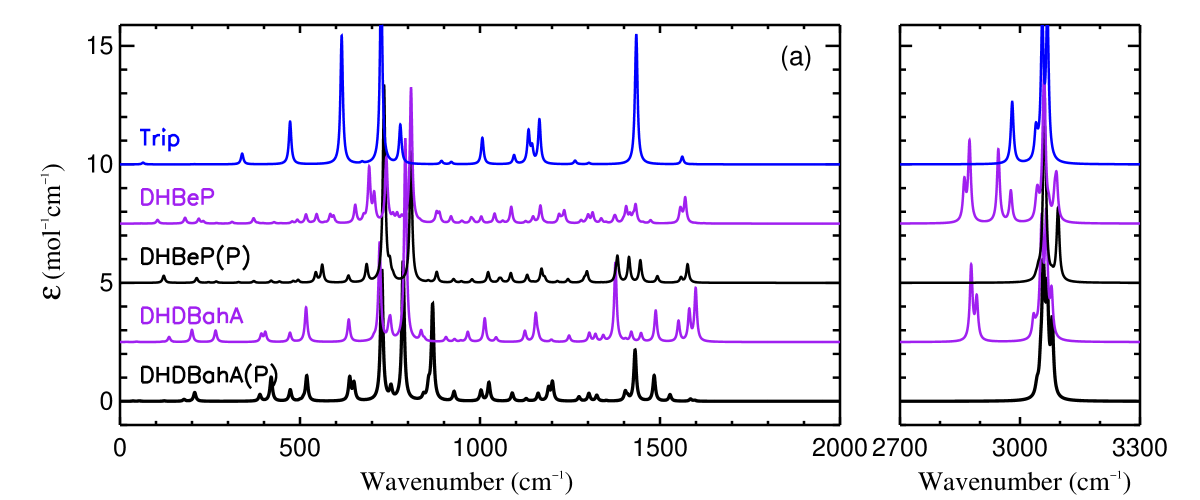
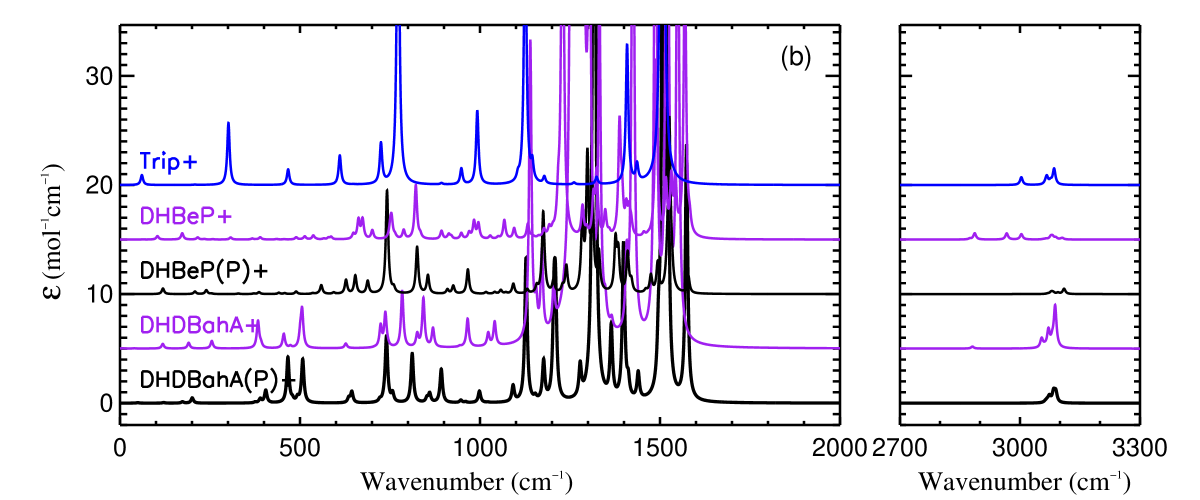
Sandford et al. (2013) obtained the 2.5–20 (i.e., 500–4000) absorption spectra of 23 hydrogenated PAHs and related molecules isolated in the argon matrix at 15. We now consider all the hydrogenated PAH species experimentally studied by Sandford et al. (2013) except the derivatives of naphthalene, i.e., Series B to Series H as marked by Sandford et al. (2013), which have already been discussed in detail in §3.2. To highlight the vibrational features originated from the addition of extra H atoms, we also calculate the vibrational spectra of the parental molecules, e.g., the parental molecule of the Series B molecules of Sandford et al. (2013) is anthracene (C14H10). Again, we consider both neutrals and cations and tabulate in Table 7 the computed total energies and thermochemical parameters for these molecules.
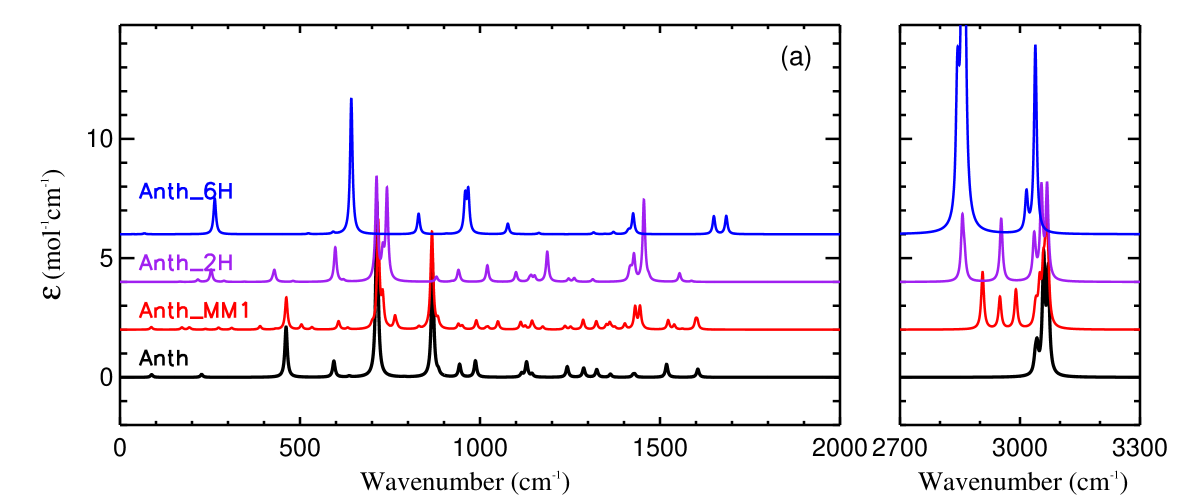
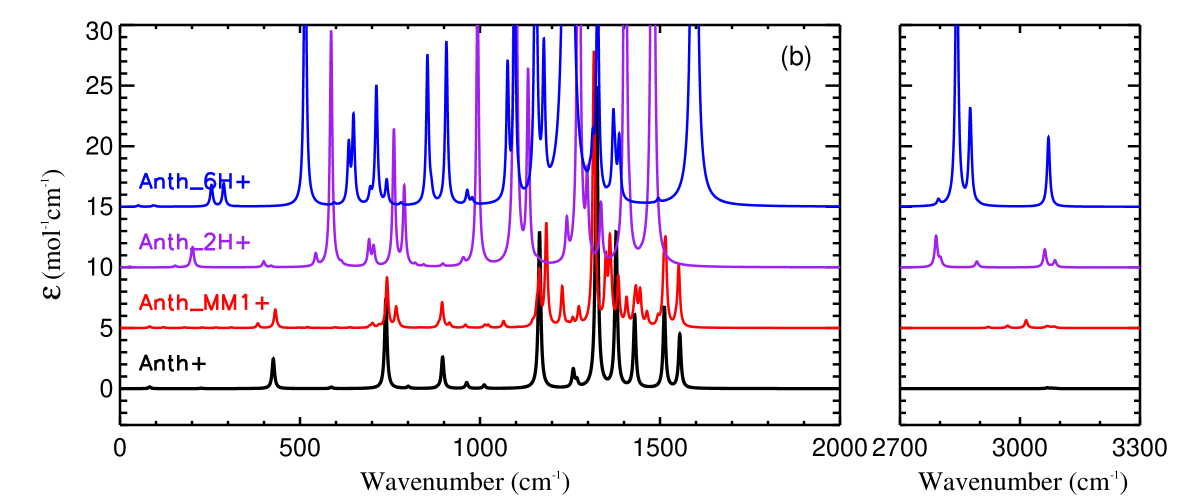
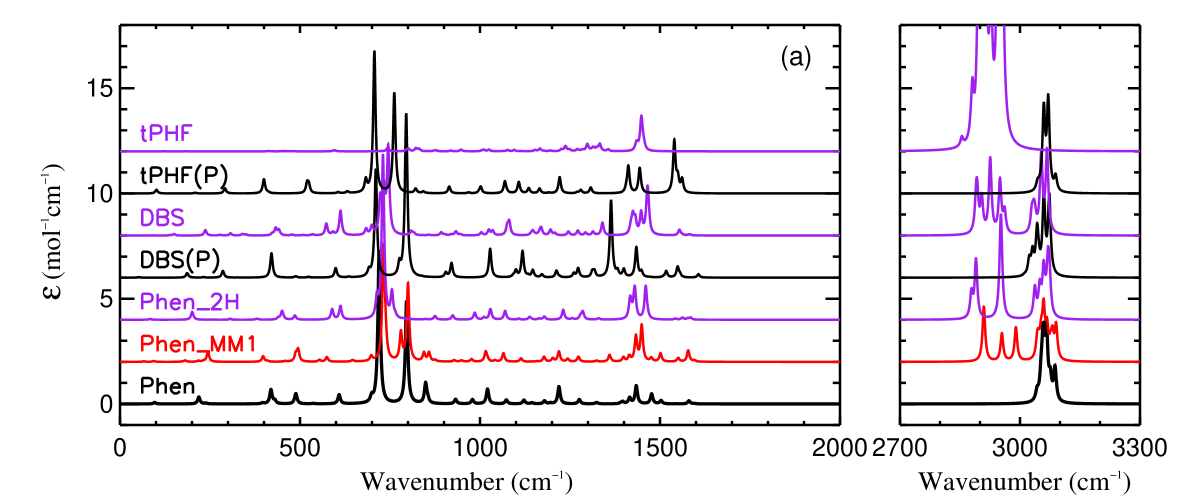
In Figure 16 we present the calculated spectra, with each subfigure for one group of which the molecules share the same parent (e.g., the 1st subfigure is for the derivatives of anthracene, and the 2nd subfigure is for the derivatives of phenanthrene). Again, we also show in each figure the spectra computed for the mono-methylated molecules. It is apparent that, as shown in the upper panel of each figure, all hydrogenated neutral molecules exhibit the aliphatic C–H stretching feature around 3.4. This feature is also seen in methylated neutral molecules but at a slightly shorter wavelength. The aliphatic C–H deformation feature at 6.85 is also prominent in the spectra of all the molecules in the range of 1400–1450. However, the 7.25 aliphatic C–H deformation feature at 1350–1400 is much less pronounced. In Table 8 we present the intensities of the 3.4 and 6.85 aliphatic C–H bands as well as the 3.3 and 6.2 aromatic bands. Also tabulated are the corresponding aliphatic-to-aromatic intensity ratios and . Similarly, we show in the lower panel of each figure the spectra of the cationic counterparts of those presented in the upper panel. Clearly, the C–H stretch at 3.4 is considerably reduced while the C–C stretching and C–H bending features in 1200–1600 are remarkably enhanced. The intensities of the 3.3, 3.4, 6.2 and 6.85 bands calculated for the cationic species are also tabulated in Table 8. For both neutrals and cations, we also derive the mean intensity for each band by averaging over all the derivatives (see Table 8).
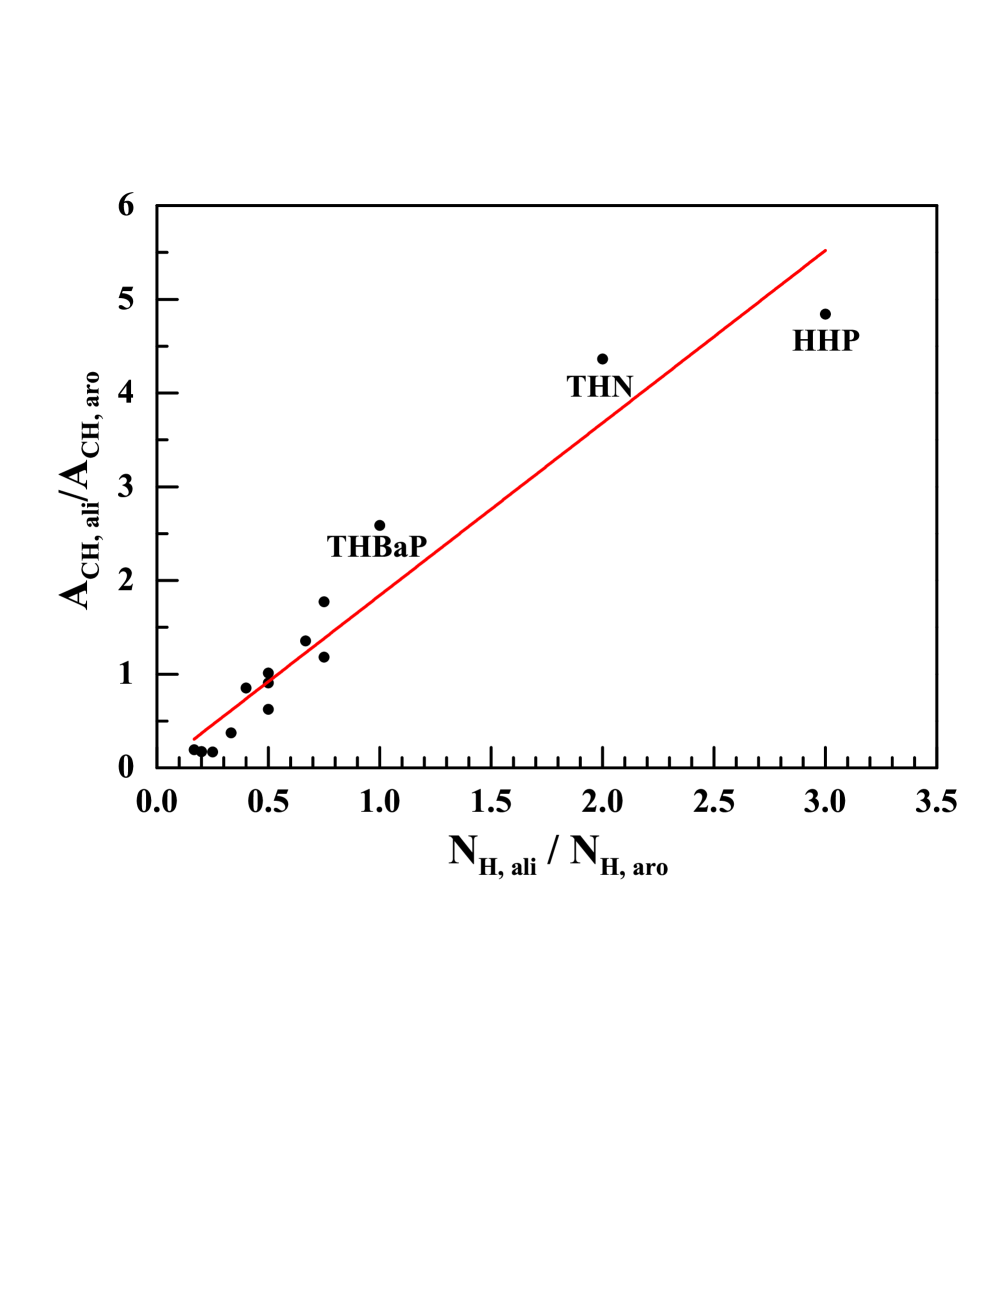
In Figure 23 we show as a function of , where is the intensity of the 3.4 aliphatic C–H stretch of a given molecule, is the intensity of the 3.3 aromatic C–H stretch of the given molecule, and and are respectively the total number of aliphatic and aromatic C–H bonds of the given molecule. The slope of the line fit to the data in Figure 23 is , which is lower than that of Sandford et al. (2013) by 33%. This difference appears to be mainly caused by heavily hydrogenated species HHP (Pyre-6H, C16H16) and THB[a]P (C20H16), and slightly hydrogenated species 9H-Cp[a]P (C19H12) and 11HB[b]F (C17H12). The difference would be reduced to within 10% if these species are excluded. Compared with the spectra of Sandford et al. (2013) obtained from the matrix isolation spectroscopy, the intensity ratios computed here for HHP and THB[a]P are appreciably lower. As illustrated in Figure 6, the computed spectra for both molecules are in close agreement with the experimental spectra of Sandford et al. (2013), except that the experimental spectra exhibit an extra feature at 2840. This would raise and therefore result in a larger slope for the experimental data. Moreover, Pauzat & Ellinger (2001) performed DFT calculations on hydrogenated naphthalene, anthracene, and pyrene and obtained , which is close to that derived here.
Maltseva et al. (2018) applied advanced laser spectroscopic techniques combined with mass spectrometry to obtain the gas-phase absorption spectra of four supersonically cooled superhydrogenated PAH species in the 3.175–3.636 wavelength region, including slightly hydrogenated DHA and DHPh (see Figure 4) and heavily hydrogenated THN (see Figure 2) and HHP (see Figure 4). They obtained a slope of which is closer to that derived here but considerably lower than that of Sandford et al. (2013).666Maltseva et al. (2018) also obtained the experimental spectra of methylated PAHs in the C–H stretch wavelength region. The aliphatic to aromatic C–H stretch band ratio of methylated PAHs experimentally derived by Maltseva et al. (2018) is close to that determined from quantum-chemical computations (see Yang et al. 2013, 2016b). Maltseva et al. (2018) argued that the difference might be traced back to the influence of the environment on band intensities. It is known that the incorporation of PAHs into rare gas matrices could cause a suppression on the intensities of the vibrational bands compared to that of isolated molecules (Joblin et al. 1994). Maltseva et al. (2018) speculated that it is possible that aromatic C–H stretch bands might be suppressed to a larger extent under rare gas matrix conditions than aliphatic C–H stretch bands. However, as shown in Figure 6, the relative strengths of the aliphatic and aromatic C–H stretches of HHP and THB[a]P of Sandford et al. (2013) measured with the matrix isolation spectroscopy method agree closely with that computed here, except that the experimental spectra show an extra feature at 2840 which is not seen in the computed spectra.
In future work, a more precise assignment of the experimental and computational spectral bands of hydrogenated PAHs and accurate intensity scaling would be necessary for accurately determining their band strengths. Based on what are presently available, we argue that the relative band strengths derived here are generally reliable.
4 Astrophysical Implications
4.1 Average Spectra
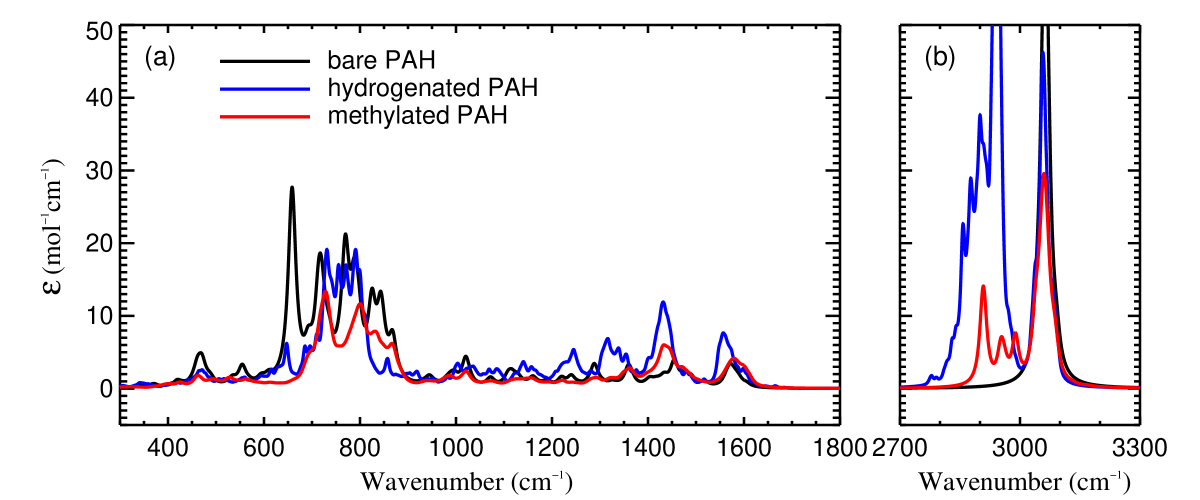
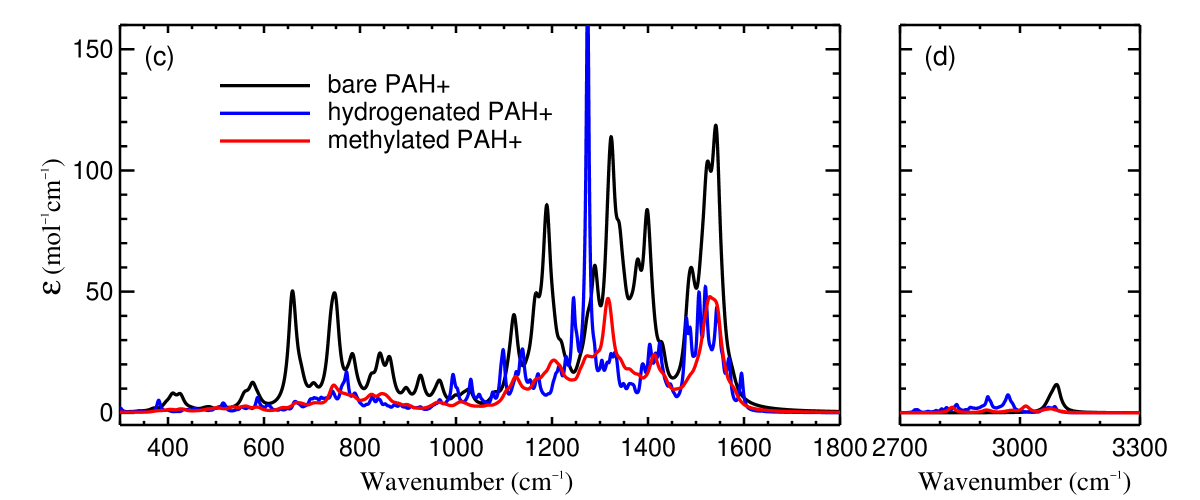
To highlight the features originated from hydrogenation, we obtain the mean spectra of hydrogenated PAHs, methylated PAHs and their bare parental compounds as well as their cationic counterparts (see Figure 24). The mean spectra of hydrogenated PAHs are derived by averaging the computed spectra, on a per aliphatic C–H bond basis, over all the hydrogenated species shown in Figures 1–4, including hydrogenated benzenes, hydrogenated naphthalenes, hydrogenated perylenes, and the hydrogenated molecules of Sandford et al. (2013). For methylated PAHs, we average over all the molecules listed in Figure 2 of Yang et al. (2013). For bare PAHs, we average over benzene, naphthalene, anthracene, phenanthrene, pyrene, perylene and coronene, the parental molecules of the hydrogenated species shown in Figures 1–4. For both bare PAHs and methylated PAHs, their mean spectra are obtained on a per C atom basis.
As shown in Figure 24, the 3.4 feature is clearly seen in the mean spectra of neutral hydrogenated PAHs and of neutral methylated PAHs. Meanwhile, a bump at 1430 (which is close to 6.85) is also seen in neutral hydrogenated and methylated PAHs. For hydrogenated neutral PAHs, the average band strengths (per aliphatic C–H bond) are and (see Table 9). In contrast, neither the 3.4 feature nor the 6.85 feature is seen in the spectra of bare PAHs. The mean spectra of hydrogenated PAH ions and of methylated PAH ions also exhibit the aliphatic C–H stretch at 3.4, but this feature is severely suppressed with respect to neutrals. In comparison, cations have much stronger bands than neutrals at 1200–1600. For hydrogenated PAH ions, the average band strengths (per aliphatic C–H bond) are and (see Table 9). In the following, we shall focus on the 3.4 and 6.85 aliphatic C–H features.
4.2
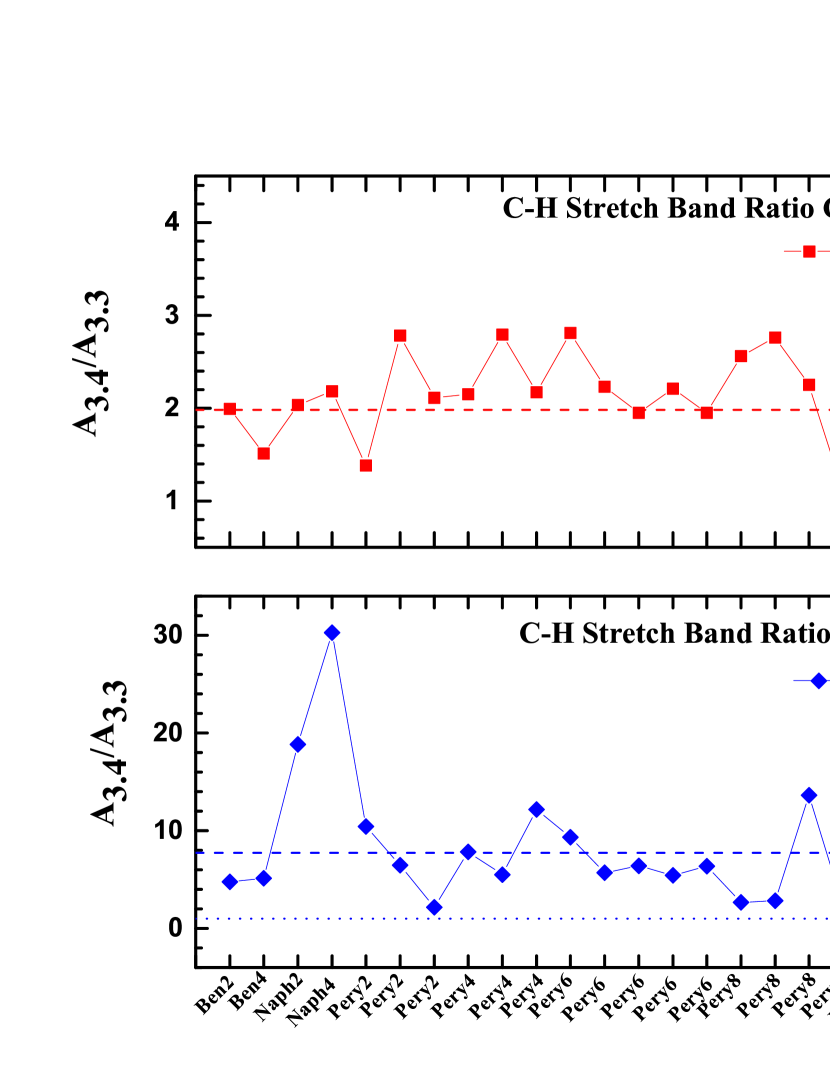
Figure 25 shows , the band-strength ratio of the 3.4 aliphatic C–H stretch to the 3.3 aromatic C–H stretch computed for all the hydrogenated PAHs and their ions listed in Figures 1–4. For neutral hydrogenated PAHs, the band-strength ratios , with an average value of and a standard deviation of 0.60 (see Table 9), do not vary much from one molecule to another. In contrast, varies more appreciably among ions (with and a standard deviation of 6.56; see Table 9), not only for different molecules but also for different isomers of the same molecule. Nevertheless, basically exhibits a low-end of 1.0 for all the cationic hydrogenated PAHs.
4.3
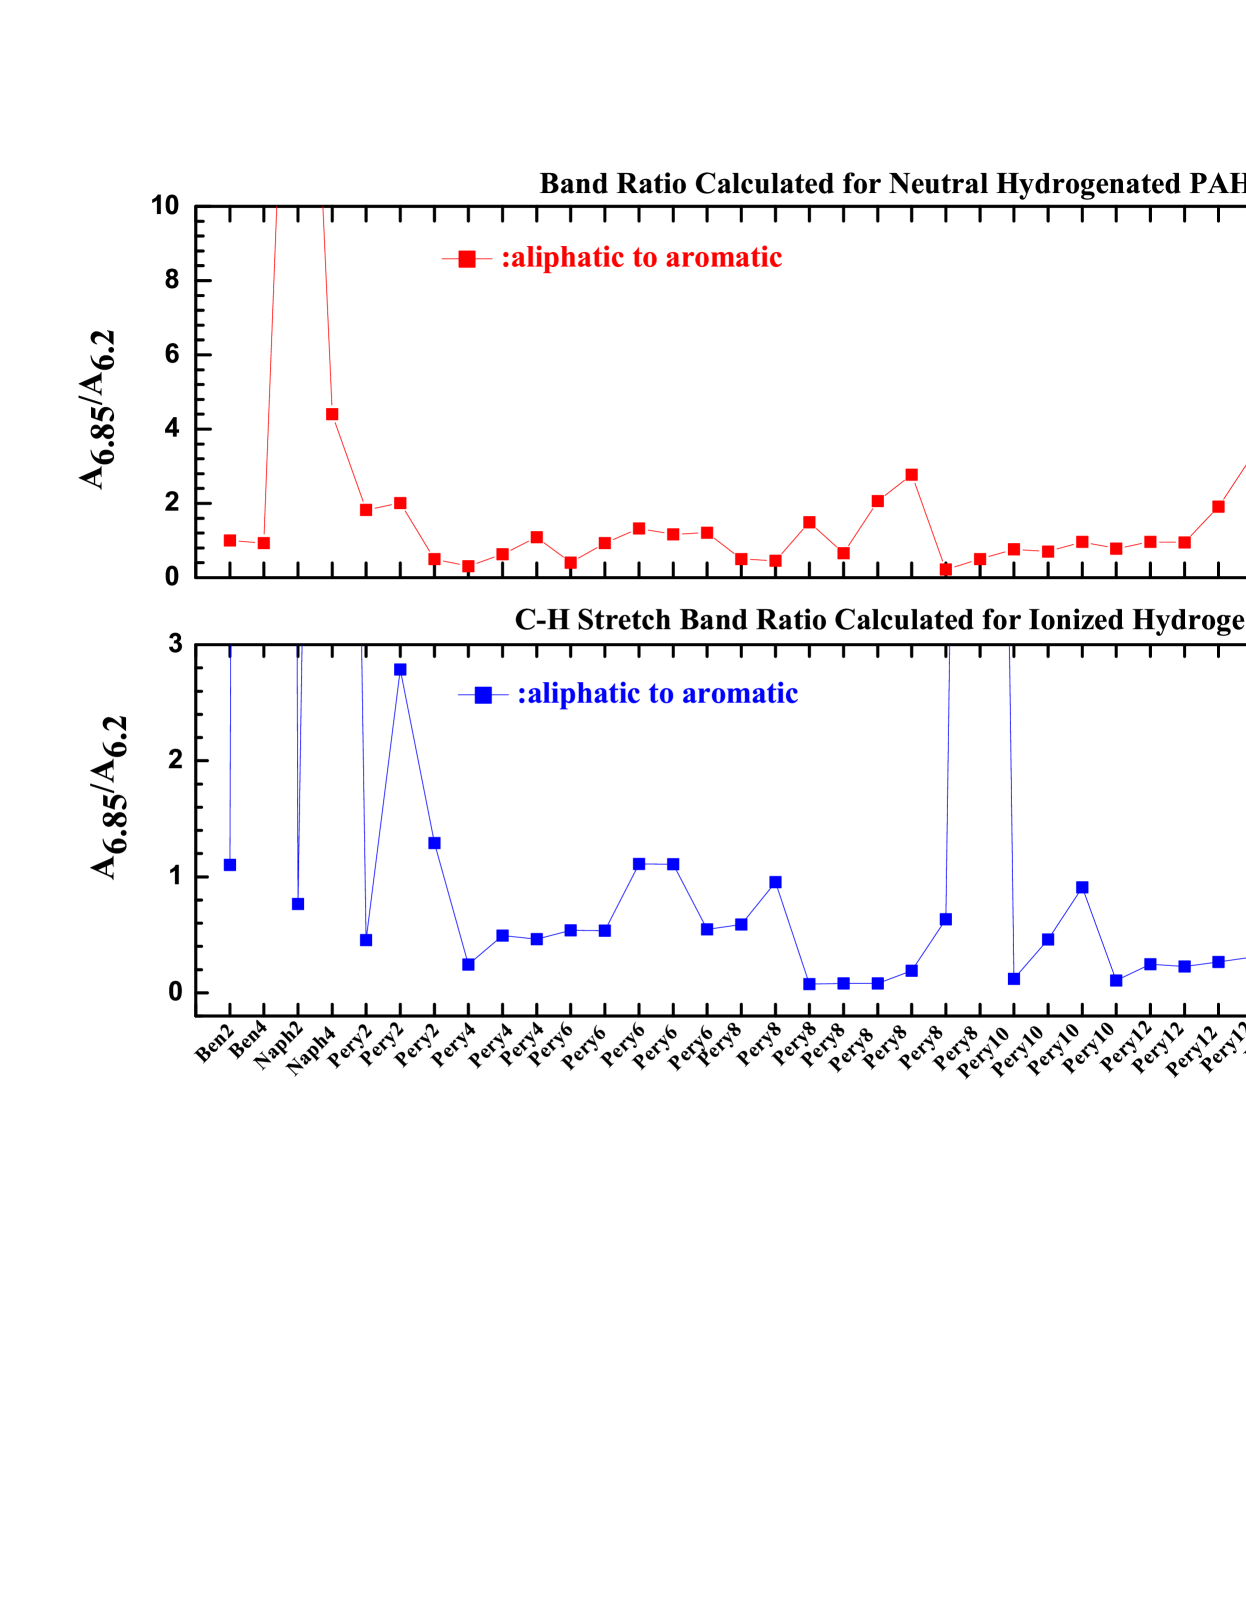
Figure 26 shows , the band-strength ratio of the 6.85 aliphatic C–H deformation to the 6.2 aromatic C–C stretch computed for all the hydrogenated PAHs and their ions listed in Figures 1–4. For the Sandford et al. (2013) molecules, the ratio varies considerably from one molecule to another. Nevertheless, for 70% of the Sandford et al. (2013) molecules does not exceed 5.0. For the hydrogenated derivatives of neutral benzene and perylene, the ratios are generally in the range of 1.0–3.0, with an average value of and a standard deviation of 0.73. For the hydrogenated cations, the ratios are more scattered than their neutral counterparts, ranging from 0.1 to 140. However, does not exceed 1.0 for 82% of the cations. Note that the cations of THN, DHB[de]A, Ben4H, and PeryHRG2 have a much larger ratio than others since their C–C stretch modes are significantly suppressed. Finally, if we exclude those molecules with extreme ratios, we derive and 0.56 for neutrals and cations, respectively, with a standard deviation of 1.23 and 0.50 (see Table 9).
4.4 Degrees of Superhydrogenation
With the computed intrinsic band strength , we can estimate the hydrogenation of the UIE carrier. We first make an assumption that the 3.4 feature comes exclusively from hydrogenated PAHs. This will place an upper limit on the hydrogenation of the UIE carriers since those PAHs with aliphatic sidegroups (e.g., methylated PAHs) and anharmonicity of the aromatic C–H stretch could also contribute to the 3.4 feature, sometimes prominently (see Li & Draine 2012).
Let be the degree of superhydrogenation, where is the number of “superhydrogenated” C atoms and is the number of aromatic C atoms. Let and respectively be the observed intensities of the 3.3 and 3.4 emission features. If we assume that one “superhydrogenated” C atom corresponds to 2 aliphatic C–H bonds777Here we only consider the more normal situation that the extra H is attached to the C atom on the edge of a benzene ring. If the extra H is attached to the C atom in the middle (e.g., the two H atoms shown in the middle of the structure of Naph10Ha, i.e., c-PHN, in Figure 2), one hydrogenated H atom corresponds to one aliphatic C–H bond. and one aromatic C atom corresponds to 3/4 aromatic C–H bonds (intermediate between benzene C6H6 and coronene C24H12), then , i.e., . The degree of superhydrogenation is
| (1) |
where and are measured on per unit C–H bond basis. Yang et al. (2013) have compiled and analyzed the UIE spectra of 35 sources available in the literature which exhibit both the 3.3 and 3.4 C–H features. They derived a median ratio of , with the majority (31/35) of these sources having (see Figure 1 of Yang et al. 2013). By taking and for the neutrals and for the cations (see Table 9 and §4.2), we obtain and , respectively. This suggests that the hydrogenation of the UIE emitters is quite small. Note that, as the 3.3 feature is predominantly emitted by neutral PAHs, we conclude that, even if the 3.4 feature exclusively arises from superhydrogenated PAHs, the degree of superhydrogenation of the UIE carriers would not exceed 2.2%.
Similarly, if we assume that one “superhydrogenated” C atom corresponds to 2 aliphatic C–H bonds, the degree of superhydrogenation could also be derived from the 6.85 aliphatic C–H deformation band and the 6.2 C=C stretch band as follows:
| (2) |
where is measured on a per aromatic C atom basis, is measured on a per unit C–H bond basis, and are the Planck functions of temperature at 6.2 and 6.85, respectively. Observationally, the detection of the 6.85 emission band in the ISM of the Milky Way is much rarer than the 3.4 emission band. Yang et al. (2016a) have compiled the UIE spectra of Galactic sources which exhibit the 6.85 band and found that, except for several Galactic protoplanetary nebulae, the 6.85 band is weaker than the 6.2 band by a factor of 10.888For several Galactic protoplanetary nebulae, the 6.85 feature is much stronger, with for some of these sources (see Yang et al. 2016a, Materese et al. 2017). Such a high ratio is also seen in some protoplanetary nebulae in the Small and Large Magellanic Clouds (see Sloan et al. 2014, Matsuura et al. 2014). With (Yang et al. 2016a), the mean ratio of the observed intensities of the 6.85 band to the 6.2 band, for (see Yang et al. 2016a), and and respectively for the neutrals and cations (see Table 9), we obtain and for the UIE carriers. This also supports the results obtained from the 3.4 feature that the superhydrogenation of the UIE carriers is insignificant.
Thanks in large part to the fact that the 3 region is accessible to ground-based telescopes, the 3.3 and 3.4 bands have been the subject of extensive scrutiny. ISO and AKARI have also provided a wealth of data on these bands. Operating at 5–38, Spitzer/IRS unfortunately missed the PAH C–H stretch at 3.3 and the accompanying satellite features at 3.4–3.6. Compared with Spitzer, JWST will have more than an order of magnitude increase in sensitivity and spatial resolution as well as a broader wavelength coverage in the near-IR. It is expected that JWST/NIRSpec, operating at 0.6–5, will be able to examine these bands so as to better contrain the degree of superhydrogenation of PAHs and its environmental dependence. The MIRI instrument on board JWST which covers the wavelength range of 5 to 28 will allow one to extend the mid-IR spectroscopy into new regimes that ISO and Spitzer could not probe, including the 6.85 and 7.25 aliphatic C–H deformation bands in objects which were too faint for ISO and Spitzer. Objects of particular interest for exploring the aromatic and aliphatic C–H emission bands include carbon star outflows, protoplanetary nebulae, planetary nebulae, protoplanetary disks around young stars, reflection nebulae, HII regions, photodissociated regions, as well as extragalactic objects (e.g., protoplanetary and planetary nebulae in the Small and Large Magellanic Clouds, the starburst ring of the barred spiral galaxy NGC 1097, and the superwind halo of the prototypical starburst galaxy M82). One would imagine that the 3.4 band is more likely to be seen in benign regions. It is puzzling that the 3.4 emission is detected in the harsh superwind of M82 and exhibits appreciable enhancements with distance from the galactic plane (see Yamagishi et al. 2012). With the upcoming JWST, smaller spatial scales can be probed and spectral mapping in these bands would be valuable for exploring their nature and environmental dependence.
5 Summary
We have used the hybrid DFT method B3LYP in conjunction with the 6-311+G∗∗ basis set to compute the IR vibrational spectra of superhydrogenated PAHs and their cations of various sizes (ranging from benzene, naphthalene to perylene and coronene) and of various degrees of hydrogenation (ranging from minimally hydrogenated PAHs to heavily hydrogenated PAHs). For comparison, we have also computed the spectra of mono-methylated PAHs as well as their bare parental PAHs. The principal results are as follows:
-
1.
The 3.4 aliphatic C–H stretch and the 6.85 aliphatic C–H deformation are seen in all these superhydrogenated species, more pronouncedly than in methyl PAHs.
-
2.
For all these superhydrogenated molecules, we have derived from the computed spectra the intrinsic band strengths of the 3.3 aromatic C–H stretch (), the 3.4 aliphatic C–H stretch (), the 6.2 aromatic C–C stretch (), and the 6.85 aliphatic C–H deformation (). By averaging over all these molecules, for hydrogenated neutral PAHs we have determined the mean band strengths (per aliphatic C–H bond) of and , and the mean band-strength ratios of and . For hydrogenated PAH cations, the corresponding band strengths and band-strength ratios are and , and and .
-
3.
By comparing the computationally-derived mean ratio of with the mean ratio of the observed intensities , we have estimated the degree of superhydrogenation to be only 2.2% for neutral PAHs which predominantly emit the 3.3 and 3.4 features. We have also derived the degree of superhydrogenation from the mean ratio of the observed intensities and for neutrals and for cations to be 3.1% for neutrals and 8.6% for cations. The actual degrees of superhydrogenation could be even lower since methylated PAHs and the anharmonicity of PAHs could also contribute to the observed 3.4 and 6.85 aliphatic C–H bands. Therefore, we conclude that astrophysical PAHs are primarily aromatic and are not significantly superhydrogenated.
References
- (1) Acke, B., Bouwman, J., & Juhász, A. 2010, ApJ, 718, 558
- (2) Allamandola, L.J., Tielens, A.G.G.M., & Barker, J.R. 1985, ApJ, 290, L25
- (3) Allamandola, L.J., Tielens, A.G.G.M., & Barker, J.R. 1989, ApJS, 71, 733
- (4) Allamandola, L.J., Hudgins, D.M., & Sandford, S.A. 1999, ApJ, 511, 115
- (5) Andrews, H., Candian, A., & Tielens, A.G.G.M. 2016, A&A, 595, 23
- (6) Bakes, E.L.O., & Tielens, A.G.G.M. 1994, ApJ, 427, 822
- (7) Barker, J. R., Allamandola, L. J., & Tielens, A. G. G. M. 1987, ApJL, 315, L61
- (8) Bauschlicher, C. W., Jr. 1998, ApJ, 509, L125
- (9) Bernstein, M.P., Sandford, S.A., & Allamandola, L.J. 1996, ApJ, 472, L127
- (10) Borowski, P. 2012, J. Phys. Chem. A, 116, 3866
- (11) Boschman, L., Reitsma, G., Cazaux, S., et al. 2012, ApJ, 761, L33
- (12) Brenner, J., & Barker, J. R. 1992, ApJL, 388, L39
- (13) Cassam-Chenaï, P., Pauzat, F., & Ellinger, Y. 1994, AIPC, 312, 543
- (14) Cazaux, S., Boschman, L., Rougeau, N. 2016, Scientific Reports, 6, 19835
- (15) Chen, T., Luo, Y., & Li, A. 2019, A&A, 632, A71
- (16) Draine, B.T., & Li, A. 2001, ApJ, 551, 807
- (17) Frisch, M. J., Trucks, G. W., Schlegel, H. B., et al. 2009, Gaussian 09, Revision B01, Gaussian, Inc., Wallingford CT
- (18) Geballe, T.R., Lacy, J.H., Persson, S.E., McGregor, P.J., & Soifer, B.T. 1985, ApJ, 292, 500
- (19) Geballe, T. R., Tielens, A. G. G. M., Allamandola, L. J., Moorhouse, A., & Brand, P. W. J. L. 1989, ApJ, 341, 278
- (20) Geballe, T. R., Joblin, C., d’Hendecourt, L. B., et al. 1994, ApJL, 434, L15
- (21) Goto, M., Usuda, T., Takato, N., et al. 2003, ApJ, 589, 419
- (22) Halasinski, T. M., Salama, F., & Allamandola, L. J. 2005, ApJ, 628, 555
- (23) Hammonds, M., Pathak, A., & Sarre, P. J. 2009, Phys. Chem. Chem. Phys., 11, 4458
- (24) Joblin, C., d’Hendecourt, L., Léger, A., & Defourneau, D. 1994, A&A, 281, 923
- (25) Joblin, C., Tielens, A.G.G.M., Allamandola, L.J., & Geballe, T.R. 1996, ApJ, 458, 610
- (26) Jensen, P. A.m Leccese, M., Simonsen, F. D. S., et al. 2019, MNRAS, 486, 5492
- (27) Jourdain de Muizon, M., Geballe, T.R., d’Hendecourt, L.B., & Baas, F. 1986, ApJ, 306, L105
- (28) Jourdain de Muizon, M., d’Hendecourt, L.B., & Geballe, T.R. 1990, A&A, 235, 367
- (29) Klærke, B., Toker, Y., Rahbek, D. B., Hornekær, L., & Andersen, L. H. 2013, A&A, 549, 84
- (30) Kondo, T., Kaneda, H., Oyabu, S., et al. 2012, ApJ, 751, L18
- (31) Léger, A., & Puget, J. 1984, A&A, 137, L5
- (32) Le Page, V., Snow, T. P., Bierbaum, V. M. 2009, ApJ, 704, 274
- (33) Li, A., & Draine, B.T. 2012, ApJ, 760, L35
- (34) Materese, C. K., Bregman, J. D., & Sandford, S. A. 2017, ApJ, 850, 165
- (35) Maltseva, E., Petrignani, A., Candian, A., et al. 2016, ApJ, 831, 58
- (36) Maltseva, E., Mackie, C. J., Candian, A., et al. 2018, A&A, 610, 65
- (37) Matsuura, M., Bernard-Salas, J., Lloyd Evans, T., et al. 2014, MNRAS, 439, 1472
- (38) Nagata, T., Tokunaga, A. T., Sellgren, K., et al. 1988, ApJ, 326, 157
- (39) Pauzat, F., & Ellinger, Y. 2001, MNRAS, 324, 355
- (40) Peeters, E., Allamandola, L.J., Hudgins, D.M., Hony, S., & Tielens, A.G.G.M. 2004, in Astrophysics of Dust (ASP Conf. Ser. 309), ed. A.N. Witt, G.C. Clayton, & B.T. Draine (San Francisco, CA: ASP), 141
- (41) Quitián-Lara, H. M., Fantuzzi, F., Nascimento, M. A. C., et al. 2018, ApJ, 854, 61
- (42) Rasmussen, J. A., Henkelman, G., & Hammer, B. 2011, JChPh, 134, 164703
- (43) Rauls, E., & Hornekær, L. 2008, ApJ, 679, 531
- (44) Ricks, A. M., Douberly, G. E., & Duncan, M. A. 2009, ApJ, 702, 301
- (45) Sandford, S.A. 1991, ApJ, 376, 599
- (46) Sandford, S. A., Allamandola, L. J., Tielens, A. G. G. M., et al. 1991, ApJ, 371, 601
- (47) Sandford, S. A., Bernstein, M. P., & Materese, C. K. 2013, ApJS, 205, 8
- (48) Schutte, W. A., Tielens, A. G. G. M., & Allamandola, L. J. 1993, ApJ 415, 397
- (49) Seok, J. Y., & Li, A. 2017, ApJ, 835, 291
- (50) Sloan, G.C., Bregman, J.D., Geballe, T.R., Allamandola, L.J., & Woodward, C.E. 1997, ApJ, 474, 735
- (51) Sloan, G. C., Lagadec, E., Zijlstra, A. A., et al. 2014, ApJ, 791, 28
- (52) Smith, T. L., Clayton, G. C., & Valencic, L. 2004, AJ, 128, 357
- (53) Steglich, M., Jäger, C., Huisken, F., et al. 2013, ApJS, 208, 26
- (54) Thrower, J. D., Friis, E. E., Skov, A. L., et al. 2014, Phys. Chem. Chem. Phys., 16, 3381
- (55) Thrower, J. D., Jørgensen, B., Friis, E. E., et al. 2012, ApJ, 752, 3
- (56) Tielens, A. G. G. M. 2008, ARA&A, 46, 289
- (57) Wagner, D. R., Kim, H., & Saykally, R. J. 2000, ApJ, 545, 854
- (58) Weingartner, J. C., & Draine, B. T. 2001, ApJS, 134, 263
- (59) Wolf, M., Kiefer, H. V., Langeland, J., et al. 2016, ApJ, 832, 24
- (60) Yamagishi, M., Kaneda, H., Ishihara, D., et al. 2012, A&A, 541, A10
- (61) Yang, X. J., Glaser, R., Li, A., & Zhong, J. X. 2013, ApJ, 776, 110
- (62) Yang, X. J., Glaser, R., Li, A., & Zhong, J. X. 2016a, MNRAS, 462, 1551
- (63) Yang, X. J., Li, A., Glaser, R., & Zhong, J. X. 2016b, ApJ, 825, 22
- (64) Yang, X. J., Glaser, R., Li, A., & Zhong, J. X. 2017a, New Astron. Rev., 77, 1
- (65) Yang, X. J., Li, A., Glaser, R., & Zhong, J. X. 2017b, ApJ, 837, 171
| Compound | a | VZPEb | TEc | d | e | e | f |
|---|---|---|---|---|---|---|---|
| Ben2H | -233.483877 | 76.42 | 79.68 | 70.95 | 196.11 | 300.94 | 0.4992 |
| Ben4H | -234.713155 | 91.36 | 94.82 | 73.91 | 165.69 | 275.50 | 0.3573 |
| Ben6H | -235.944820 | 106.34 | 109.94 | 74.68 | 230.63 | 230.90 | 0.0000 |
| Ben2H+ | -233.194323 | 75.78 | 79.23 | 74.30 | 95.51 | 250.66 | 0.0454 |
| Ben4H+ | -234.394150 | 89.24 | 92.97 | 75.53 | 165.44 | 205.57 | 2.5497 |
| Ben6H+ | -235.588818 | 101.51 | 105.63 | 78.71 | 198.63 | 261.93 | 0.0000 |
- a
-
Total energies in atomic units.
- b
-
Vibrational zero-point energies (VZPE) in .
- c
-
Thermal energies (TE) in .
- d
-
Molecular entropies () in .
- e
-
The lowest vibrational modes and in .
- f
-
Dipole moment in Debye.
| Compound | ||||||
|---|---|---|---|---|---|---|
| Ben2H | 32.92 | 0.49 | 16.54 | 0.49 | 1.99 | 1.00 |
| Ben4H | 38.46 | 2.29 | 25.52 | 2.48 | 1.51 | 0.93 |
| Ben6H | 45.39 | 2.33 | ||||
| Average | 38.92 | 1.70 | 21.03 | 1.48 | 1.75 | 0.96 |
| Ben2H+ | 14.24 | 30.08 | 2.99 | 27.29 | 4.77 | 1.10 |
| Ben4H+ | 24.90 | 3.03 | 4.85 | 0.02 | 5.13 | 139.10 |
| Ben6H+ | 40.75 | 2.20 | ||||
| Average | 26.63 | 11.77 | 3.92 | 13.65 | 4.95 | 70.10 |
| Compound | VZPE | TE | |||||
|---|---|---|---|---|---|---|---|
| DHN (Naph2H) | -387.180337 | 106.21 | 110.92 | 85.00 | 134.45 | 152.34 | 0.6693 |
| THN (Naph4H) | -388.405052 | 121.04 | 126.01 | 85.70 | 96.16 | 143.04 | 0.7829 |
| OHN (Naph8H) | -390.810255 | 149.73 | 155.35 | 88.65 | 91.21 | 141.58 | 0.0000 |
| c-PHN (Naph10Ha) | -392.031003 | 165.09 | 170.64 | 88.69 | 138.52 | 154.01 | 0.0269 |
| t-PHN (Naph10Hb) | -392.036103 | 164.83 | 170.42 | 89.19 | 128.35 | 138.68 | 0.0000 |
| DHN+ | -386.898228 | 105.83 | 110.70 | 87.72 | 113.20 | 135.78 | 1.1938 |
| THN+ | -388.101882 | 119.58 | 124.85 | 89.52 | 88.20 | 91.18 | 2.0163 |
| OHN+ | -390.524810 | 148.44 | 154.25 | 91.85 | 81.26 | 81.49 | 0.0000 |
| c-PHN+ | -391.691884 | 160.73 | 166.81 | 94.67 | 126.77 | 141.78 | 2.2291 |
| t-PHN+ | -391.706269 | 161.77 | 167.83 | 93.38 | 109.62 | 143.02 | 0.0000 |
| Compound | ||||||
|---|---|---|---|---|---|---|
| DHN (Naph2H) | 31.05 | 4.16 | 15.28 | 0.17 | 2.03 | 24.85 |
| THN (Naph4H) | 35.85 | 3.00 | 16.43 | 0.68 | 2.18 | 4.40 |
| OHN (Naph8H) | 44.40 | 1.61 | 0.00 | |||
| c-PHN (Naph10Ha) | 44.65 | 2.29 | ||||
| t-PHN (Naph10Hb) | 43.61 | 1.91 | ||||
| Average | 39.91 | 2.59 | 15.85 | 0.28 | 2.11 | 14.62 |
| DHN+ | 7.28 | 28.67 | 0.39 | 37.49 | 18.82 | 0.76 |
| THN+ | 17.87 | 2.32 | 0.59 | 0.12 | 30.28 | 19.69 |
| OHN+ | 12.61 | 1.91 | 0.00 | |||
| c-PHN+ | 28.65 | 4.08 | ||||
| t-PHN+ | 21.81 | 1.99 | ||||
| Average | 17.64 | 7.79 | 0.49 | 12.54 | 24.55 | 10.23 |
| Compound | VZPE | TE | |||||
|---|---|---|---|---|---|---|---|
| Pery2HRamII | -770.753921 | 172.62 | 181.11 | 114.95 | 37.33 | 64.53 | 0.6515 |
| Pery2HRamIII | -770.772978 | 172.78 | 181.24 | 113.61 | 50.92 | 92.01 | 0.8480 |
| Pery2HRamIV | -770.744407 | 172.18 | 180.77 | 114.57 | 49.57 | 84.50 | 0.7150 |
| Pery4H | -771.953401 | 187.06 | 195.83 | 115.86 | 47.24 | 86.27 | 1.0315 |
| Pery4HRG1 | -771.951377 | 186.87 | 195.70 | 116.69 | 34.57 | 85.78 | 1.3194 |
| Pery4HRG2 | -771.986296 | 187.76 | 196.38 | 114.93 | 51.61 | 77.12 | 0.9694 |
| Pery6H | -773.178734 | 201.90 | 210.92 | 117.59 | 40.81 | 84.47 | 1.3198 |
| Pery6HYal | -773.205900 | 202.12 | 211.18 | 118.20 | 50.54 | 60.42 | 1.4594 |
| Pery6H1Yal | -773.205072 | 202.04 | 211.17 | 119.50 | 42.50 | 52.96 | 1.4314 |
| Pery6HZinkeR | -773.196404 | 202.07 | 211.12 | 117.66 | 57.26 | 73.40 | 0.0460 |
| Pery6H1Zinke | -773.196165 | 202.09 | 211.15 | 117.85 | 56.58 | 67.78 | 0.0000 |
| Pery8H | -774.333885 | 215.26 | 224.77 | 120.87 | 39.69 | 78.16 | 1.4590 |
| Pery8Hb | -774.335840 | 215.32 | 224.79 | 119.99 | 53.13 | 81.01 | 1.4564 |
| Pery8HYal | -774.404986 | 216.86 | 226.01 | 118.14 | 62.98 | 69.23 | 1.3854 |
| Pery8HbYal | -774.392233 | 216.94 | 226.17 | 119.13 | 52.82 | 80.29 | 1.4419 |
| Pery8HZinke | -774.398164 | 216.87 | 225.97 | 117.79 | 57.52 | 76.52 | 0.5307 |
| Pery8HbZinke | -774.385387 | 216.62 | 226.01 | 123.33 | 15.58 | 56.86 | 0.0000 |
| Pery8HRG1 | -774.384872 | 216.71 | 225.97 | 119.82 | 28.89 | 86.27 | 1.4488 |
| Pery8HRG2 | -774.387559 | 216.72 | 225.82 | 117.94 | 38.78 | 84.51 | 1.1210 |
| Pery10H | -775.541432 | 230.08 | 239.83 | 122.70 | 42.09 | 73.37 | 0.9738 |
| Pery10Hb | -775.539497 | 230.09 | 239.77 | 121.83 | 45.13 | 78.15 | 1.0945 |
| Pery10HRG1 | -775.612714 | 231.25 | 240.85 | 121.84 | 49.44 | 62.02 | 1.0798 |
| Pery10HRG2 | -775.563323 | 231.13 | 240.68 | 121.99 | 31.45 | 68.40 | 1.3365 |
| Pery12H | -776.766232 | 244.94 | 254.92 | 124.01 | 43.15 | 71.18 | 0.3473 |
| Pery12Hb | -776.768985 | 245.00 | 254.95 | 123.31 | 51.44 | 78.04 | 0.2981 |
| Pery12HRG1 | -776.800583 | 245.45 | 255.36 | 123.69 | 48.54 | 67.71 | 0.5676 |
| Pery12HRG2 | -776.799299 | 245.29 | 255.38 | 125.67 | 45.82 | 64.18 | 0.5083 |
| Pery14HYal | -778.023443 | 260.28 | 270.43 | 125.47 | 45.81 | 69.16 | 0.0643 |
| HCPery2HRamII+ | -770.496974 | 172.38 | 180.96 | 116.38 | 43.61 | 76.94 | 2.1098 |
| HCPery2HRamIII+ | -770.526761 | 172.81 | 181.40 | 116.28 | 44.18 | 85.96 | 1.4860 |
| HCPery2HRamIV+ | -770.522678 | 172.73 | 181.35 | 116.50 | 45.79 | 79.38 | 1.3025 |
| HCPery4H+ | -771.723440 | 187.41 | 196.25 | 117.96 | 44.23 | 80.46 | 0.9571 |
| HCPery4HRG1+ | -771.716524 | 187.11 | 196.01 | 118.63 | 36.45 | 81.25 | 0.7951 |
| HCPery4HRG2+ | -771.728963 | 187.68 | 196.49 | 118.58 | 33.29 | 66.61 | 2.1650 |
| HCPery6H+ | -772.940502 | 202.02 | 211.15 | 120.29 | 32.91 | 77.56 | 1.6254 |
| HCPery6HYal+ | -772.951020 | 201.91 | 211.10 | 119.31 | 42.03 | 65.22 | 0.2005 |
| HCPery6H1Yal+ | -772.949412 | 201.75 | 211.09 | 124.84 | 13.04 | 56.54 | 0.3613 |
| HCPery6HZinkeR+ | -772.956553 | 202.26 | 211.42 | 120.29 | 52.95 | 64.70 | 0.3530 |
| HCPery6H1Zinke+ | -772.956228 | 202.28 | 211.45 | 120.67 | 49.67 | 58.93 | 0.0000 |
| HCPery8H+ | -774.122849 | 215.74 | 225.31 | 123.40 | 31.23 | 71.19 | 1.8918 |
| HCPery8Hb+ | -774.123811 | 215.78 | 225.32 | 122.39 | 44.13 | 75.32 | 1.8700 |
| HCPery8HYal+ | -774.136447 | 216.67 | 226.01 | 121.08 | 59.84 | 61.18 | 2.2739 |
| HCPery8HbYal+ | -774.125730 | 216.70 | 226.11 | 121.97 | 50.31 | 72.40 | 1.8594 |
| HCPery8HZinke+ | -774.110956 | 214.71 | 224.21 | 122.23 | 47.63 | 68.01 | 0.8075 |
| HCPery8HbZinke+ | -774.105278 | 214.94 | 224.50 | 123.41 | 40.66 | 65.24 | 1.1675 |
| HCPery8HRG1+ | -774.144315 | 216.82 | 226.08 | 120.61 | 47.50 | 73.98 | 2.0791 |
| HCPery8HRG2+ | -774.131549 | 216.60 | 225.84 | 120.41 | 37.24 | 79.73 | 3.6216 |
| HCPery10H+ | -775.323173 | 230.35 | 240.17 | 125.04 | 35.95 | 71.65 | 2.4960 |
| HCPery10Hb+ | -775.322751 | 230.44 | 240.36 | 126.68 | 29.92 | 62.85 | 2.4753 |
| HCPery10HRG1+ | -775.359377 | 230.97 | 240.76 | 125.13 | 39.86 | 60.39 | 2.3740 |
| HCPery10HRG2+ | -775.325197 | 231.10 | 240.59 | 121.93 | 53.18 | 65.83 | 3.4206 |
| HCPery12H+ | -776.541119 | 245.01 | 255.12 | 127.38 | 28.86 | 67.25 | 2.3983 |
| HCPery12Hb+ | -776.542472 | 245.10 | 255.15 | 126.20 | 36.41 | 72.09 | 2.4220 |
| HCPery12HRG1+ | -776.544666 | 245.15 | 255.25 | 127.08 | 38.21 | 63.75 | 2.8541 |
| HCPery12HRG2+ | -776.549805 | 244.92 | 255.13 | 128.35 | 42.55 | 49.79 | 3.7425 |
| HCPery14HYal+ | -777.754163 | 258.90 | 269.47 | 131.13 | 28.64 | 63.37 | 0.0418 |
| Compound | ||||||
|---|---|---|---|---|---|---|
| Pery2HRamII | 20.13 | 4.83 | 14.61 | 2.65 | 1.38 | 1.82 |
| Pery2HRamIII | 36.05 | 3.54 | 12.95 | 1.76 | 2.78 | 2.01 |
| Pery2HRamIV | 30.63 | 1.35 | 14.54 | 2.70 | 2.11 | 0.50 |
| Pery4H | 34.47 | 0.87 | 16.06 | 2.89 | 2.15 | 0.30 |
| Pery4HRG1 | 38.10 | 1.47 | 13.65 | 2.33 | 2.79 | 0.63 |
| Pery4HRG2 | 30.53 | 2.96 | 14.10 | 2.73 | 2.17 | 1.09 |
| Pery6H | 39.43 | 1.59 | 14.02 | 3.94 | 2.81 | 0.40 |
| Pery6HYal | 34.57 | 2.02 | 15.67 | 2.17 | 2.21 | 0.93 |
| Pery6H1Yal | 34.86 | 2.92 | 15.63 | 2.20 | 2.23 | 1.32 |
| Pery6HZinkeR | 33.73 | 3.20 | 17.30 | 2.75 | 1.95 | 1.16 |
| Pery6H1Zinke | 33.82 | 2.72 | 17.33 | 2.24 | 1.95 | 1.21 |
| Pery8H | 41.49 | 1.72 | 16.19 | 3.48 | 2.56 | 0.50 |
| Pery8Hb | 40.25 | 1.54 | 14.58 | 3.41 | 2.76 | 0.45 |
| Pery8HYal | 33.95 | 2.96 | 15.33 | 1.98 | 2.21 | 1.49 |
| Pery8HbYal | 34.12 | 1.48 | 15.18 | 2.26 | 2.25 | 0.66 |
| Pery8HZinke | 32.59 | 3.81 | 16.35 | 1.85 | 1.99 | 2.06 |
| Pery8HbZinke | 27.87 | 6.15 | 25.54 | 2.22 | 1.09 | 2.77 |
| Pery8HRG1 | 35.75 | 1.28 | 15.65 | 5.95 | 2.28 | 0.22 |
| Pery8HRG2 | 36.46 | 1.38 | 14.85 | 2.77 | 2.45 | 0.50 |
| Pery10H | 40.28 | 1.59 | 18.30 | 2.07 | 2.20 | 0.77 |
| Pery10Hb | 39.28 | 1.74 | 17.16 | 2.48 | 2.29 | 0.70 |
| Pery10HRG1 | 38.74 | 1.92 | 21.21 | 1.99 | 1.83 | 0.97 |
| Pery10HRG2 | 32.73 | 2.19 | 18.97 | 2.82 | 1.73 | 0.78 |
| Pery12H | 42.09 | 1.56 | 12.97 | 1.62 | 3.24 | 0.96 |
| Pery12Hb | 42.14 | 1.49 | 13.47 | 1.58 | 3.13 | 0.95 |
| Pery12HRG1 | 39.62 | 1.84 | 17.91 | 0.96 | 2.21 | 1.91 |
| Pery12HRG2 | 39.01 | 1.81 | 30.13 | 0.55 | 1.29 | 3.29 |
| Average | 35.66 | 2.29 | 16.65 | 2.46 | 2.22 | 1.12 |
| Pery2HRamII+ | 10.83 | 9.99 | 1.04 | 21.98 | 10.45 | 0.45 |
| Pery2HRamIII+ | 7.94 | 38.26 | 1.23 | 13.72 | 6.46 | 2.79 |
| Pery2HRamIV+ | 3.96 | 19.57 | 1.82 | 15.18 | 2.17 | 1.29 |
| Pery4H+ | 13.85 | 5.04 | 1.77 | 20.77 | 7.82 | 0.24 |
| Pery4HRG1+ | 9.80 | 14.52 | 1.78 | 29.49 | 5.51 | 0.49 |
| Pery4HRG2+ | 13.78 | 11.54 | 1.13 | 24.94 | 12.16 | 0.46 |
| Pery6H+ | 15.15 | 8.85 | 1.63 | 16.42 | 9.32 | 0.54 |
| Pery6H2Yal+ | 10.07 | 11.91 | 1.86 | 22.29 | 5.42 | 0.53 |
| Pery6H1Yal+ | 10.85 | 28.83 | 1.90 | 25.93 | 5.71 | 1.11 |
| Pery6HZinke+ | 10.39 | 13.39 | 1.63 | 12.07 | 6.37 | 1.11 |
| Pery6H1Zinke+ | 10.55 | 6.96 | 1.65 | 12.74 | 6.40 | 0.55 |
| Pery8H+ | 13.54 | 7.78 | 5.09 | 13.24 | 2.66 | 0.59 |
| Pery8Hb+ | 12.97 | 12.90 | 4.60 | 13.53 | 2.82 | 0.95 |
| Pery8HYal+ | 13.02 | 2.93 | 1.04 | 39.28 | 12.57 | 0.07 |
| Pery8HbYal+ | 13.02 | 2.66 | 0.95 | 33.44 | 13.65 | 0.08 |
| Pery8HZinke+ | 13.37 | 9.34 | 4.70 | 117.20 | 2.85 | 0.08 |
| Pery8HbZinke+ | 10.67 | 19.65 | 4.90 | 103.34 | 2.18 | 0.19 |
| Pery8HRG1+ | 14.52 | 19.37 | 0.75 | 30.54 | 19.39 | 0.63 |
| Pery8HRG2+ | 18.17 | 50.40 | 1.25 | 2.32 | 14.55 | 21.71 |
| Pery10H+ | 14.75 | 2.73 | 4.93 | 22.99 | 2.99 | 0.12 |
| Pery10Hb+ | 14.14 | 8.50 | 5.18 | 18.49 | 2.73 | 0.46 |
| Pery10HRG1+ | 15.32 | 7.00 | 2.20 | 7.70 | 6.96 | 0.91 |
| Pery10HRG2+ | 15.79 | 4.48 | 1.20 | 42.06 | 13.14 | 0.11 |
| Pery12H+ | 14.76 | 7.58 | 6.86 | 30.68 | 2.15 | 0.25 |
| Pery12Hb+ | 14.85 | 7.70 | 6.53 | 33.82 | 2.28 | 0.23 |
| Pery12HRG1+ | 15.78 | 9.57 | 0.82 | 36.09 | 19.24 | 0.27 |
| Pery12HRG2+ | 14.99 | 12.95 | 3.69 | 41.99 | 4.07 | 0.31 |
| Average | 12.85 | 13.13 | 2.67 | 29.71 | 7.48 | 1.35 |
| Compound | VZPE | TE | |||||
|---|---|---|---|---|---|---|---|
| DHA | -540.868165 | 135.60 | 141.90 | 96.93 | 53.31 | 122.15 | 0.3557 |
| HHA | -543.219349 | 162.56 | 170.10 | 108.79 | 36.87 | 70.27 | 0.0023 |
| DHPh | -540.871768 | 135.93 | 142.18 | 96.05 | 86.59 | 103.76 | 0.5922 |
| DBS | -580.183622 | 153.93 | 160.91 | 103.72 | 42.47 | 93.64 | 0.5200 |
| tPHF | -508.771366 | 205.07 | 212.43 | 105.17 | 60.46 | 104.25 | 0.0993 |
| DHP | -617.117922 | 143.84 | 150.51 | 98.63 | 86.75 | 134.11 | 0.6216 |
| HHP | -619.530713 | 172.79 | 180.11 | 104.72 | 84.13 | 97.29 | 0.0000 |
| THBaP | -772.007230 | 187.51 | 196.24 | 115.50 | 54.77 | 78.13 | 1.1531 |
| H9CpaP | -731.455224 | 154.18 | 161.96 | 108.25 | 67.45 | 113.41 | 0.8871 |
| HHCpaP | -731.455224 | 154.18 | 161.96 | 108.25 | 67.45 | 113.41 | 0.8871 |
| DDHTP | -700.577894 | 237.65 | 247.33 | 123.09 | 50.06 | 76.72 | 0.0340 |
| PHC | -936.545478 | 349.56 | 361.11 | 132.27 | 64.00 | 64.14 | 0.0000 |
| DHBdeA | -656.439215 | 161.77 | 169.27 | 106.81 | 67.38 | 85.13 | 0.9977 |
| CpPh | -577.776337 | 125.39 | 131.42 | 95.40 | 94.07 | 184.13 | 0.6588 |
| HBbF | -655.222412 | 146.60 | 153.90 | 105.83 | 60.67 | 95.01 | 0.6798 |
| DHDBahA | -848.218890 | 194.02 | 203.80 | 126.06 | 19.21 | 48.09 | 0.0000 |
| DHBep | -770.778358 | 172.70 | 181.23 | 114.08 | 61.35 | 81.20 | 0.7271 |
| TRIP | -770.756412 | 172.81 | 181.11 | 113.02 | 66.45 | 66.53 | 0.0001 |
| DHA+ | -540.572936 | 133.52 | 140.23 | 102.32 | 28.03 | 93.78 | 0.2662 |
| HHA+ | -542.936608 | 160.22 | 167.84 | 109.54 | 52.80 | 83.74 | 0.1517 |
| DHPh+ | -540.593203 | 135.71 | 142.15 | 99.01 | 72.67 | 95.49 | 0.1409 |
| DBS+ | -579.894009 | 153.31 | 160.50 | 107.12 | 34.65 | 80.78 | 0.3793 |
| tPHF+ | -508.448630 | 202.54 | 210.39 | 109.82 | 53.47 | 95.12 | 3.2675 |
| DHP+ | -616.844866 | 143.39 | 150.23 | 101.20 | 83.70 | 124.12 | 0.8562 |
| HHP+ | -619.272752 | 172.53 | 180.02 | 107.46 | 81.67 | 85.99 | 0.0000 |
| THBaP+ | -771.755072 | 187.51 | 196.35 | 117.79 | 54.83 | 69.96 | 2.1796 |
| H9CpaP+ | -731.199725 | 154.07 | 161.94 | 110.34 | 68.24 | 105.24 | 1.2416 |
| HHCpaP+ | -734.823483 | 197.89 | 206.82 | 118.72 | 45.45 | 81.58 | 0.6217 |
| DDHTP+ | -700.312268 | 236.08 | 246.05 | 124.76 | 52.59 | 67.68 | 0.1916 |
| PHC+ | -936.252216 | 346.64 | 358.57 | 135.86 | 61.64 | 64.77 | 0.0000 |
| DHBdeA+ | -656.173080 | 161.47 | 169.14 | 109.63 | 58.14 | 80.12 | 0.5296 |
| CpPh+ | -577.500270 | 124.81 | 130.97 | 97.57 | 96.68 | 175.49 | 0.1925 |
| HBbF+ | -654.956057 | 146.56 | 153.97 | 108.03 | 57.63 | 93.88 | 0.8366 |
| DHDBahA+ | -847.951115 | 193.15 | 203.14 | 130.79 | 8.46 | 41.40 | 0.0000 |
| DHBep+ | -770.529159 | 172.76 | 181.39 | 116.62 | 56.46 | 66.49 | 0.9530 |
| TRIP+ | -770.480563 | 172.58 | 181.08 | 116.10 | 63.07 | 63.16 | 0.0000 |
| Compound | ||||||
|---|---|---|---|---|---|---|
| DHA | 18.81 | 2.01 | 15.06 | 0.42 | 1.25 | 4.84 |
| HHA | 40.15 | 1.08 | 29.78 | 2.37 | 1.35 | 0.46 |
| DHPh | 28.20 | 6.11 | 13.95 | 0.31 | 2.02 | 19.70 |
| DBS | 24.06 | 5.36 | 15.28 | 0.38 | 1.57 | 14.17 |
| tPHF | 39.26 | 1.32 | ||||
| DHP | 28.04 | 3.37 | 15.44 | 0.46 | 1.82 | 7.41 |
| HHP | 36.01 | 2.19 | 22.31 | 2.12 | 1.61 | 1.03 |
| THBaP | 37.64 | 4.21 | 14.55 | 1.73 | 2.59 | 2.44 |
| H9CpaP | 11.85 | 3.95 | 13.80 | 1.37 | 0.86 | 2.89 |
| HHCpaP | 34.34 | 3.29 | 19.76 | 0.92 | 1.74 | 3.56 |
| DDHTP | 39.28 | 2.15 | 0.52 | 4.11 | ||
| PHC | 47.18 | 1.81 | ||||
| DHBdeA | 33.85 | 3.18 | 14.31 | 1.88 | 2.36 | 1.69 |
| CpPh | 10.55 | 4.69 | 15.50 | 0.48 | 0.68 | 9.87 |
| HBbF | 12.12 | 7.23 | 13.99 | 1.92 | 0.87 | 3.78 |
| DHDBahA | 15.35 | 1.23 | 13.65 | 2.75 | 1.12 | 0.45 |
| DHBep | 29.64 | 1.61 | 13.90 | 1.74 | 2.13 | 0.93 |
| TRIP | 16.35 | 14.05 | 0.23 | 1.16 | ||
| Average | 27.93 | 3.22 | 16.35 | 1.22 | 1.54 | 5.15 |
| DHA+ | 11.44 | 4.44 | 3.28 | 86.14 | 3.49 | 0.05 |
| HHA+ | 34.76 | 13.82 | 18.03 | 261.89 | 1.93 | 0.05 |
| DHPh+ | 4.24 | 12.78 | 0.34 | 30.70 | 12.60 | 0.42 |
| DBS+ | 4.44 | 55.68 | 1.85 | 67.51 | 2.40 | 0.82 |
| tPHF+ | 13.87 | 3.62 | ||||
| DHP+ | 5.70 | 7.94 | 0.71 | 19.55 | 8.06 | 0.41 |
| HHP+ | 9.22 | 10.69 | 1.22 | 20.96 | 7.55 | 0.51 |
| THBaP+ | 17.19 | 7.71 | 0.73 | 12.71 | 23.47 | 0.61 |
| H9CpaP+ | 0.99 | 0.00 | 0.66 | 11.21 | 1.51 | 0.00 |
| HHCpaP+ | 9.75 | 16.45 | 2.16 | 36.04 | 4.50 | 0.46 |
| DDHTP+ | 39.28 | 12.32 | 0.36 | 34.72 | ||
| PHC+ | 31.47 | 2.20 | ||||
| DHBdeA+ | 10.13 | 18.24 | 0.89 | 19.80 | 11.37 | 0.92 |
| CpPh+ | 3.62 | 15.03 | 0.34 | 17.07 | 10.67 | 0.88 |
| HBbF+ | 0.91 | 58.14 | 1.34 | 54.13 | 0.68 | 1.07 |
| DHDBahA+ | 0.58 | 2.70 | 7.19 | 80.36 | 0.08 | 0.03 |
| DHBep+ | 5.31 | 14.18 | 1.16 | 22.42 | 4.58 | 0.63 |
| TRIP+ | 4.40 | 2.68 | 0.00 | 1.64 | ||
| Average | 11.52 | 15.06 | 2.84 | 46.30 | 6.30 | 2.77 |
| Compound | ||||||
|---|---|---|---|---|---|---|
| Neutrals | 33.62 | 2.59 | 16.71 | 1.87 | 1.98 | 3.02a |
| Cations | 13.63 | 13.17 | 2.69 | 33.50 | 7.73 | 5.19b |
- a
-
if we exclude those molecules with extreme ratios.
- b
-
if we exclude those molecules with extreme ratios.