Disappearance of the Fe K emission line in Ultra Compact X-ray Binaries 4U 1543624 and Swift J1756.92508
Abstract
We investigate the long-term variability of the iron K line in the spectra of two Ultra Compact X-ray Sources (UCXBs) with C/O-rich donors. We revisit archival observations from five different X-ray telescopes, over a twenty year period. Adopting physically motivated models for the spectral continuum, we probe the long-term evolution of the source emission in a self-consistent manner enabling physical interpretation of potential variability of the primary X-ray continuum emission and/or any emission lines from reflection off the accretion disk. We find that the spectral shape and flux of the source emission (for both objects) has remained almost constant throughout all the observations, displaying only minor variability in some spectral parameters and the source flux (largest variation is a 25% drop in the flux of Swift J1756.92508 ). We note a striking variability of the Fe K line which fluctuates from a notable equivalent width of 66-100 eV in 4U 1543624 and 170 eV in Swift J1756.92508 , to non-detections with upper limits of 2-8 eV. We argue that the disappearance of the iron line is due to the screening of the Fe K line by the overabundant oxygen in the C/O-rich UCXBs. This effect is cancelled when oxygen becomes fully ionized in the inner disk region, resulting in the variability of the Fe K line in an otherwise unaltered spectral shape. This finding supports earlier predictions on the consequences of H-poor, C/O-rich accretion disk on reflection induced fluorescent lines in the spectra of UCXBs.
keywords:
Keywords from the MNRAS website1 Introduction
Ultra compact X-ray binaries (UCXBs) are accreting binary systems, defined by their very short (less than 1 hr) orbital periods. Their periods suggest such tight orbits that a main sequence star cannot fit (e.g., Rappaport & Joss 1984; Nelson, Rappaport & Joss 1986). Evolutionary scenarios and observational findings indicate that UCXBs are composed of a Roche lobe filling white dwarf or helium star that is accreting material on to a neutron star (e.g., Tutukov & Yungelson, 1993; Iben et al., 1995; Verbunt & van den Heuvel, 1995; Deloye & Bildsten, 2003; Deloye et al., 2005). More specifically, the different formation paths of UCXBs – which may or may not include a common envelope phase with their binary companion – result in donor stars that can range from He stars or He-WDs to C/O or O/Ne/Mg-WDs (e.g., Savonije et al., 1986; Podsiadlowski et al., 2002; Yungelson et al., 2002; Bildsten & Deloye, 2004). For simplicity UCXBs are often divided into two main categories: He-rich and He-poor, depending on the donor composition. Since divergent UCXB formation paths lead to degenerate donors of similar mass, determining the chemical composition of the disk (and therefore the donor star) in these sources is a crucial step towards constraining their formation history. Furthermore, UCXBs offer a unique opportunity to study accretion of hydrogen-poor matter onto compact objects.
The non-solar abundance of the accreting material in UCXBs can have a profound effect on the emission line spectrum of UCXBs in both the optical (He, C, or O lines, e.g., Nelemans et al., 2004; Werner et al., 2006; Nelemans et al., 2006) and the X-ray wavelengths (primarily in the form of C and O K lines, e.g., Juett et al. 2001; Juett & Chakrabarty 2005; Madej et al. 2010). Nevertheless, due to the very faint optical counterparts of UCXBs (V-band absolute magnitudes ) but also due to the increased interstellar absorption in the keV range of the X-ray spectrum the detection of C and O emission lines is often considerably difficult. In a relatively recent theoretical study, Koliopanos et al. (2013) demonstrated that the iron line located at 6.4 keV (and therefore not affected by interstellar absorption) can be used as an indirect method for determining the chemical composition of the accretion disk and donor star in UCXBs.
More specifically, for moderately luminous sources ( a few ) a strong suppression of the Fe line was predicted in the case of a C/O or O/Ne/Mg WD donor, translating to a more than tenfold decrease of the equivalent width (EW) of the line. On the other hand, in the case of He-rich disks, the iron line remains unaffected with an EW in the same range as “standard” X-ray binaries (XRBs) with hydrogen rich donors. Observational analysis of five well-known UCXB sources corroborated these predictions (Koliopanos et al., 2014). In addition to the above predictions, Koliopanos et al. (2013) indicated that the screening effect is decidedly linked to the ionization state of oxygen and (to a second degree) carbon. The authors further demonstrated that – given some specific assumptions – the ionization state of C and O in the disk and subsequently the presence or absence of the prominent Fe line is luminosity dependent. In this paper we report on the behavior of two known UCXBs, which appear to exhibit the iron line variability, predicted by Koliopanos et al. (2013).
4U 1543624 is a well known UCXB which most likely hosts a C/O or Ne-rich WD donor (e.g., Juett et al., 2001). Discovered by the UHURU telescope (Jones, 1977), it was classified as an UCXB after Wang & Chakrabarty (2004) established a period of P18.2 minutes, based on optical light curves. 4U 1543624 is a persistent X-ray source with a stable, moderately bright emission since its discovery. It has been observed by most major X-ray observatories, including BEPPOSAX (Farinelli et al., 2003), ASCA and RXTE (Schultz, 2003) as well as Chandra and XMM-Newton (Juett et al., 2001; Juett & Chakrabarty, 2003; Madej & Jonker, 2011; Madej et al., 2014) and more recently NICER (this paper and Ludlam et al. 2019). The X-ray continuum of the source has been modeled using a variety of different models including thermal and non-thermal components leading to different interpretations for its physical origin. Furthermore, a pronounced emission line centered at keV has been detected by both the XMM-Newton RGS and the Chandra HETG spectrometers. The emission line has been attributed to reflection of hard X-rays from a C/O-rich disk (most prominent being the O VII Ly line, e.g., Juett & Chakrabarty, 2003; Madej & Jonker, 2011; Madej et al., 2014). The presence of the iron K line – usually detected in the spectra of X-ray binaries – has been much more dubious. The line was reported in BEPPOSAX and RXTE but was not present in ASCA spectra (Juett et al., 2001; Schultz, 2003). Its potential presence has been tentatively claimed in the XMM-Newton spectra (Madej & Jonker, 2011; Madej et al., 2014) but not in Chandra (Juett & Chakrabarty, 2003). More recently, Ludlam et al. (2019) presented a thorough analysis of X-ray and radio observations of 4U 1543624 during an enhanced accretion episode in 2017 (Ludlam et al., 2017; Miller et al., 2017). The iron emission line re-emerged during this phase, Ludlam et al. (2019) reported its presence and attributed it to X-ray reflection off the accretion disk surface.
Swift J1756.92508 is an LMXB located in the direction of the Galactic bulge. It was discovered in 2007 during an X-ray outburst observed by the Swift-BAT. Follow up observations with RXTE identified the source as an UCXB ( min) with a millisecond pulsar (Krimm et al., 2007). The transient source was again detected by the Swift-BAT and RXTE PCA during a second outburst in 2009 and more recently in 2018, when it was observed by Swift/XRT, XMM-Newton, NuSTAR and NICER (Kuiper et al., 2018; Bult et al., 2018b). The multiple observations spanning more than a decade allowed the accurate study of the orbital evolution of the source (Patruno et al., 2010; Sanna et al., 2018; Bult et al., 2018a), which in turn indicated the strength of the NS magnetic field at G (Sanna et al., 2018). No type-I X-ray bursts were detected during any of the outbursts of Swift J1756.92508 .
In this paper we revisit observations of 4U 1543624 and Swift J1756.92508 at different epochs, focusing our analysis on the shape of the spectral continuum and the presence or absence of the iron emission line. More specifically we examine observations of 4U 1543624 between 1997 and 2001 as well as its unusually bright 2017 outburst (4U 1543624 is a persistent source, which entered a remarkably bright phase on Sept. 2017, Miller et al., 2017). For the transient source Swift J1756.92508 we study and compare its two outbursts of 2009 and 2018. We demonstrate that the X-ray spectrum of both sources has more or less the same shape through the years, which can be modeled using simple but physically motivated models. More importantly, we show that the flux of the Fe K emission detected on top of the continuum is variable by more than an order of magnitude. We discuss this behavior in the context of our 2013 prediction for Fe line variability in C/O-rich UCXBs and utilize our findings to further scrutinize and extend our initial hypothesis.
2 Observations, data analysis and results
In this work we revisit archival 1997 RXTE, 2000 Chandra High Energy Transmission Grating (HETG), 2001 XMM-Newton and 2017 NICER observations of 4U 1543624 and 2009 RXTE and 2017 XMM-Newton/NuSTAR observations of Swift J1756.92508 . Details of the observations are tabulated in Table 1. We note that in the case of the RXTE and NICER observations there are multiple pointings within a period of several days during the source outburst. We have reviewed all available observations and selected those presented Table 1 based on their high number of registered counts. We have verified that within all data sets, the source was observed in the same spectral state. Analysis of the source spectra was carried out using the XSPEC X-ray spectral fitting package, Version 12.9.1 (Arnaud, 1996).
2.1 Modeling the X-ray spectral continuum
In this analysis we use a combination of multi-color disk black body and nominal black body spectral components to model the X-ray emission continuum of our two sources. Our choice of the two thermal models is motivated by the expectation of an accretion disk that reaches all the way onto the NS surface on which it forms a layer of hot optically thick plasma. This assumption relies on long established theoretical considerations (e.g., Sunyaev & Shakura, 1986; Sibgatullin & Sunyaev, 2000) and a strong observational record of the presence of two thermal components in soft state NS-XRBs with low magnetic fields (e.g., Mitsuda et al., 1984; White et al., 1988; Mitsuda et al., 1989; Barret, 2001; Lin et al., 2007; Revnivtsev et al., 2013).
Despite the simplicity of our spectral models, we are confident that their parameters describe actual physical characteristics of the system (i.e. temperature and size of emitting regions). Therefore we pay particular attention to the accuracy of fit derived values. We are particularly interested in the ionization state of the optically thick matter, while ensuring that the derived quantities are sensible in the context of accreting low magnetic field (low-B) NSs, i.e., temperature and inner disk radius commensurate with the size of the NS and the formation of the layer of hot (1 keV) optically thick plasma on its surface (e.g., Popham & Sunyaev, 2001). For these reasons it is important to take into account the effects of very high temperature ( K) on the spectral shape of the thermal emission.
At this temperature range, most of the lighter elements in the upper disk layers will become fully ionized (see Section 3) resulting in an abundance of hot free electrons that significantly increase the impact of photon-electron scattering within the disk and boundary layer. The process modifies the black body spectrum, which – to the first approximation – appears ”harder” than it actually is. With respect to the spectral analysis – when modelling the continuum with typical thermal models such as diskbb or bbodyrad – our estimations of disk temperature and radius will deviate from their actual values. This issue is often called ”spectral hardening” and is usually addressed by applying a correction factor () to the temperature and normalization of the thermal models (i.e. diksbb and bbodyrad (London et al., 1986; Lapidus et al., 1986; Shimura & Takahara, 1995). Namely,
| (1) |
and
| (2) |
where is the temperature of the MCD component and is the inner radius. The value of has been obsessionally constrained between and 2.1 (e.g., Zimmerman et al., 2005, and references therein). In the following analysis we present all best fit values without correcting for the expected spectral hardening (i.e. ).the effects of a more realistic value of on the best-fit estimated values of disk temperature and inner radius are discussed in Section 3.
2.2 X-ray spectroscopy of 4U 1543-624
2.2.1 XMM-Newton April 2001 observation

XMM-Newton observed 4U 1543624 in April of 2001. All onboard instruments were operational. Namely, MOS1 and pn were operating in Timing Mode and MOS2 in Small Window Mode. All detectors had the Medium optical blocking filter on. In Timing mode, data are registered in one dimension, along the column axis, which results in significantly shorter CCD readout time (0.06 ms for Timing mode, instead of 5.7 ms of the Small Window mode). In addition to increased time resolution, the use of Timing mode may protect observations of bright sources from pile-up111For more information on pile-up see: http://xmm2.esac.esa.int/docs/documents/CAL-TN-0050-1-0.ps.gz.
Spectral extraction and analysis.
Spectra from all detectors were extracted using the latest XMM-Newton Data Analysis software SAS, version 15.0.0. and using the calibration files released222XMM-Newton CCF Release Note: XMM-CCF-REL-334 on May 12, 2016. All observations were checked for high background flaring activity. To this end, we extracted high energy light curves (E10 keV for MOS and 10E12 keV for pn) with a 100 s bin size. A review of the lightcurves revealed no evidence of high energy flares in any of the detectors. The spectral extraction was done using SAS task evselect, with the standard filtering flags (#XMMEA_EP && PATTERN<=4 for pn and #XMMEA_EM && PATTERN<=12 for MOS). SAS tasks rmfgen and arfgen were used to create the redistribution matrix and ancillary file. MOS2 data suffered from pile-up and for this reason they were rejected. Furthermore, because the effective area of pn at 7 keV is approximately five times higher than that of MOS and since the main interest of this work lies in this energy range, we opted to only use the pn data for our analysis. 4U 1543624 is known to exhibit a complex emission and an absorption-like spectrum below 1 keV.
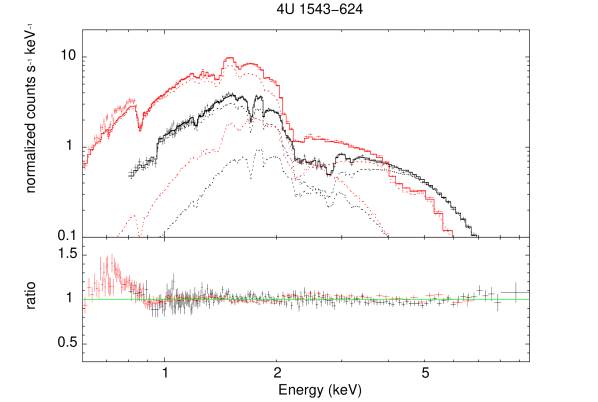
Several studies have indicated the presence of strong emission lines below 1 keV, as well as pronounced absorption edges, which are attributed to fluorescent emission and/or absorption from highly non-solar C/O or O/Ne/Mg-rich material transferred onto the NS by its degenerate donor (e.g., Juett et al., 2001; Juett & Chakrabarty, 2003; Madej & Jonker, 2011). The spectral models described in this section were applied to the entire energy range available from all detectors and we confirm the presence of soft emission-like features consistent with highly ionized oxygen. The emission-like feature is presented in Figure 1 for the Chandra observation of 4U 1543624 (i.e., normalized counts and data-to-model ratio vs energy, without accounting for the 0.68keV emission line reported by previous authors) and in Figure 2 for the XMM-Newton data where again the broad emission-like feature and potential absorption edges are evident in the ratio plot. Modeling the residuals with a gaussian emission line confirms the presence of a line centered at keV with a width of 70.9 eV (in the 90% confidence range). Nevertheless, the analysis of these features is not the focus of our study and since ignoring the energy channels below 1 keV simplifies our analysis without affecting our parameter estimations, all tabulated best-fit values are for the spectral analysis of energy channels above 1 keV. This decision was made after confirming that the best-fit values for the soft thermal component (diskbb model) are well constrained in the 1-10 keV range. Indeed our broadband analysis yielded kTin and disk normalization values consistent, within the 90% confidence range, with the 1-10 keV fit. The best-fit values are also consistent within broadband models that include or omit the 0.68 keV gaussian emission line. For a detailed study of the atomic features and absorption edges in the low energy part of the spectrum of 4U 1543624 , we refer the reader to the works of Juett & Chakrabarty (2003), Madej & Jonker (2011) and most recently Ludlam et al. (2019).
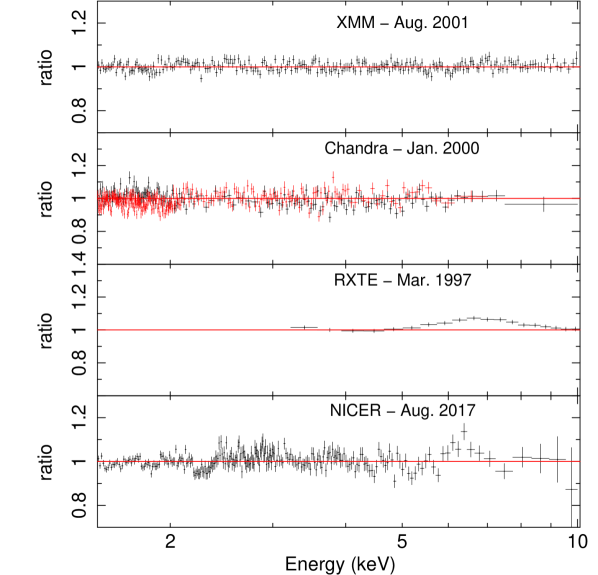
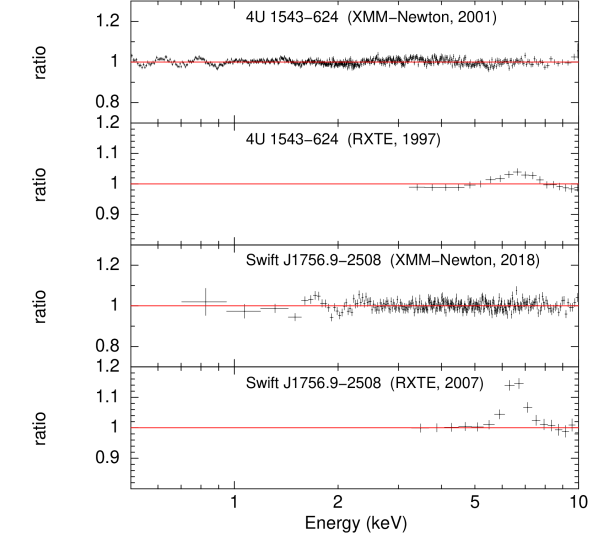
We fit the 1–10 keV spectral continuum with a combination of absorbed black body (xspec model bbodyrad) and disk black body (xspec model diskbb) components. The interstellar absorption was modeled using the improved version of the tbabs code333http://pulsar.sternwarte.uni-erlangen.de/wilms/research/tbabs/ (Wilms et al., 2000). The hydrogen column density (nH) was frozen at the value provided by the HEASARC nH tool (HI4PI Collaboration et al., 2016). The fit yields a reduced value of 1.04 for 1858/1795 dof, and the data-to-model ratio plot does not indicate emission-like residuals in the entire 1–10 keV region (Figure 3). Temperature of the disk black body is 0.65 keV and the black body temperature is 1.53 keV. There is no evidence of iron K emission, with a upper limit of 2.68 eV on the EW of the line. The source luminosity, extrapolated in the 0.50-30 keV range, is erg/s, for a distance of 7 kpc (Wang & Chakrabarty, 2004). All values of the best fit parameters are presented in Table 2.
2.2.2 RXTE May 1997 observation

There are two RXTE observations of 4U 1543624 , both taken in 1997. The first observation commenced on May 5th and the second on the 22nd of September. Both observations were broken up into multiple intervals. We have analyzed all available observations. However, for better clarity and brevity, we only present the results of the longest (14 ks) observation, taken on May 6th 1997 (P20071-04-01-00).
Spectral extraction and analysis.
RXTE had three on board instruments: the All Sky Monitor (Levine
et al., 1996), the Proportional Counter Array (PCA, Jahoda
et al., 2006a) and the High Energy X-ray Timing Experiment (HEXTE, Rothschild
et al., 1998).
In this work we obtain and analyze the source spectrum from the PCA, which provides the highest energy resolution (18% at 6 keV) in the spectral range of interest (3–20 keV). The PCA detector is comprised of five Proportional Counter Units (PCUs), with a combined effective area of . Each PCU is composed of three layers of xenon (90%) and methane (10%) composites. Most incident photons with energies below 20 keV are detected in the top layer (layer 1) and for this reason we have opted to only extract spectra from this layer. All PCUs were active during the observation, which allowed us to obtain the data of all detectors for the spectral extraction. As per the recommendation444https://heasarc.gsfc.nasa.gov/docs/xte/pca/doc/rmf/pcarmf-11.7/ of the RXTE guest observer facility (GOF), we removed energy channels below 3 keV. Additionally, in our spectral extraction we ignored all channels above 20 keV. The signal-to-noise ratio drops significantly above this threshold, and for this work we are primarily interested in the energy range below 20 keV. Due to the low orbit of RXTE, observations are occasionally affected by the satellite’s passage through the South Atlantic Anomaly (SAA) or by Earth occultation of the observed source. Data may also be affected by electron contamination and sporadic breakdowns of the PCU2 detector. For the spectral extraction we filtered out intervals where the elevation angle was less than 10 degrees (to avoid possible Earth occultations) and also any data that may have been received during passage from the SAA. Furthermore, we excluded any data affected by electron contamination, where offset by more than 0.02 degrees or taken 150 seconds before, through 600 seconds after a PCU2 breakdown. Source spectra were extracted and background emission was modeled using standard routines from the FTOOLS package and the latest model for bright sources, provided by the GOF555http://heasarc.gsfc.nasa.gov/docs/xte/pca_news.html.
All spectra were re-binned to a minimum of 30 counts per bin.
The spectral continuum is again modeled with a similar combination of absorbed disk black body and black body emission, and a hydrogen column density (nH) frozen at the Galactic value. The fit yields a reduced value of 1.66 for 41 dof, and the data-to-model ratio plot reveals strong positive residuals in the 6-7 keV region (Figure 8). The residual structure – a strong indication of a bright iron K emission line – is modeled using a Gaussian. The high energy range of RXTE/PCA ( keV) allowed us to also probe the non-thermal tail of the 4U 1543624 spectrum, which we modeled using a power law with a spectral index of and a high energy exponential cutoff at keV. The final fit yields a reduced value of 0.44 for 38 dof (Figure 4 for the 3-20 keV best-fit plot). The temperature of the disk black body is keV and for the black body is keV. The iron emission line is centered at keV, has a width of 670 eV and an equivalent width (EW) of eV. The source luminosity, extrapolated to the 0.50-30 keV range, is erg/s. All values of the best fit parameters are presented in Table 2. Findings from the spectral analysis of the XMM-Newton observation (subsection 2.2.1) and RXTE observation (subsection 2.2.2) are also briefly presented in our comprehensive analysis of the entire UCXB catalog in (Koliopanos et al., 2020, accepted for publication in MNRAS).
2.2.3 Chandra December 2000 observation
The Chandra X-ray Observatory observed 4U 1543624 four times. Once in December of 2000, using the HETG and three more times in June 2012, using the Low Energy Transmission Grating (LETG). Below we outline the spectral extraction and analysis for the 2000 HETG observation.
Spectral extraction and analysis.
Using the tools included in the latest version of the CIAO software (vers. 4.8), we extract spectra from both the medium energy grating (MEG) and the high energy grating (HEG). Namely, upon selecting an appropriate extraction region and taking into account the correct source position and telescope orientation during the entire observation, we use CIAO task tgextract to create a standard type II spectral file, containing all spectral orders of both the MEG and HEG detectors, and mktgresp to create their corresponding ancillary files and response matrices. In order to analyze the spectra with XSPEC, we create separate type I PHA files for the MEG and HEG spectra, simultaneously adding the +1 and -1 grating orders and rebinning them to a minimum of 30 counts per bin. We also create a separate background spectrum using the task tg_bkg.
The spectral continuum is well modeled with the same combination of absorbed disk black body and black body emission, as in the 1997 RXTE and 2001 XMM-Newton observations. The temperature of the disk black body lies at 0.65 keV and the black body temperature at 1.61 keV. This time, no emission line was detected in the 6-7 keV range and we place a upper limit for the EW of the iron K emission line at 6.13 eV. The double thermal model fit yielded a reduced value of 1.02 for 3703 dof. The source luminosity during the Chandra observation, was erg/s, calculated in the 0.50-30 keV range and assuming a distance of 7 kpc. All values of the best fit parameters are presented in Table 2.
| Instrument | obsID | Date | Duration1 | |
|---|---|---|---|---|
| (ks) | ||||
| 4U 1543624 | ||||
| RXTE | P20071 | 1997-05-06 | 14 | |
| Chandra | 702 | 2000-09-12 | 30 | |
| XMM-Newton | 0061140201 | 2001-02-04 | 50 | |
| NICER | 1050060106 | 2017-08-20 | 13 | |
| Swift J1756.92508 | ||||
| RXTE | P92050 | 2007-06-16 | 12 | |
| XMM-Newton | 0830190401 | 2018-04-08 | 65 | |
| NuSTAR | 90402313002 | 2018-04-08 | 40 |
1Duration of filtered observations.
2.2.4 NICER Sept. 2017 observation
4U 1543624 was observed with NICER in 13 separate pointings over 10 days starting on August 15 2017. Here we analyse obsID 1050060106, which at a duration of 13 ks, provides the highest number of total counts after the standard event filtering described below.
Spectral extraction and analysis.
The Neutron Star Interior Composition Explorer (NICER; Gendreau et al. 2012) operates on-board the International Space Station and consists of 56 “concentrator” optics and silicon drift detector pairs registering X-ray photons in the keV energy range. The 52 operating collectors comprise a total collecting area of cm2 at 1.5 keV. nicerdas 2018-10-07_V005 was employed for the data reduction process. Namely, using nimaketime we created appropriate good time intervals (GTIs), by filtering out all raw data with the standard criteria using various housekeeping parameters (see Bogdanov
et al. 2019; Guillot
et al. 2019, for more details). The final event list was extracted using niextract-events for PI energy channels between 40–1200, inclusive, and EVENT_FLAGS=bxxx1x000 as per the NICER manual guidelines. For the spectral extraction we used the heasoft tool xselect. The spectra were subsequently normalized based on the instrumental residuals calibrated from the Crab Nebula, as described in Ludlam
et al. (2018).
The background spectrum was generated from a library of NICER observations of ”blank sky” fields (the same ones as for RXTE, Jahoda et al. 2006b). Specifically, a weighted-average of these ”blank sky” observations with a similar combinations of observing conditions as our target’s data set is used to produce the diffuse cosmic X-ray background spectrum666This background modeling technique is detailed in Bogdanov et al. (2019). The latter is also normalized with the Crab Nebula residual spectrum. Finally, the latest ARF and RMF files were kindly provided by the NICER GOF (these are now publicly available as NICER XTI Calibration Files: 20200722 in the heasarch website).
Observed by NICER, almost two decades after the XMM-Newton observations, the spectral continuum of 4U 1543624 is qualitatively the same as in all previous observations and was again modeled with the same combination of absorbed disk black body and black body emission. The accretion disk temperature of the disk black body is closer to its value during the RXTE observation, at 0.80 keV as is the black body temperature which is estimated at 1.80 keV. The iron K emission line has reappeared in the source spectrum, indicated by positive residual structure in the data-to-ratio vs energy plot in Figure 3. The emission line was modeled with a Gaussian centered at keV, with a width of 160 keV and an EW of eV. The double thermal model including the Gaussian emission line yielded a reduced value of 1.07 for 743 dof. The source luminosity during the NICER observation, was erg/s, calculated in the 0.50-30 keV range and assuming the distance of 7 kpc. All values of the best fit parameters are presented in Table 2.
| Model parameter | RXTE-PCA 1997a | Chandra 2000 | XMM-Newton 2001 | NICER 2017 |
|---|---|---|---|---|
| nHb () | 0.29 | 0.29 | 0.29 | 0.29 |
| Disk Black Body | ||||
| kTin (keV) | 0.80 | 0.71 | 0.65 | 0.79 |
| (km) | 9.02 | 12.2 | 13.6 | 10.3 |
| Black Body | ||||
| kTBB (keV) | 1.81 | 1.61 | 1.53 | 1.80 |
| norme | 7.48 | 7.00 | 9.54 | 4.26 |
| Iron Line | ||||
| Centroid E (keV) | 6.58 | 6.6f | 6.6f | 6.47 |
| Width (eV) | 678 | 160 | ||
| Fluxg | 95.1 | 31.5 | ||
| EW (eV) | 99.3 | 61.3 | ||
| 6.65 | 6.14 | 5.14 | 6.00 | |
| 1.56 | 2.48 | 2.78 | 3.35 | |
| 3.82 | 3.76 | 2.37 | 2.54 | |
| 1.13 | – | – | – | |
| 16.9/38 | 3762/3703 | 1858/1795 | 807/743 |
a With an additional cutoff power law ( and keV), for the RXTE data
b Parameter frozen at total galactic H I column density provided by the HEASARC nH tool (HI4PI Collaboration et al., 2016).
c .
d Solving K=, for (the inner radius of the disk in km). K is the normalization of the diskbb model, is the spectral hardening factor, is distance in units of 10 kpc and is the inclination. In the tabulated values we have set .
e where is the size of the emitting region in km and is distance in units of 10 kpc.
f Parameters frozen. The centroid energy value was frozen at the median value of the 6.4-6.9 keV range, for a step of 0.1 keV and width value based on average width of observed Fe K emission lines in LMXBs (e.g., Cackett et al., 2009; Ng et al., 2010).
g .
2.3 X-ray spectroscopy of Swift J1756.9-2508
2.3.1 RXTE June 2007 observation

There are two sets of RXTE observations of Swift J1756.92508 carried out in 2007 when the source was first detected, and in 2009 during its second outburst. We have reviewed all available data and present here our analysis of the 2007 observation with the higher number of registered counts. For a thorough study of the entire RXTE observation campaign of Swift J1756.92508 we refer the reader to the works of Krimm
et al. (2007) and Patruno et al. (2010).
Spectral extraction and analysis.
The extraction procedure for the RXTE/PCA spectra of Swift J1756.92508 is identical to the one described in paragraph 2.2.2.
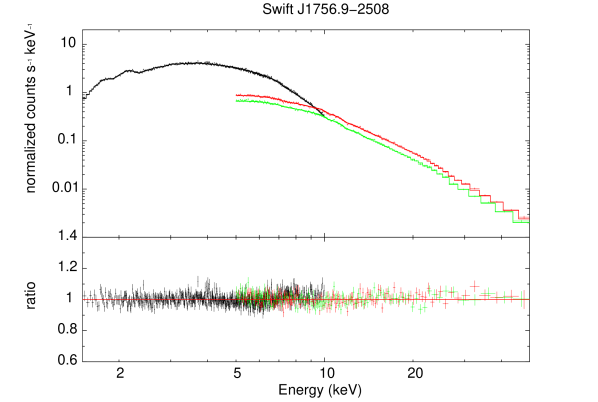
The X-ray spectrum of Swift J1756.92508 during its 2007 outburst is also described by a combination of two absorbed thermal components, which is consistent with the high-luminosity soft-state spectra of weakly magnetized NS LMXBs (e.g., Lin
et al., 2007). As expected for a source in the direction of the Galactic bulge there is considerable interstellar absorption in the line of sight to Swift J1756.92508 , with nH cms (HI4PI
Collaboration et al., 2016). The accretion disk temperature was estimated at 1.1 keV and the temperature of the black body component at 2.3 keV.
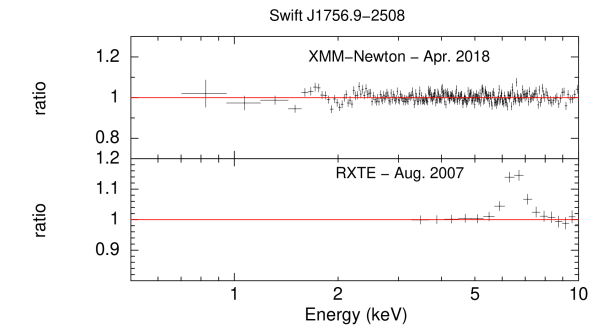
A prominent iron K emission line is clearly detected above the spectral continuum (see Figure 8 for the data-to-model vs energy plot). The emission line is centered at keV, and has an EW of keV. The width of the emission line is smaller than the RXTE/PCA energy resolution (18% at 6 keV) and was thus frozen to 500 eV. In addition to the thermal emission, the fit required a non-thermal component dominating keV, which was modelled using a power law with spectral index of and a high-energy exponential cutoff at keV. The model yields a reduced value of 0.65 for 30 dof. The source luminosity during the RXTE observation, was erg/s, calculated in the 0.50–30 keV range and assuming a distance of 8.5 kpc, based on the source position toward the direction of the Galactic centre. All values of the best fit parameters along with errors in the 90% confidence range are presented in Table 3.
| Model parameter | RXTE/PCA | XMM-NuSTAR |
|---|---|---|
| 2007 | 2018 | |
| nHa () | 6.05 | 7.28 |
| Disk Black Body | ||
| kTin (keV) | 0.96 | 1.24 |
| (km) | 3.9 | 5.45 |
| Black Body | ||
| kTBB (keV) | 2.27 | 2.79 |
| normc | 12.3 | 1.12 |
| Cutoff Power Law | ||
| 0.97 | 1.39 | |
| norm () | 11.6 | 20.1 |
| (keV) | 11.9 | 22.8 |
| (keV) | 17.4 | 50.6 |
| Iron Line | ||
| Centroid E (keV) | 6.47 | 6.6d |
| Width (eV) | ||
| Fluxe | 42.3 | |
| EW (eV) | 171 | |
| ( erg/s) | 4.87 | 3.67 |
| ( erg/s) | 0.84 | 0.91 |
| ( erg/s) | 1.00 | 0.67 |
| ( erg/s) | 3.13 | 2.59 |
| 19.6/30 | 3255/3141 |
a .
b Solving K=, for (the inner radius of the disk in km). K is the normalization of the diskbb model, is the spectral hardening factor (again for the tabulate values ), is distance in units of 10 kpc and is the inclination.
c where is the size of the emitting region in km and is distance in units of 10 kpc.
d Parameters frozen. The centroid energy value was frozen at the median value of the 6.4-6.9 keV range, for a step of 0.1 keV and width value based on average width of observed Fe K emission lines in LMXBs (e.g., Cackett
et al., 2009; Ng et al., 2010), for the RXTE detection the width is frozen at the instrument’s energy resolution at 6 keV. The two values coincide.
e .
f Luminosity extrapolated to the 0.50-30 keV range and assuming a distance of 8.5 kpc, based on the proximity toward the direction of the Galactic centre .
2.3.2 XMM-Newton/NuSTAR April 2018 observation
Swift J1756.92508 was jointly observed with XMM-Newton and NuSTAR X-ray telescopes during its third and latest outburst in April of 2018.
Spectral extraction and analysis.
During the XMM-Newton observation of Swift J1756.92508 the EPIC-pn detector was again operated in Timing mode and therefore the spectral extraction process is the same as in 4U 1543624 (paragraph 2.2.1). For the NuSTAR data extraction, we used version 1.9.3 of the NuSTAR data analysis system (NuSTAR DAS) and the latest instrumental calibration files from CalDB v20191008. Data were cleaned and calibrated using the NUPIPELINE routine with default settings. The internal high-energy background was reduced and passages through the South Atlantic Anomaly were screened (settings SAACALC3, TENTACLENO and SAAMODEOPTIMIZED). Phase-averaged source and background spectra were extracted using the NUPRODUCTS script, which also produces the instrumental responses for both focal plane modules, FPMA and B. We used a circular extraction region with an 80″ radius for both the source and the background spectra. The latter were extracted from a blank sky region in the same detector as the source and at an adequate distance from it in order to avoid any contribution from the PSF wings. The default PSF, alignment, and vignetting corrections were used.
During the joint XMM-Newton/NuSTAR observation of 2018, Swift J1756.92508 was again detected in the soft-state, with a qualitatively identical spectrum to the 2007 (this work) and 2009 (Patruno et al., 2010) RXTE observations. Exploiting the energy range of XMM-Newton we update the estimation of interstellar absorption to a value of nH cm-2. The accretion disk temperature was estimated at 1.2 keV and the temperature of the black body component at 2.8 keV. The non-thermal, power-law shaped component of the spectrum had a spectral index of and an exponential drop-off at keV. Despite the similarity in the spectral continuum, the prominent Fe K emission line detected in both the 2007 and 2009 RXTE observations had disappeared in the 2018 observation. We place a upper limit of 7.36 eV for the EW of the iron K emission line. The model for the continuum emission yielded a reduced value of 1.03 for 3141 dof. The source luminosity during the 2018 XMM-Newton/NuSTAR observation, was erg/s, calculated in the 0.50-30 keV range and assuming the distance of 8.5 kpc. All values of the best fit parameters along with errors in the 90% confidence range are presented in Table 3.
3 Discussion
We have analyzed the high-energy spectra of 4U 1543624 and Swift J1756.92508 during different periods in their observational history. In all observations, the sources appeared to have been captured in an accretion dominated (soft) state. In this state the accretion disk is extending close to the compact object (in our case a NS) and the observed spectrum is dominated by thermal emission. We have modeled the spectra of both sources using a combination of a multicolor disk black body and a black body model with a very high temperature (with the addition of a non-thermal tail when required). The choice for this model is motivated by the well established theoretical framework for accretion onto low-B NSs and the formation of a hot optically thick layer of material on the NS surface, known as the boundary layer (e.g., Sunyaev & Shakura, 1986; Popham & Sunyaev, 2001; Gilfanov et al., 2003). The boundary layer is a transition region between the rapidly spinning accretion disk and the NS which is rotating at a slower rate. The optically thick matter that accumulates on the NS surface is predicted to have a temperature of keV, producing thermal emission that accounts for a significant fraction of the total accretion luminosity.
The most notable narrow emission feature detected on top of the spectral continuum (in the energy range keV) was a prominent and broad Fe K emission line, centered at keV. The iron emission line is observed in both sources during two different instances and in the case of 4U 1543624 by two different instruments. In general, the presence of iron emission is a common characteristic in the X-ray spectra of accreting compact objects and is the result of ”reflection” of X-rays from the surface of the accretion disk (e.g., see Done et al., 2007; Gilfanov, 2010, and references therein). Namely, hard X-rays are reflected off the accretion disk, and the reflected component is registered along with the primary disk emission. The Fe K line is the result of this reflection, as a fraction of high energy photons – that are “absorbed” by iron atoms – are remitted at the energy corresponding to the electron transition from the 2p orbital of the L-shell to the innermost K-shell. While the detection of iron fluorescence in X-ray spectra of LMXBs – such as 4U 1543624 and Swift J1756.92508 – is a frequent and expected occurrence, a much more extraordinary event, is the fact that the emission line seems to have disappeared during some of the available observations.
3.1 Fe K line variability and the spectral state of the two UCXBs
The spectral continuum of 4U 1543624 displays a remarkable consistency throughout all available observations, which have been carried out over two decades. Within our interpretation for the origin of the emission in 4U 1543624 , the bulk of the 0.5-10 keV emission appears to be produced by an accretion disk with a temperature of 0.6-0.8 keV and an inner disk radius of the order of 10 km and an additional, hot thermal source with a keV temperature. The luminosity of the source has varied moderately by a factor of up to 25%, and any minor variability of its spectrum is mostly manifested in the relative flux of each spectral component. Over the course of its observational history, the spectrum of 4U 1543624 has been modelled using a variety of different models, including black body, disk black body models, power-law components with high energy cutoffs below 10kev, as well as broken power-laws with two spectral indexes, or more complex X-ray reflection models (e.g., Schultz, 2003; Farinelli et al., 2003; Madej & Jonker, 2011; Madej et al., 2014). We argue that the simplicity and long term consistency of our chosen model, combined with the fact that it yields physically realistic estimations of key emission parameters (see below), favors our interpretation for the origin of the source emission. During the 1997 RXTE observation we detected a Fe K emission line with an EW of eV, which is not present in either the Chandra or XMM-Newton spectra with a stringent EW upper limit of 6.13 eV and 2.86 eV, respectively. The line is detected again in the 2017 NICER observation with an EW of eV.
For Swift J1756.92508 , we consider the same interpretation for the origin of the spectral continuum as for 4U 1543624 . This source also appears to have a stable spectral shape during its three recorded outbursts (in this work we present the 1st and 3rd outburst, for the 2nd outburst see Patruno et al. 2010). However, we do note the detection of minor, in the temperatures of the thermal components; keV in RXTE vs 1.24 keV in the XMM-Newton/NuSTAR data (the values are consistent within the 90% range) and 2.3 keV vs 2.8 keV for the thermal emission (the values are consistent in the 2 range) and a moderate variability (order of in the relative flux of the hot thermal component between observations. Nevertheless, as in the case of 4U 1543624 , the most striking difference between the Swift J1756.92508 spectrum of 2018 and the one of 2007 is the disappearance of the prominent Fe K line. Namely, the bright iron emission line detected in the 2007 RXTE observation with an EW of 170 eV, is not detected during the 2018 XMM-Newton/NuSTAR observation with an EW upper limit of 7.36 eV. We also note a 25% variation of the total source flux.
A crucial factor for establishing the reliability of our interpretation of the spectral continuum in both sources – and more importantly for identifying the cause for the notable variability of the strength of the iron emission line – is the rigorous estimation of true values of its spectral parameters, i.e., the temperature and inner radius of the accretion disk. To further assess the plausibility of our best-fit estimations, it is also important to compare our findings with theoretical expectations. In two of the Swift J1756.92508 observations (RXTE and NICER), the best value of the inner disk radius is measured in the 8-10.5 km range, while for Swift J1756.92508 they range between 4 and 6 km. These estimations lie below the value of the NS radius which is 9-15 km depending on the equation of state of the NS (e.g., Özel & Freire, 2016, and references therein), and therefore appear to be unrealistically small. Nevertheless, we note that in all tabulated values we have not considered the necessary corrections of the thermal component parameters due the spectral hardening expected from the high plasma temperature. Correcting the inner radius estimations, assuming a moderate value of 1.8 for the spectral hardening factor (see Section 2.1), yields values in the km for the entire set of observations, which is the typical size for an accreting low-B NS in the soft state.
Therefore within this framework, the presence of iron K fluorescence in the spectra of 4U 1543624 and Swift J1756.92508 is the result of illumination of the inner accretion disk by the boundary layer emission. Since the iron line is produced by X-ray reflection, its shape and strength are highly sensitive to the geometrical arrangement between the source of the primary emission (e.g., the boundary layer) and the accretion disk. Modification of the size and temperature of the emitting region, the inner radius of the accretion disk and the direction of the hard X-ray emission, will affect the size and location of the illuminated region of the disk. These effects will become especially pronounced in case of spectral state transition towards the so called ”hard” state of accretion, were the disk recedes from the central source, giving way to the formation of an extended region of advection-dominated, optically thin radial flow. This ”corona” consisting of very hot electrons produces copious amounts of non-thermal photons, resulting in a spectrum that is dominated by the power-law shaped component. Therefore, state transitions can have profound effects on the strength of the iron emission line (e.g., Ng et al., 2010; Cackett et al., 2010; Kolehmainen et al., 2014). Similar effects can also be observed in accreting highly magnetized NS (i.e., high-B, X-ray pulsars), where variations in the accretion rate affect the size of the magnetoshere, the inner disk radius and the direction of the pulsar beam, resulting in pronounced variability in the iron line strength (e.g., Koliopanos & Gilfanov, 2016). Therefore the striking variability of the iron line as observed in 4U 1543624 and Swift J1756.92508 are expected to occur in tandem with major modification of the spectral continuum and/or the source luminosity.
However, one of the main findings of our analysis, is the notable stability of the spectrum and luminosity of both sources throughout the different observations with or without the presence of iron K fluorescence. This suggests that the attenuation of the iron line is not caused by a ”macroscopic” transition in the accretion state of the source, but is likely the result of a more subtle microscopic process. To our knowledge such remarkable emission line variability in an otherwise stable X-ray binary has not been previously observed. However, the possibility of this phenomenon had been hypothesized by Koliopanos et al. (2013) for UCXBs with C/O-rich donors.
3.2 Variability of the Fe Ka line in UCXBs with C/O-rich donors
In Koliopanos et al. (2013), it was demonstrated that the Fe K emission line in the spectra of UCXBs with C/O-rich donors, is expected to be strongly attenuated, with expected values of the EW to be less than eV. The attenuation of the iron emission line is primarily due to the presence of overabundant oxygen777The maximum value of the O/Fe ratio corresponding to the chemical composition of a C/O white dwarf – in which all hydrogen and helium has been converted to carbon and oxygen – is 77 times the solar value. in the accreting material. Namely, contrary to accretion disks with solar-like abundance, in the C/O-rich disks, absorption of photons with energies equal to or higher than the ionization threshold of iron (E keV), is dominated by oxygen rather than by iron. This results in the strengthening of the oxygen emission line (centered at keV) and the strong attenuation of the iron line. More specifically, after running the MCMC code of Koliopanos et al. (2013) for an incident 1 keV black body spectrum and for a range of observer viewing angles between and , we find that an O/Fe ratio of at least 50 times the solar value, is required to explain the absence of a Fe K line at an EW upper limit of 8 eV. This screening effect, will hold, as long as the oxygen in the accretion disk is not fully ionized.
The ionization state of elements in the disk was not self-consistently treated in the model developed by Koliopanos et al. (2013). However, the effects of the ionization state of the disk were discussed – under a set of specific assumptions. Namely, we considered that the ionization state of the disk is determined solely by heating due to viscous dissipation as illustrated in the Shakura & Sunyaev (1973) formulation. We have ignored the effects of disk irradiation by assuming the conditions described in the Nayakshin et al. (2000) analysis, predicting the formation of a thin, fully ionized layer on the disk surface which is dominated by X-ray illumination, while the temperature of deeper disk layers remain unaffected. Within this regime, Koliopanos et al. (2013) roughly estimated that during the soft state and for a mass accretion rate () corresponding to of the order of a few erg/s, oxygen could become fully ionized in the accretion disk of an UCXB, thus canceling its screening effect on the iron line. Within this framework the iron line variability in UCXBs is luminosity dependent.
More specifically assuming an optically thick, geometrically thin disk following the Shakura-Sunyaev -disk model, the effective temperature of the disk is given by
| (3) |
where is the Stefan-Boltzmann constant, is the mass of the accretor ( for a neutron star), the mass accretion rate and is the inner radius of the disk, which in the case of the soft state of a neutron star is close to its radius. For a moderate , (corresponding to erg/s), the temperature of the inner parts of the disk (up to 15 ; where Rg is the gravitational radius ) will range between 5-8 K. In addition to heating due to viscous dissipation, if the accretion disk forms a boundary layer near the surface of the NS, it will cause a dissipation of the kinetic energy of the inner disk rings, which in turn will result in the inflation and heating of the innermost part of the disk (Inogamov & Sunyaev, 1999). Inogamov & Sunyaev (1999) calculate that the inner disk will be heated to K as the boundary layer forms. When the temperature reaches K – and assuming that the disk plasma is in collisional ionization equilibrium, in a coronal approximation – 90%-100% of oxygen will be fully ionized (Shull & van Steenberg, 1982).
The above analytical estimations demonstrate, that for typical conditions that can be met by moderately bright UCXBs, it is very likely that a considerable fraction of the inner accretion disk can reach a high enough temperature for all oxygen to become fully ionized. Although there is considerable uncertainty in the distance estimation for our two sources – different estimations place 4U 1543624 anywhere between 1.4-11.5 kpc (Serino et al., 2018; Bailer-Jones et al., 2018), while Swift J1756.92508 is assumed to be at a distance of 8.5 kpc due to its proximity to the galactic bulge – we can robustly place both sources in the in the erg/s range. From our analysis, the color-corrected, maximum disk temperature obtained by the diskbb model, during the epochs when the line is detected is K for 4U 1543624 and K for Swift J1756.92508 (we note that diskbb is only an approximation of the full Shakura & Sunyaev (1973) treatment).
The X-ray luminosity of both sources is marginally lower than the rough threshold of suggested by Koliopanos et al. (2013). Similarly the spectroscopic estimations of the accretion disk lies below the KeV value for the full ionization of 100% of the disk oxygen, but only marginally so. If we also take into account that the state-of-the-art Monte-Carlo simulations of X-ray reflection (e.g., García & Kallman, 2010; García et al., 2011; García et al., 2013) indicate that X-ray irradiation can increase the disk ionization at deeper layers than the Nayakshin et al. (2000) estimations, we can reasonable assume that our sources lie exactly at the threshold between having most of their oxygen partially ionized (suppression of Fe K line) to fully ionized (re-appearance of Fe K line). We note that in both cases the overabundance of oxygen expected in the C/O-rich disk (50–80 times the Solar value) ensures the presence of notable a fluorescent line even when most of it becomes fully ionized (although the actual detection of such a feature depends on multiple additional parameters; see discussion in Koliopanos et al. 2013). Indeed this line is detected at 0.68keV in 4U 1543624 , where the low absorption allows for its detection (see Figure 1 and refer to Ludlam et al. 2019 for an analysis of the NICER observation).
We argue that the disappearance of the iron line occurring within an otherwise non-variable spectral state, is a strong indication that 4U 1543624 and Swift J1756.92508 are both C/O-rich UCBXs observed at the threshold at which the screening of the iron line ceases to exist. As a result of this precarious state, subtle variations on the parameters of the accretion process, may lead to an increase in the fraction of fully ionized oxygen, evidenced by the reappearance of the iron emission line. Besides this striking variability in the Fe K line flux, the change in the ionization state has negligible effects on other observables. We consider this discovery an encouraging result with respect to the Koliopanos et al. (2013) theoretical predictions on X-ray reflection off H-poor disks in UCXBs and their potential use as a diagnostic of the composition of the accretion disk and donor star in these sources.
4 Summary and conclusions
We have analyzed multiple observations of known UCXBs 4U 1543624 and Swift J1756.92508 , carried out at different eras within a 20 year period and with different instruments. We have demonstrated that both sources (one is a persistent and the other a transient source), exhibit a remarkable stability of the shape of their spectral emission and their X-ray luminosity (during outburst). Nevertheless, we also detected a pronounced difference in the spectral characteristics at different epochs, in the form of a striking variability in the strength of the iron K emission line. Namely, the emission line is either detected as a prominent feature with an EW of 100-170 eV, or completely disappears with an EW upper limit of less than 8 eV. Based on the stability of the spectral shape and flux of both sources throughout the different observations, and on the values of their spectral parameters, we have attributed the iron line variability to a change in the ionization state of oxygen in the inner accretion disk regions. Namely, subtle variations of the accretion disk parameters can lead to a transition from partially to fully ionized oxygen in the disk, which in turn affects the strength of the iron line, as has been predicted for UCXBs with C/O-rich donors by Koliopanos et al. (2013). We argue that this behavior supports the theoretical arguments of this work and favors the C/O-rich classification of the UCXBs 4U 1543624 and Swift J1756.92508 .
Acknowledgements
The French team are grateful to Centre National d’Études Spatiales (CNES) for their support in the work related to XMM-Newton, NuSTAR and NICER. F.K. extends his deep gratitude to the referee and editor of this paper, for significantly contributing to its final form, but more importantly for their patience and understanding during a prolonged pause in the refereeing process, which was caused by F.K., due to an unforeseen personal issue.
Data availability
The observational data underlying this article are publicly available at the XMM-Newton Science Archive888http://nxsa.esac.esa.int/nxsa-web/. Any details with regard to the Monte Carlo source code can be shared on reasonable request to the corresponding author.
References
- Arnaud (1996) Arnaud K. A., 1996, in Jacoby G. H., Barnes J., eds, Astronomical Society of the Pacific Conference Series Vol. 101, Astronomical Data Analysis Software and Systems V. p. 17
- Bailer-Jones et al. (2018) Bailer-Jones C. A. L., Rybizki J., Fouesneau M., Mantelet G., Andrae R., 2018, AJ, 156, 58
- Barret (2001) Barret D., 2001, Advances in Space Research, 28, 307
- Bildsten & Deloye (2004) Bildsten L., Deloye C. J., 2004, ApJ, 607, L119
- Bogdanov et al. (2019) Bogdanov S., et al., 2019, ApJ, 887, L25
- Bult et al. (2018a) Bult P., et al., 2018a, ApJ, 864, 14
- Bult et al. (2018b) Bult P. M., et al., 2018b, The Astronomer’s Telegram, 11502, 1
- Cackett et al. (2009) Cackett E. M., et al., 2009, ApJ, 690, 1847
- Cackett et al. (2010) Cackett E. M., et al., 2010, ApJ, 720, 205
- Deloye & Bildsten (2003) Deloye C. J., Bildsten L., 2003, ApJ, 598, 1217
- Deloye et al. (2005) Deloye C. J., Bildsten L., Nelemans G., 2005, ApJ, 624, 934
- Done et al. (2007) Done C., Gierliński M., Kubota A., 2007, A&ARv, 15, 1
- Farinelli et al. (2003) Farinelli R., et al., 2003, A&A, 402, 1021
- García & Kallman (2010) García J., Kallman T. R., 2010, ApJ, 718, 695
- García et al. (2011) García J., Kallman T. R., Mushotzky R. F., 2011, ApJ, 731, 131
- García et al. (2013) García J., Dauser T., Reynolds C. S., Kallman T. R., McClintock J. E., Wilms J., Eikmann W., 2013, ApJ, 768, 146
- Gendreau et al. (2012) Gendreau K. C., Arzoumanian Z., Okajima T., 2012, The Neutron star Interior Composition ExploreR (NICER): an Explorer mission of opportunity for soft x-ray timing spectroscopy. SPIE, p. 844313, doi:10.1117/12.926396
- Gilfanov (2010) Gilfanov M., 2010, in Belloni T., ed., Lecture Notes in Physics, Berlin Springer Verlag Vol. 794, Lecture Notes in Physics, Berlin Springer Verlag. p. 17, doi:10.1007/978-3-540-76937-8˙2
- Gilfanov et al. (2003) Gilfanov M., Revnivtsev M., Molkov S., 2003, A&A, 410, 217
- Guillot et al. (2019) Guillot S., et al., 2019, ApJ, 887, L27
- HI4PI Collaboration et al. (2016) HI4PI Collaboration et al., 2016, A&A, 594, A116
- Iben et al. (1995) Iben Jr. I., Tutukov A. V., Yungelson L. R., 1995, ApJS, 100, 233
- Inogamov & Sunyaev (1999) Inogamov N. A., Sunyaev R. A., 1999, Astronomy Letters, 25, 269
- Jahoda et al. (2006a) Jahoda K., Markwardt C. B., Radeva Y., Rots A. H., Stark M. J., Swank J. H., Strohmayer T. E., Zhang W., 2006a, ApJS, 163, 401
- Jahoda et al. (2006b) Jahoda K., Markwardt C. B., Radeva Y., Rots A. H., Stark M. J., Swank J. H., Strohmayer T. E., Zhang W., 2006b, ApJS, 163, 401
- Jones (1977) Jones C., 1977, ApJ, 214, 856
- Juett & Chakrabarty (2003) Juett A. M., Chakrabarty D., 2003, ApJ, 599, 498
- Juett & Chakrabarty (2005) Juett A. M., Chakrabarty D., 2005, ApJ, 627, 926
- Juett et al. (2001) Juett A. M., Psaltis D., Chakrabarty D., 2001, ApJ, 560, L59
- Kolehmainen et al. (2014) Kolehmainen M., Done C., Díaz Trigo M., 2014, MNRAS, 437, 316
- Koliopanos & Gilfanov (2016) Koliopanos F., Gilfanov M., 2016, MNRAS, 456, 3535
- Koliopanos et al. (2013) Koliopanos F., Gilfanov M., Bildsten L., 2013, MNRAS, 432, 1264
- Koliopanos et al. (2014) Koliopanos F., Gilfanov M., Bildsten L., Trigo M. D., 2014, MNRAS, 442, 2817
- Koliopanos et al. (2020) Koliopanos F., Peault M., Vasilopoulos G., Webb N., 2020, arXiv e-prints, p. arXiv:2001.00716
- Krimm et al. (2007) Krimm H. A., et al., 2007, ApJ, 668, L147
- Kuiper et al. (2018) Kuiper L., Tsygankov S., Falanga M., Galloway D., Poutanen J., 2018, The Astronomer’s Telegram, 11603, 1
- Lapidus et al. (1986) Lapidus I. I., Syunyaev R. A., Titarchuk L. G., 1986, Soviet Astronomy Letters, 12, 383
- Levine et al. (1996) Levine A. M., Bradt H., Cui W., Jernigan J. G., Morgan E. H., Remillard R., Shirey R. E., Smith D. A., 1996, ApJ, 469, L33
- Lin et al. (2007) Lin D., Remillard R. A., Homan J., 2007, ApJ, 667, 1073
- London et al. (1986) London R. A., Taam R. E., Howard W. M., 1986, ApJ, 306, 170
- Ludlam et al. (2017) Ludlam R., Miller J. M., Miller-Jones J., Reynolds M., 2017, The Astronomer’s Telegram, 10690, 1
- Ludlam et al. (2018) Ludlam R. M., et al., 2018, ApJ, 858, L5
- Ludlam et al. (2019) Ludlam R. M., et al., 2019, ApJ, 883, 39
- Madej & Jonker (2011) Madej O. K., Jonker P. G., 2011, MNRAS, 412, L11
- Madej et al. (2010) Madej O. K., Jonker P. G., Fabian A. C., Pinto C., Verbunt F., de Plaa J., 2010, MNRAS, 407, L11
- Madej et al. (2014) Madej O. K., García J., Jonker P. G., Parker M. L., Ross R., Fabian A. C., Chenevez J., 2014, MNRAS, 442, 1157
- Miller et al. (2017) Miller J. M., Ludlam R. M., Reynolds M. T., Kuulkers E., Ferrigno C., Bozzo E., 2017, The Astronomer’s Telegram, 10719, 1
- Mitsuda et al. (1984) Mitsuda K., et al., 1984, PASJ, 36, 741
- Mitsuda et al. (1989) Mitsuda K., Inoue H., Nakamura N., Tanaka Y., 1989, PASJ, 41, 97
- Nayakshin et al. (2000) Nayakshin S., Kazanas D., Kallman T. R., 2000, ApJ, 537, 833
- Nelemans et al. (2004) Nelemans G., Jonker P. G., Marsh T. R., van der Klis M., 2004, MNRAS, 348, L7
- Nelemans et al. (2006) Nelemans G., Jonker P. G., Steeghs D., 2006, MNRAS, 370, 255
- Nelson et al. (1986) Nelson L. A., Rappaport S. A., Joss P. C., 1986, ApJ, 311, 226
- Ng et al. (2010) Ng C., Díaz Trigo M., Cadolle Bel M., Migliari S., 2010, A&A, 522, A96
- Özel & Freire (2016) Özel F., Freire P., 2016, ARA&A, 54, 401
- Patruno et al. (2010) Patruno A., Altamirano D., Messenger C., 2010, MNRAS, 403, 1426
- Podsiadlowski et al. (2002) Podsiadlowski P., Rappaport S., Pfahl E. D., 2002, ApJ, 565, 1107
- Popham & Sunyaev (2001) Popham R., Sunyaev R., 2001, ApJ, 547, 355
- Rappaport & Joss (1984) Rappaport S., Joss P. C., 1984, ApJ, 283, 232
- Revnivtsev et al. (2013) Revnivtsev M. G., Suleimanov V. F., Poutanen J., 2013, MNRAS, 434, 2355
- Rothschild et al. (1998) Rothschild R. E., et al., 1998, ApJ, 496, 538
- Sanna et al. (2018) Sanna A., et al., 2018, MNRAS, 481, 1658
- Savonije et al. (1986) Savonije G. J., de Kool M., van den Heuvel E. P. J., 1986, A&A, 155, 51
- Schultz (2003) Schultz J., 2003, A&A, 397, 249
- Serino et al. (2018) Serino M., et al., 2018, The Astronomer’s Telegram, 11302, 1
- Shakura & Sunyaev (1973) Shakura N. I., Sunyaev R. A., 1973, A&A, 24, 337
- Shimura & Takahara (1995) Shimura T., Takahara F., 1995, ApJ, 445, 780
- Shull & van Steenberg (1982) Shull J. M., van Steenberg M., 1982, ApJS, 48, 95
- Sibgatullin & Sunyaev (2000) Sibgatullin N. R., Sunyaev R. A., 2000, Astronomy Letters, 26, 699
- Sunyaev & Shakura (1986) Sunyaev R. A., Shakura N. I., 1986, Soviet Astronomy Letters, 12, 117
- Tutukov & Yungelson (1993) Tutukov A. V., Yungelson L. R., 1993, Astronomy Reports, 37, 411
- Verbunt & van den Heuvel (1995) Verbunt F., van den Heuvel E. P. J., 1995, X-ray Binaries, pp 457–494
- Wang & Chakrabarty (2004) Wang Z., Chakrabarty D., 2004, ApJ, 616, L139
- Werner et al. (2006) Werner K., Nagel T., Rauch T., Hammer N. J., Dreizler S., 2006, A&A, 450, 725
- White et al. (1988) White N. E., Stella L., Parmar A. N., 1988, ApJ, 324, 363
- Wilms et al. (2000) Wilms J., Allen A., McCray R., 2000, ApJ, 542, 914
- Yungelson et al. (2002) Yungelson L. R., Nelemans G., van den Heuvel E. P. J., 2002, A&A, 388, 546
- Zimmerman et al. (2005) Zimmerman E. R., Narayan R., McClintock J. E., Miller J. M., 2005, ApJ, 618, 832