The (re)appearance of NGC 925 ULX-3, a new transient ULX
Abstract
We report the discovery of a third ULX in NGC 925 (ULX-3), detected in November 2017 by Chandra at a luminosity of erg s-1. Examination of archival data for NGC 925 reveals that ULX-3 was detected by Swift at a similarly high luminosity in 2011, as well as by XMM-Newton in January 2017 at a much lower luminosity of erg s-1. With an additional Chandra non-detection in 2005, this object demonstrates a high dynamic range of flux of factor . In its high-luminosity detections, ULX-3 exhibits a hard power-law spectrum with , whereas the XMM-Newton detection is slightly softer, with and also well-fitted with a broadened disc model. The long-term light curve is sparsely covered and could be consistent either with the propeller effect or with a large-amplitude superorbital period, both of which are seen in ULXs, in particular those with neutron star accretors. Further systematic monitoring of ULX-3 will allow us to determine the mechanism by which ULX-3 undergoes its extreme variability and to better understand the accretion processes of ULXs.
1 Introduction
Ultraluminous X-ray sources (ULXs) are defined as extragalactic non-nuclear X-ray point sources with luminosities in excess of erg s-1, the majority of which are widely thought to be stellar-mass compact objects accreting at super-Eddington rates (for a recent review see Kaaret et al. 2017). One key piece of evidence that these sources are accreting in a regime different to the canonical sub-Eddington states was the detection of a high-energy turnover in their 5–10 keV spectrum, first seen in high-quality XMM-Newton data (e.g. Stobbart et al. 2006; Gladstone et al. 2009) and later confirmed by observations with NuSTAR, whose coverage above 10 keV established the presence of a turnover and steep power-law drop-off in the spectra of most ULXs above 5 keV (e.g. Bachetti et al. 2013; Mukherjee et al. 2015; Walton et al. 2014, 2015a).
Explicit confirmation of the stellar-mass nature of at least a proportion of ULXs came from the detection of coherent pulsations in M82 X-2 (Bachetti et al., 2014), allowing the compact object to be unambiguously identified as a neutron star. Since then, the population of known neutron star ULXs has risen to at least 7, both through the detection of pulsations (Fürst et al., 2016; Israel et al., 2017a, b; Carpano et al., 2018; Rodríguez Castillo et al., 2019; Sathyaprakash et al., 2019) and through the detection of probable cyclotron resonance scattering spectral features (Brightman et al., 2018). Their extreme luminosities imply accretion rates of hundreds of times the Eddington rate for neutron stars, and they tend to exhibit pulsations with period 1 s, with sinusoidal pulse profiles suggesting that they are not highly beamed. The low count rates due to being extragalactic sources, the presence of spin-up and orbital modulation, and possible transience in pulsations make them very challenging to detect, however, and the proportion of ULXs that contain neutron star accretors as opposed to black holes is still an open question (e.g. King & Lasota 2016; Middleton & King 2017), especially since their broadband spectra are otherwise indistinguishable from the rest of the ULX population (e.g. Koliopanos et al. 2017; Pintore et al. 2017; Walton et al. 2018).
Neutron star ULXs do share a property of extreme long-term variability of various types, often over orders of magnitude in flux. One example of such variability is sudden and large drops in brightness, leading to an approximately bimodal distribution in flux. This may be due to the onset of the propeller regime (e.g. Tsygankov et al. 2016b), in which the magnetospheric radius of the magnetic field is larger than the corotation radius of the accretion disc, creating a centrifugal barrier to mass accretion and causing the flux to drop correspondingly (Illarionov & Sunyaev, 1975; Stella et al., 1986). This may be a way of identifying candidate neutron star ULXs in the absence of detected pulsations (Earnshaw et al. 2018; Song et al. subm.).
Several neutron star ULXs also exhibit superorbital periods on the order of tens of days, varying by up to factors of tens in flux, discovered through long-term monitoring using Swift (e.g. Walton et al. 2016; Fürst et al. 2018; Brightman et al. 2019). Several mechanisms have been proposed for their cause, including precession of a warped disk obscuring the central source (e.g. Motch et al. 2014), or Lense-Thirring precession of the supercritical accretion flow itself (e.g. Middleton et al. 2018, 2019). Monitoring at a regular cadence for long durations is important, as a high-amplitude superorbital period with limited sampling may result in the source appearing to have a bimodal flux distribution, which could then be interpreted as a propeller transition (e.g. M82 X-2; Tsygankov et al. 2016b; Brightman et al. 2019). It is also possible for ULXs to exhibit both of these effects – for example, NGC 5907 ULX-1, which has a 78 day superorbital period and also underwent a greater drop in flux potentially due to the propeller effect in 2013 (Walton et al., 2015b, 2016; Fürst et al., 2017a; Israel et al., 2017a). It is worth noting that the presence of a superorbital period in itself is not evidence of a neutron star accretor, as they can also be seen in black hole systems, such as the well-studied Galactic source Cyg X-1 (e.g. Rico 2008).
The transient nature of ULXs and the sparse temporal X-ray coverage of most galaxies means that more ULXs are being discovered all the time, without necessarily being ‘new’ sources. Some discoveries, having never been detected before, have previous upper limits establishing that large increases in flux must have taken place (e.g. Pintore et al. 2018a; Earnshaw et al. 2019; Wang et al. 2019), although limited coverage generally means that recent periods of high luminosity cannot be ruled out. Others have been detected at luminosities below erg s-1 before undergoing an increase in brightness that takes them into the ULX regime (e.g. Hu et al. 2018).
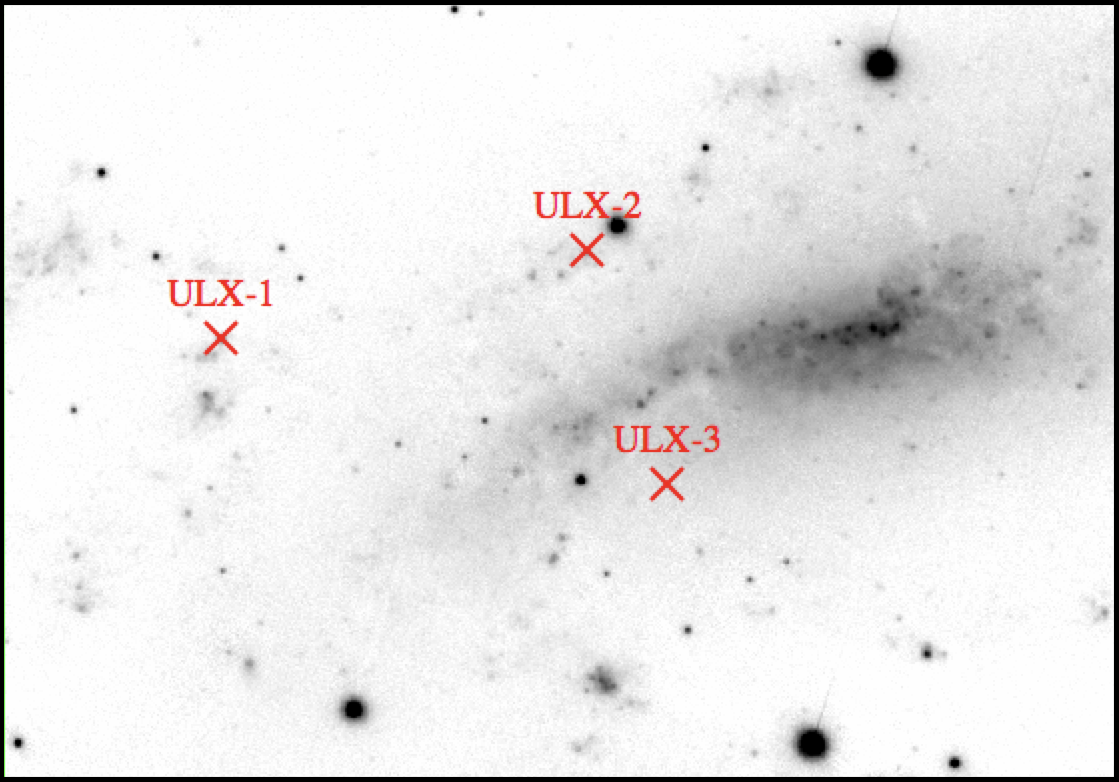
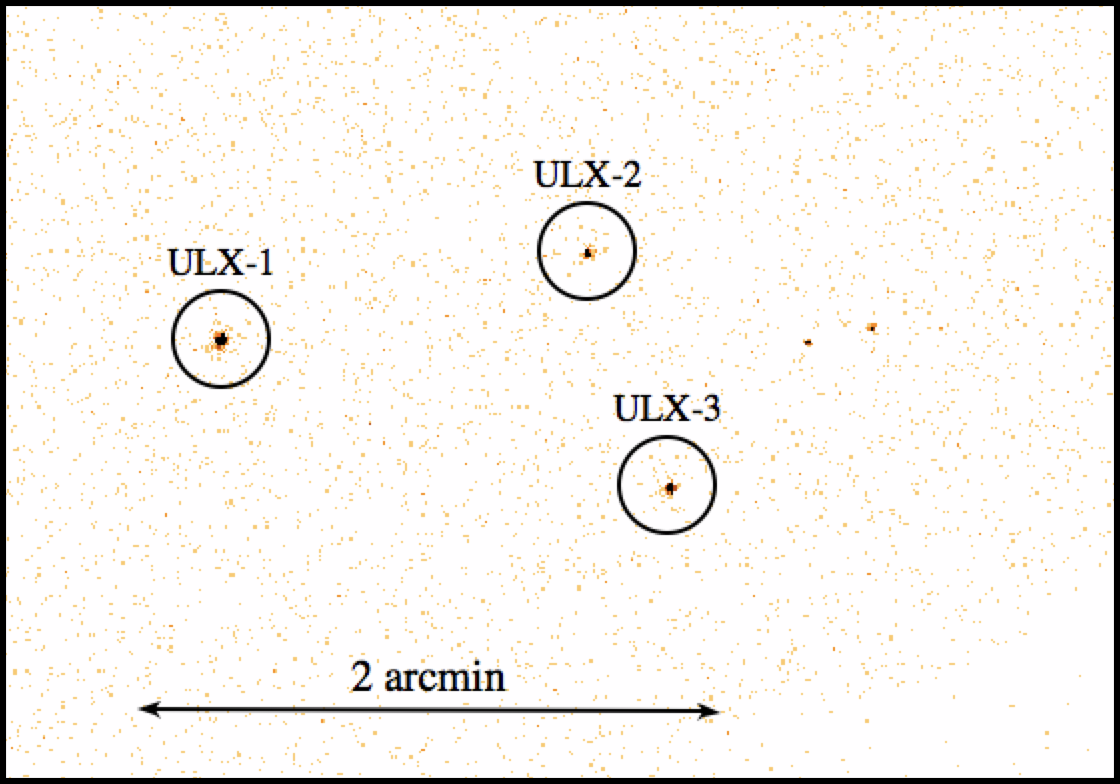
This paper investigates the appearance of a previously unknown ULX during the latest Chandra observation in 2017 of NGC 925, a spiral galaxy at 9.56 Mpc (from Cepheids distances recorded in the NED Distances Database111https://ned.ipac.caltech.edu/Library/Distances/; Steer et al. 2017). The galaxy is known to contain two previously studied ULXs (Pintore et al., 2018b); we report on the discovery of a third ULX at position 02h 27m 20s.18, +33∘ 34′ 12.84′′ (J2000) which we designate NGC 925 ULX-3 (henceforth ULX-3 in this paper). Upon investigation of archival data for this source, we found that it was previously detected by XMM-Newton at a sub-ULX luminosity, and was also detected at ULX luminosities by Swift in 2011. In this paper we present the results of our analysis of the spectral and long-term timing properties of ULX-3, and discuss how it fits into the broader picture of extreme variability in ULXs.
2 Data Reduction & Analysis
2.1 Chandra
We observed NGC 925 using ACIS-S for 10 ks on 2017 December 1, in order to obtain a precise localization of one of the other ULXs in the galaxy for comparison to near-infrared data (Heida et al. in prep). We reduced this observation (Obs. ID 20356; see Fig. 1, right) as well as an archival 2.2 ks observation taken 2005 November 23 (Obs. ID 7104) using ciao v4.10 with caldb v4.7.9. We used the wavdetect routine to determine the location of the new source, which we found to be 02h 27m 20s.18, +33∘ 34′ 12′′.84 (J2000) with statistical 1 error of 0.03′′. There were insufficient background sources for further astrometric correction to be performed. We subsequently used this position to extract data products from all other observations. Products were extracted from a circular region with radius 3′′ centered on the source, with an annular background region centered on the source with inner radius 3′′ and outer radius 20′′. The spectrum and associated response and auxiliary files were extracted using the routine specextract. The source was not detected in the archival observation, so we obtained a 3 upper limit on the flux using the srcflux routine, assuming an absorbed power-law model with Galactic absorption ( cm-2; Willingale et al. 2013) and .
2.2 XMM-Newton & NuSTAR
There is a single, 50 ks archival XMM-Newton observation of NGC 925 (Obs. ID 0784510301), taken on 2018 January 18. We extracted the data from the EPIC-pn and EPIC-MOS instruments using the XMM-Newton sas v17.0.0 software, producing calibrated event lists using the tasks emproc and epproc. Periods of high background flaring were removed by filtering out intervals of time during which the 10–12 keV count rate exceeded 0.35 cts/s across the EPIC-MOS detectors and 0.4 cts/s across the EPIC-pn detector. We extracted data products from a 20′′ radius circular source region, using a 40′′ radius circular region on the same chip with a similar distance from the readout node for the background. Events with FLAG==0 && PATTERN4 were selected from EPIC-pn, and PATTERN12 from EPIC-MOS. The tasks rmfgen and arfgen were used to create redistribution matrices and auxiliary response files respectively.
The XMM-Newton observation was taken quasi-simultaneously with a NuSTAR observation (Obs. ID 30201003002), though ULX-3 was not detected by NuSTAR at that time due to its low flux. We used XIMAGE to find a 3 upper limit on the count rate.
2.3 Swift
There are 18 archival observations of NGC 925 with Swift-XRT between 2011 and 2017 (Obs. ID: 00045596001–00045596018). Clean event lists were created using the FTOOLS task xrtpipeline v0.13.4. Source and background spectra were extracted using the task xselect, using a 30′′ radius circular source region and a 70′′ radius circular background region. Auxiliary response files were created using the task xrtmkarf and the relevant redistribution matrix obtained from the CALDB. For those observations with sufficient numbers of counts to perform basic spectral fitting (30), we obtain fluxes from the best-fitting absorbed power-law model using XSPEC v12.10.0 (Arnaud, 1996). Otherwise, we calculate fluxes from the count rate using PIMMS, assuming an absorbed power-law model with Galactic absorption and (consistent with the measured slope of the Chandra spectrum, see Section 3.3). 3 upper limits for Swift non-detections were determined using the sosta routine in XIMAGE.
2.4 Optical/Infrared
The deepest existing optical coverage of the part of NGC 925 that contains the ULXs is with PanSTARRS. The PanSTARRS catalogue (Flewelling et al., 2016) contains one potential counterpart, a faint object only detected in the band with mag at from the Chandra position. There are no WISE or Spitzer sources coincident with the ULX.
3 Results
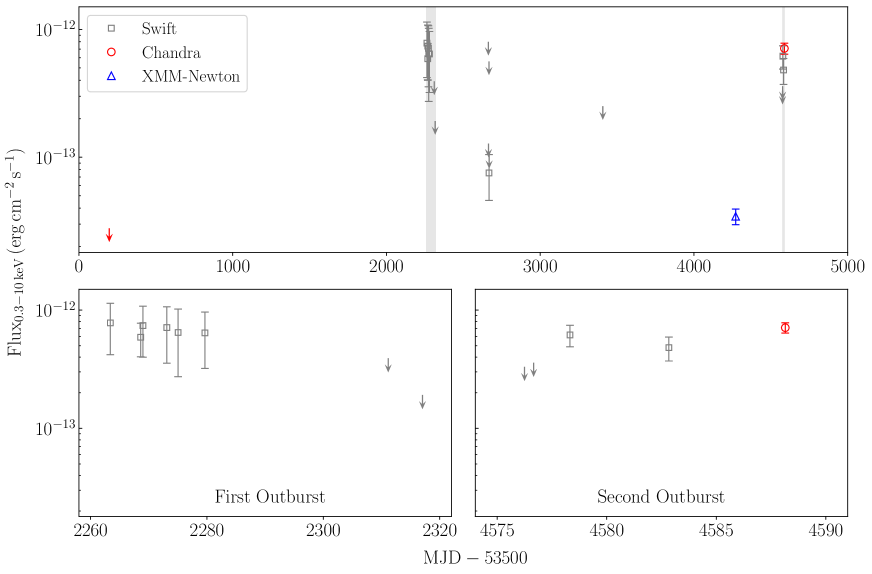
The long-term light curve of ULX-3 (Fig. 2), made up of Swift, XMM-Newton, and Chandra data, shows that prior to the 2017 re-brightening in which we discovered the source, ULX-3 also underwent an outburst to super-Eddington luminosities in 2011, over the course of at least 17 days while the galaxy was being monitored by Swift.
We fitted all spectra using XSPEC v12.10.0 (Arnaud, 1996), over the energy range 0.3–10 keV. Given the generally low count rates, we grouped all spectra to a minimum of one count per bin and used background-subtracted Cash statistics (Cash, 1979) when fitting. In all cases there is insufficient data to constrain any additional absorption beyond the Galactic value of cm-2 (Willingale et al., 2013) so we freeze the interstellar absorption to this value, fitting the absorption component using the tbabs XSPEC model and Wilms et al. (2000) abundance tables throughout. Spectral fitting results are given in Table 1.
Since we are not using statistics, we instead use the Anderson-Darling test (Stephens, 1974), as implemented in XSPEC, to evaluate the goodness of fit for each best-fitting model. Upon running the goodness command to perform Monte-Carlo simulations of the data based on the model parameters, the returned percentage is the proportion of simulations with a value of the test statistic lower than that for the data. Therefore, a value of 50% indicates a model that fits the data well, and higher percentages indicate that the majority of simulations are better-fitted by the model than the data is (with a value of 95% indicating that the null hypothesis of the data being described by the model can be rejected with a confidence of 2, and so on). All quoted errors are 90% confidence intervals, calculated from the value when the parameter is varied.
| Dataset | Obs. Date | tbabs * powerlaw | tbabs * diskbb/diskpbb | |||||||
|---|---|---|---|---|---|---|---|---|---|---|
| aaThe fitted model flux in the energy range 0.3–10 keV, in units of 10-13 erg cm-2 s-1. | A-DbbThe percentage result of a goodness-of-fit test using Anderson-Darling statistics. | (keV) | aaThe fitted model flux in the energy range 0.3–10 keV, in units of 10-13 erg cm-2 s-1. | A-DbbThe percentage result of a goodness-of-fit test using Anderson-Darling statistics. | ||||||
| Swift 1ccThe combined Swift observations 00045596001–00045596006 (first outburst). | 2011 Jul 21–Aug 6 | 73.5/93 | 39.6% | - | 78.8/93 | 90.9% | ||||
| XMM | 2017 Jan 18 | 200.3/217 | 12.3% | - | 215.0/217 | 91.0% | ||||
| 200.0/216 | 12.8% | |||||||||
| Swift 2ddThe combined Swift observations 00045596017 and 000455960018 (second outburst). | 2017 Nov 21–25 | 38.8/40 | 54.2% | - | 38.4/40 | 73.1% | ||||
| Chandra | 2017 Dec 1 | 161.2/223 | 23.7% | - | 178.1/223 | 99.9% | ||||
| 160.9/222 | 21.5% | |||||||||
3.1 First brightening
After a non-detection by Chandra in 2005, the first detection of ULX-3 was during a series of observations of NGC 925 with Swift, in six of which the source is detected at fluxes 5– erg cm-2 s-1 (– erg s-1 at 9.56 Mpc). About a month later, two further Swift observations failed to detect the source, with the latter establishing an upper limit to the flux of erg cm-2 s-1.
Since the first six Swift observations (Obs. ID: 00045596001–00045596006) are consistent in flux, we combined the six spectra using addascaspec and fitted the stacked spectrum with both an absorbed power-law model (tbabs*powerlaw in XSPEC) and a multi-colour disk blackbody model (tbabs*diskbb). Of the two models, a hard power-law is preferred, with , though we cannot formally reject a disk model.
3.2 Between bright epochs
Between the first re-brightening and the second, NGC 925 was observed a number of additional times with Swift, and once with XMM-Newton. The single Swift detection (Obs. ID: 00045596012) has flux erg cm-2 s-1, around an order of magnitude lower than its bright flux, with the remaining upper limits consistent with this value. The XMM-Newton detection is at a lower flux of erg cm-2 s-1 ( erg s-1), and we note that the upper limit placed by the first Chandra observation in 2005 is lower still, at erg cm-2 s-1.
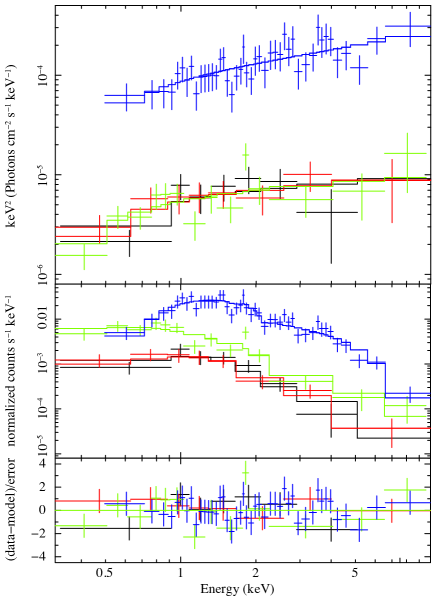
We find the XMM-Newton spectrum to be softer than in the high-flux observations, well-fitted with a power-law with . A simple disk blackbody model is less favoured, though a broadened disk model (tbabs*diskpbb) could fit the data as well as a power-law. However, the data are insufficient to place good constraints on the temperature. We show the spectrum in Fig. 3, where we compare it with the later Chandra detection.
We find an upper limit on the NuSTAR count rate of ct s-1 which, for the best-fitting power-law model to the XMM-Newton data, gives an upper limit on the 10–20 keV flux of erg cm-2 s-1. We consider this to be a conservative upper limit, since the spectrum may turn over at higher energies, leading to a far lower flux than if it continues as a power-law.
3.3 Second brightening
The detection of ULX-3 by Chandra in 2017 is part of a second high-flux epoch, almost a year after the XMM-Newton detection. It was first seen in Swift, in the latter two of four observations, at similar fluxes to the first outburst (5– erg cm-2 s-1). The initial non-detections imply an increase in flux of at least a factor of 2 over the course of 40 hours. It was then observed by Chandra five days later, at a flux of erg cm-2 s-1 ( erg s-1).
We combined the two Swift observations in which there was a detection as for the first outburst. Both this Swift spectrum and the Chandra spectrum can be well-fitted with a hard power-law ( and , respectively), similar to the first Swift epoch. We can confidently rule out a disk blackbody model, but once again a broadened disk model could fit the data, although we do not have the high-energy coverage to place good constraints on its parameters.
3.4 ULX-1 and ULX-2
The other two known ULXs in NGC 925 were examined in detail in a previous study of data up to 2017 January by Pintore et al. (2018b) and found to have properties typical of the super-Eddington accreting population of ULXs. Therefore we have not performed an in-depth study of these objects, though we did fit their spectra extracted from the latest Chandra observation.
Both spectra can be well-fitted with power-law models, with ULX-1 having and ULX-2 having . The spectral slope for ULX-2 is consistent with that found in the previous study, and the slope for ULX-1 can be considered so when accounting for the inability to detect a high-energy turnover in the Chandra-only data that would soften a power-law model fit. In addition, the model fluxes for both sources are comparable to those found in Pintore et al. (2018b) when adjusted for the energy range considered. Therefore these sources appear to be persistent and in a similar accretion state to when they were last studied.
4 Discussion and Conclusions
Since NGC 925 ULX-3 is observed to be bright on two separate occasions, we can determine that this source is not a single one-off transient event, but is an object that undergoes repeated increases in flux. These high-flux epochs last for at least tens of days, although since we have not observed both the beginning and end of a single high-flux epoch, we cannot say a great deal about their total duration, nor their duty cycle, given the sparse coverage of observations of NGC 925. We do know, however, that ULX-3 exhibits a large dynamic range in flux on month-to-year timescales, with a factor 26 between the highest-flux detection and the lowest upper limit.
The lack of a bright optical or infrared counterpart makes it unlikely that this source is a background AGN. At the distance of NGC 925, the faint potential counterpart has absolute -band magnitude , which is consistent with a supergiant stellar companion. With an apparent magnitude of it is considerably brighter than most optical ULX counterparts (e.g. Gladstone et al. 2013). As such, this is a good target for further optical/near-infrared observations. Spectroscopic identification of stellar absorption features would allow for the determination of the spectral type of the companion, which has only been possible for a handful of ULX donor stars (Motch et al., 2011; Heida et al., 2015, 2016, 2019), and make this source an excellent target for attempting radial velocity measurements and thus placing constraints on the mass of the compact object in the system (e.g. Motch et al. 2014).
The limited energy band coverage of Chandra, and the low flux of ULX-3 when observed with XMM-Newton and NuSTAR (resulting in a non-detection by the latter), mean that we have so far been unable to find evidence of the spectral turnover at high energies indicative of super-Eddington accretion. Nevertheless, its potential long-term spectral variability, exhibiting a slightly harder spectrum in the 0.3–10 keV energy range at its highest luminosities and a softer spectrum at a lower luminosity, appears to be more consistent with that seen in some super-Eddington ULXs (e.g. Pintore & Zampieri 2012; Shidatsu et al. 2017; Walton et al. 2017), rather than that expected from the sub-Eddington accretion states of an intermediate-mass black hole (e.g. Servillat et al. 2011). We do, however, note that for existing data the spectral slope measurements for ULX-3 are within error of each other, so further deeper observations are required to confirm this potential spectral variation.
There is not sufficient data for attempting to perform short-term timing analysis such as searching for pulsations, which would be the definitive evidence of the presence of a neutron star in this system. However, the detections of ULX-3 so far available appear to indicate an approximately bimodal flux distribution, as expected for an accreting neutron star that, on occasion, enters a propeller regime with an associated drop in flux. Pulsars with spin periods 1 s, as seen in most of the neutron star ULXs discovered to date, are expected to show ratios 100 between the high and low limiting fluxes (e.g. Campana et al. 2001). However, leakage of a small percentage of the accreting material into the magnetosphere can still occur in a low-flux state, which can reduce the flux ratio to factors of tens (e.g. Doroshenko et al. 2011; Tsygankov et al. 2016b), more consistent with the flux ratio we observe for ULX-3.
Without systematic, high-cadence monitoring of a varying ULX, however, what initially appears to be evidence for the onset of the propeller regime may instead turn out to be a superorbital modulation, which can also result in flux variation of factors of tens in some cases. For example, the ULX M82 X-2 shows dramatic variability that was initially suggested to be due to the propeller effect (Tsygankov et al., 2016b), but later analysis revealed that this variability was in fact due to a superorbital period (Brightman et al., 2019). Therefore it is possible that the bimodal flux distribution that we see in ULX-3 is due to a poorly sampled superorbital modulation.
The existing data is far too sparse for methods such as the Lomb-Scargle periodogram to detect a long-term periodic signal. However, should ULX-3’s variability result from a superorbital flux modulation, we can determine from the duration of the high-flux states we have been able to observe that its period is likely to be 40 days. Simple epoch folding of the existing data gives several potential periods between 70 and 150 days that could be consistent with the existing data (i.e. high and low observed fluxes occur at different points in the phaseogram). Monitoring this source more closely is necessary to better sample the light curve and search for long-term periodicity or quasi-periodicity.
Superorbital periods in ULXs do not tend to show spectral change over the course of a phase cycle – M82 X-2 is mostly consistent with having a hard spectrum in both high and low flux states (Brightman et al., 2016, 2019), and while M51 ULX-7 shows varying hardness over the course of its super-orbital modulation (Brightman et al. in prep.), the source has consistently hard spectra at all fluxes when contamination by soft extended emission at lower fluxes is accounted for (Earnshaw et al., 2016). In these cases, this implies that the superorbital modulation is not caused by periodic occultation of the neutron star by a warped accretion disk, as we would expect large spectral variation from such a scenario.
On the other hand, study of the more accessible low states of Galactic sources that undergo the propeller effect shows a change from a bright, hard accretion state to a soft, thermal quiescent state, attributed to black-body emission from the surface of the neutron star or its hot spots (e.g. Reig et al. 2014; Tsygankov et al. 2016a; Fürst et al. 2017b). While ULX-3 does appear to exhibit similar hard-when-bright, soft-when-dim behaviour, the spectrum in the low-flux state is broader, with broadened disc or power-law models preferred over a disc black-body model, and orders of magnitude more luminous than the low states discussed in the aforementioned studies. Therefore we are unlikely to be observing the same propeller effect behaviour in ULX-3.
However, ULX-3’s behaviour could potentially be similar to that observed in NGC 5907 ULX-1, whose spectrum is consistently hard in different phases of its super-orbital modulation (though there may be some change in the radial dependence of the disk temperature ), but has one lower-flux observation with a softer spectrum, well-fitted with a broadened disc model, which Fürst et al. (2017a) suggest is associated with refilling of the inner accretion disc after time in the propeller regime. This may indicate the involvement of the propeller effect in ULX-3’s light curve, but the lower flux of the XMM-Newton observation may still be connected to a superorbital period.
It is clear that further, denser monitoring of ULX-3 is required to establish the physical cause of its long-term variability. As of August 2019, we have begun an observing campaign with Swift in order to improve our coverage of ULX-3’s light curve, which we will describe in a future paper along with further planned follow-up. A better understanding of its long-term behaviour will also allow for the effective scheduling of further deep observations to constrain its broadband spectrum in the high-flux state and to better characterise the softer spectrum in the low-flux state.
References
- Arnaud (1996) Arnaud, K. A. 1996, in Astronomical Society of the Pacific Conference Series, Vol. 101, Astronomical Data Analysis Software and Systems V, ed. G. H. Jacoby & J. Barnes, 17
- Astropy Collaboration et al. (2013) Astropy Collaboration, Robitaille, T. P., Tollerud, E. J., et al. 2013, A&A, 558, A33, doi: 10.1051/0004-6361/201322068
- Bachetti et al. (2013) Bachetti, M., Rana, V., Walton, D. J., et al. 2013, ApJ, 778, 163, doi: 10.1088/0004-637X/778/2/163
- Bachetti et al. (2014) Bachetti, M., Harrison, F. A., Walton, D. J., et al. 2014, Nature, 514, 202, doi: 10.1038/nature13791
- Brightman et al. (2016) Brightman, M., Harrison, F., Walton, D. J., et al. 2016, ApJ, 816, 60, doi: 10.3847/0004-637X/816/2/60
- Brightman et al. (2018) Brightman, M., Harrison, F. A., Fürst, F., et al. 2018, Nature Astronomy, 2, 312, doi: 10.1038/s41550-018-0391-6
- Brightman et al. (2019) Brightman, M., Harrison, F. A., Bachetti, M., et al. 2019, ApJ, 873, 115, doi: 10.3847/1538-4357/ab0215
- Campana et al. (2001) Campana, S., Gastaldello, F., Stella, L., et al. 2001, The Astrophysical Journal, 561, 924, doi: 10.1086/323317
- Carpano et al. (2018) Carpano, S., Haberl, F., Maitra, C., & Vasilopoulos, G. 2018, MNRAS, 476, L45, doi: 10.1093/mnrasl/sly030
- Cash (1979) Cash, W. 1979, ApJ, 228, 939, doi: 10.1086/156922
- Doroshenko et al. (2011) Doroshenko, V., Santangelo, A., & Suleimanov, V. 2011, Astronomy and Astrophysics, 529, A52, doi: 10.1051/0004-6361/201116482
- Earnshaw et al. (2016) Earnshaw, H. M., Roberts, T. P., Heil, L. M., et al. 2016, MNRAS, 456, 3840, doi: 10.1093/mnras/stv2945
- Earnshaw et al. (2018) Earnshaw, H. P., Roberts, T. P., & Sathyaprakash, R. 2018, MNRAS, 476, 4272, doi: 10.1093/mnras/sty501
- Earnshaw et al. (2019) Earnshaw, H. P., Grefenstette, B. W., Brightman, M., et al. 2019, The Astrophysical Journal, 881, 38, doi: 10.3847/1538-4357/ab20cd
- Flewelling et al. (2016) Flewelling, H. A., Magnier, E. A., Chambers, K. C., et al. 2016, arXiv e-prints, arXiv:1612.05243. https://arxiv.org/abs/1612.05243
- Fruscione et al. (2006) Fruscione, A., McDowell, J. C., Allen, G. E., et al. 2006, in Society of Photo-Optical Instrumentation Engineers (SPIE) Conference Series, Vol. 6270, Society of Photo-Optical Instrumentation Engineers (SPIE) Conference Series, 62701V
- Fürst et al. (2017a) Fürst, F., Walton, D. J., Stern, D., et al. 2017a, ApJ, 834, 77, doi: 10.3847/1538-4357/834/1/77
- Fürst et al. (2016) Fürst, F., Walton, D. J., Harrison, F. A., et al. 2016, ApJL, 831, L14, doi: 10.3847/2041-8205/831/2/L14
- Fürst et al. (2017b) Fürst, F., Kretschmar, P., Kajava, J. J. E., et al. 2017b, A&A, 606, A89, doi: 10.1051/0004-6361/201730941
- Fürst et al. (2018) Fürst, F., Walton, D. J., Heida, M., et al. 2018, A&A, 616, A186, doi: 10.1051/0004-6361/201833292
- Gladstone et al. (2013) Gladstone, J. C., Copperwheat, C., Heinke, C. O., et al. 2013, ApJS, 206, 14, doi: 10.1088/0067-0049/206/2/14
- Gladstone et al. (2009) Gladstone, J. C., Roberts, T. P., & Done, C. 2009, MNRAS, 397, 1836, doi: 10.1111/j.1365-2966.2009.15123.x
- Heida et al. (2016) Heida, M., Jonker, P. G., Torres, M. A. P., et al. 2016, MNRAS, 459, 771, doi: 10.1093/mnras/stw695
- Heida et al. (2015) Heida, M., Torres, M. A. P., Jonker, P. G., et al. 2015, MNRAS, 453, 3510, doi: 10.1093/mnras/stv1853
- Heida et al. (2019) Heida, M., Lau, R. M., Davies, B., et al. 2019, ApJL, 883, L34, doi: 10.3847/2041-8213/ab4139
- Hu et al. (2018) Hu, C.-P., Kong, A. K. H., Ng, C. Y., & Li, K. L. 2018, ApJ, 864, 64, doi: 10.3847/1538-4357/aad5e2
- Illarionov & Sunyaev (1975) Illarionov, A. F., & Sunyaev, R. A. 1975, A&A, 39, 185
- Israel et al. (2017a) Israel, G. L., Belfiore, A., Stella, L., et al. 2017a, Science, 355, 817, doi: 10.1126/science.aai8635
- Israel et al. (2017b) Israel, G. L., Papitto, A., Esposito, P., et al. 2017b, MNRAS, 466, L48, doi: 10.1093/mnrasl/slw218
- Kaaret et al. (2017) Kaaret, P., Feng, H., & Roberts, T. P. 2017, ARAA, 55, 303, doi: 10.1146/annurev-astro-091916-055259
- King & Lasota (2016) King, A., & Lasota, J.-P. 2016, MNRAS, 458, L10, doi: 10.1093/mnrasl/slw011
- Koliopanos et al. (2017) Koliopanos, F., Vasilopoulos, G., Godet, O., et al. 2017, A&A, 608, A47, doi: 10.1051/0004-6361/201730922
- Middleton et al. (2019) Middleton, M. J., Fragile, P. C., Ingram, A., & Roberts, T. P. 2019, MNRAS, 489, 282, doi: 10.1093/mnras/stz2005
- Middleton & King (2017) Middleton, M. J., & King, A. 2017, MNRAS, 470, L69, doi: 10.1093/mnrasl/slx079
- Middleton et al. (2018) Middleton, M. J., Fragile, P. C., Bachetti, M., et al. 2018, Monthly Notices of the Royal Astronomical Society, 475, 154, doi: 10.1093/mnras/stx2986
- Motch et al. (2011) Motch, C., Pakull, M. W., Grisé, F., & Soria, R. 2011, Astronomische Nachrichten, 332, 367, doi: 10.1002/asna.201011501
- Motch et al. (2014) Motch, C., Pakull, M. W., Soria, R., Grisé, F., & Pietrzyński, G. 2014, Nature, 514, 198, doi: 10.1038/nature13730
- Mukherjee et al. (2015) Mukherjee, E. S., Walton, D. J., Bachetti, M., et al. 2015, ApJ, 808, 64, doi: 10.1088/0004-637X/808/1/64
- Nasa High Energy Astrophysics Science Archive Research Center (2014) (Heasarc) Nasa High Energy Astrophysics Science Archive Research Center (Heasarc). 2014, HEAsoft: Unified Release of FTOOLS and XANADU, Astrophysics Source Code Library. http://ascl.net/1408.004
- Pintore & Zampieri (2012) Pintore, F., & Zampieri, L. 2012, MNRAS, 420, 1107, doi: 10.1111/j.1365-2966.2011.20072.x
- Pintore et al. (2017) Pintore, F., Zampieri, L., Stella, L., et al. 2017, ApJ, 836, 113, doi: 10.3847/1538-4357/836/1/113
- Pintore et al. (2018a) Pintore, F., Belfiore, A., Novara, G., et al. 2018a, MNRAS, 477, L90, doi: 10.1093/mnrasl/sly048
- Pintore et al. (2018b) Pintore, F., Zampieri, L., Mereghetti, S., et al. 2018b, MNRAS, 479, 4271, doi: 10.1093/mnras/sty1766
- Reig et al. (2014) Reig, P., Doroshenko, V., & Zezas, A. 2014, MNRAS, 445, 1314, doi: 10.1093/mnras/stu1840
- Rico (2008) Rico, J. 2008, ApJL, 683, L55, doi: 10.1086/591472
- Rodríguez Castillo et al. (2019) Rodríguez Castillo, G. A., Israel, G. L., Belfiore, A., et al. 2019, arXiv e-prints, arXiv:1906.04791. https://arxiv.org/abs/1906.04791
- Sathyaprakash et al. (2019) Sathyaprakash, R., Roberts, T. P., Walton, D. J., et al. 2019, MNRAS, L104, doi: 10.1093/mnrasl/slz086
- Servillat et al. (2011) Servillat, M., Farrell, S. A., Lin, D., et al. 2011, ApJ, 743, 6, doi: 10.1088/0004-637X/743/1/6
- Shidatsu et al. (2017) Shidatsu, M., Ueda, Y., & Fabrika, S. 2017, ApJ, 839, 46, doi: 10.3847/1538-4357/aa67e7
- Steer et al. (2017) Steer, I., Madore, B. F., Mazzarella, J. M., et al. 2017, AJ, 153, 37, doi: 10.3847/1538-3881/153/1/37
- Stella et al. (1986) Stella, L., White, N. E., & Rosner, R. 1986, ApJ, 308, 669, doi: 10.1086/164538
- Stephens (1974) Stephens, M. A. 1974, Journal of the American Statistical Association, 69, 730
- Stobbart et al. (2006) Stobbart, A. M., Roberts, T. P., & Wilms, J. 2006, MNRAS, 368, 397, doi: 10.1111/j.1365-2966.2006.10112.x
- Tsygankov et al. (2016a) Tsygankov, S. S., Lutovinov, A. A., Doroshenko, V., et al. 2016a, A&A, 593, A16, doi: 10.1051/0004-6361/201628236
- Tsygankov et al. (2016b) Tsygankov, S. S., Mushtukov, A. A., Suleimanov, V. F., & Poutanen, J. 2016b, MNRAS, 457, 1101, doi: 10.1093/mnras/stw046
- Walton et al. (2014) Walton, D. J., Harrison, F. A., Grefenstette, B. W., et al. 2014, ApJ, 793, 21, doi: 10.1088/0004-637X/793/1/21
- Walton et al. (2015a) Walton, D. J., Middleton, M. J., Rana, V., et al. 2015a, ApJ, 806, 65, doi: 10.1088/0004-637X/806/1/65
- Walton et al. (2015b) Walton, D. J., Harrison, F. A., Bachetti, M., et al. 2015b, ApJ, 799, 122, doi: 10.1088/0004-637X/799/2/122
- Walton et al. (2016) Walton, D. J., Fürst, F., Bachetti, M., et al. 2016, ApJL, 827, L13, doi: 10.3847/2041-8205/827/1/L13
- Walton et al. (2017) Walton, D. J., Fürst, F., Harrison, F. A., et al. 2017, ApJ, 839, 105, doi: 10.3847/1538-4357/aa683e
- Walton et al. (2018) Walton, D. J., Fürst, F., Heida, M., et al. 2018, ApJ, 856, 128, doi: 10.3847/1538-4357/aab610
- Wang et al. (2019) Wang, C., Soria, R., & Wang, J. 2019, ApJ, 883, 44, doi: 10.3847/1538-4357/ab3c4d
- Willingale et al. (2013) Willingale, R., Starling, R. L. C., Beardmore, A. P., Tanvir, N. R., & O’Brien, P. T. 2013, MNRAS, 431, 394, doi: 10.1093/mnras/stt175
- Wilms et al. (2000) Wilms, J., Allen, A., & McCray, R. 2000, ApJ, 542, 914, doi: 10.1086/317016