Mobile Small Polarons Explain Conductivity in Lithium Titanium Oxide Battery Electrodes
Abstract
Lithium titanium oxide Li4Ti5O12 (LTO) is an intriguing anode material promising particularly long lived batteries, due to its remarkable phase stability during (dis)charging of the cell. However, its usage is limited by its low intrinsic electronic conductivity. Introducing oxygen vacancies can be one method to overcome this drawback, possibly by altering the charge carrier transport mechanism. We use Hubbard corrected density-functional theory (DFT+U) to show that polaronic states in combination with a possible hopping mechanism can play a crucial role in the experimentally observed increase of electronic conductivity. To gauge polaronic charge mobility, we compute relative stabilities of different localization patterns and estimate polaron hopping barrier heights. With this we finally show how defect engineering can indeed raise the electronic conductivity of LTO up to the level of its ionic conductivity, thereby explaining first experimental results for reduced LTO.
Institute of Energy an Climate Research (IEK-9), Forschungszentrum Jülich, 52425 Jülich, Germany
1 Introduction
Energy storage solutions such as Li-ion batteries (LIB) are a key technology in the transition from a fossil fuel based economy to a society based on sustainable resource management.1, 2 Despite the tremendous advancements in battery research over the last few years,3 durability and especially storage capacity still need significant improvements for batteries to represent a viable alternative e.g. in the transport and mobility sectors.4, 2 One promising material envisioned as a potential remedy for these problems in conventional as well as all-solid state batteries (ASSB) is lithium titanium oxide (LTO).2 Zero strain insertion, high cycling stability and a stable charge/discharge plateau render LTO an excellent anode material for long living batteries.4, 5, 6, 2 Its general use, however, is still limited by the fact that LTO suffers from a very low intrinsic electronic conductivity.7, 8 One way to overcome this drawback is to expose LTO to a reductive hydrogen atmosphere at elevated temperatures, leading to the formation of oxygen vacancies. As experimental data shows 9, this not only causes a color change from white to blue but also lowers electronic resistance and impedance. Moreover, this blue LTO also shows improved Li-ion mobility compared to pristine white LTO.9
Unfortunately, neither of these improvements in carrier mobility are currently fully understood from a mechanistic viewpoint. Yet, first hints at the nature of the improved electronic conductivity in LTO emerged recently with the experimental discovery of paramagnetic Ti3+ centers.9, 8, 10, 11 The significance of these becomes apparent considering an analogous case in TiO2, where oxygen vacancies are known to lead to the formation of small polarons mainly localized on Ti sites.12, 13, 14 While these polarons are somewhat attracted to the vacancy itself,15, 16 they were also shown to be very mobile, with kinetic barriers that can easily be overcome at room temperature.17 In this context we studied the formation and stability of polarons in bulk LTO, as well as the kinetic barriers separating them. Especially the latter strongly hints at a polaron hopping mechanism as the source of the observed improvement of electronic conductivity in blue LTO.
2 Results
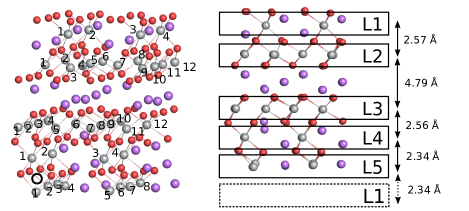
For our analysis we considered a supercell of Li4Ti5O12 (LTO) in its most stable6 spinel configuration,18 and created an oxygen vacancy at the energetically most favorable of the symmetry inequivalent sites (cf. supplementary material). This realization of the structural Li/Ti disorder is known to exhibit a Ti-deficient zone separating titanium layers as illustrated in Figure 1. It therefore lets us examine the interplay between structure, in the form of Li-rich and Li-poor regions, and function of the material. Removing a neutral oxygen atom from the simulation cell gives rise to two excess electrons, which can form two polaronic Ti3+ centers. In standard semi-local LDA19 or GGA20 based DFT these can generally not be described at all due to the functionals’ well known charge and spin delocalization errors.21 As a cost-efficient remedy, we here make use of the popular Hubbard corrected 22, 23, 24 variant of the PBE20 functional (PBE+U) in combination with the matrix control approach.25, 26 This combination has not only been shown to yield easy access to all manners of polaron configurations but also to yield excellent results compared to the computationally much more expensive hybrid DFT functionals.15 Given the great structural complexity of defect-rich LTO, there is a large number——of unique polaron localization patterns even in our relatively small simulation box. To distinguish them we calculated their relative stability according to where denotes the total energy of a given simulation box calculated with DFT and denotes the total energy of the most stable structure found so far. Hence, following standard procedures,12 the most stable configuration serves as zero point of our energy scale, with all other configurations possessing positive relative energy.
An exhaustive computational sampling is complicated further by the fact that the electrons can localize both in a triplet or an open-shell singlet configuration.12, 13 On the other hand, many of these patterns are, if not fully degenerate, at least very close in energy. For a first demonstration of the existence and mobility of polarons in LTO and their influence on the electronic conductivity a complete sampling of all configurations is therefore not necessary. Instead, we focus on triplet configurations and localization patterns representative for the system as a whole. In detail, we considered 13 patterns with different distances to the defect site, localized within different Ti layers in the bulk unit cell. To distinguish them, we adapt a naming convention used in our earlier work15 to the case of LTO, cf. Figure 1. We found the most stable defect position to be located in the center of the Ti-rich region of our layered LTO model (black circle in Figure 1, cf. also supplementary material). This localization is not at all surprising, as it allows the O-vacancy to be as far as possible from the Li-rich zone of our simulation cell and the structural distortions caused by it. Using this defect position throughout, Table 1 lists our obtained results regarding the relative stability of different polaron localization patterns.
For vertical layer–layer distances see Fig. 1. system Erel [eV] d[Å] system Erel [eV] d[Å] L3-7/L2-9 0.00 6.6 L5-1/L3-12 0.45 7.9 L3-8/L3-4 0.12 6.0 L4-2/L4-4 0.75 5.9 L3-7/L3-12 0.13 7.9 L1-1/L1-4 0.77 10.0 L2-7/L2-8 0.14 5.9 L5-5/L4-2 0.82 7.9 L3-9/L3-12 0.23 3.0 L4-3/L4-4 1.00 6.0 L2-9/L2-12 0.26 2.9 L5-1/L5-5 2.59 6.0
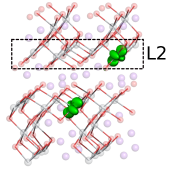
We found that the most stable configurations are those where one polaron is located in L2 and the other is located in L3 (cf. Figure 2a), followed by configurations where both polarons are either located in L2 or L3. The main difference is that “same-plane” polarons approach each other more closely and hence Coulomb repulsion is more pronounced compared to the most stable L3-X/L2-Y configurations. Furthermore, our analysis shows that there is also a tendency for polarons to be less stable the closer they are located to the defect site. This is clearly indicated by the configurations where both excess electrons are localized on Ti atoms belonging to layers L4 or L5 (see supplementary information for detailed distances to the defect site). Both of these effects compete with each other, such that polarons try to adopt configurations with maximal distances to the defect and between each other. This situation seems similar to TiO2 where the oxygen defect is acting as a charge trapping center.27, 28 However, in LTO one can not directly extract a clear stability trend with the distance to the defect, as positively charged Li-ions also show some influence on the overall stabilities of the polarons.29 Indeed, our choice of LTO cell allows us to quantify their influence, considering the fact that all our most stable defect configurations are located next to the Li-rich zone situated between L2 and L3.
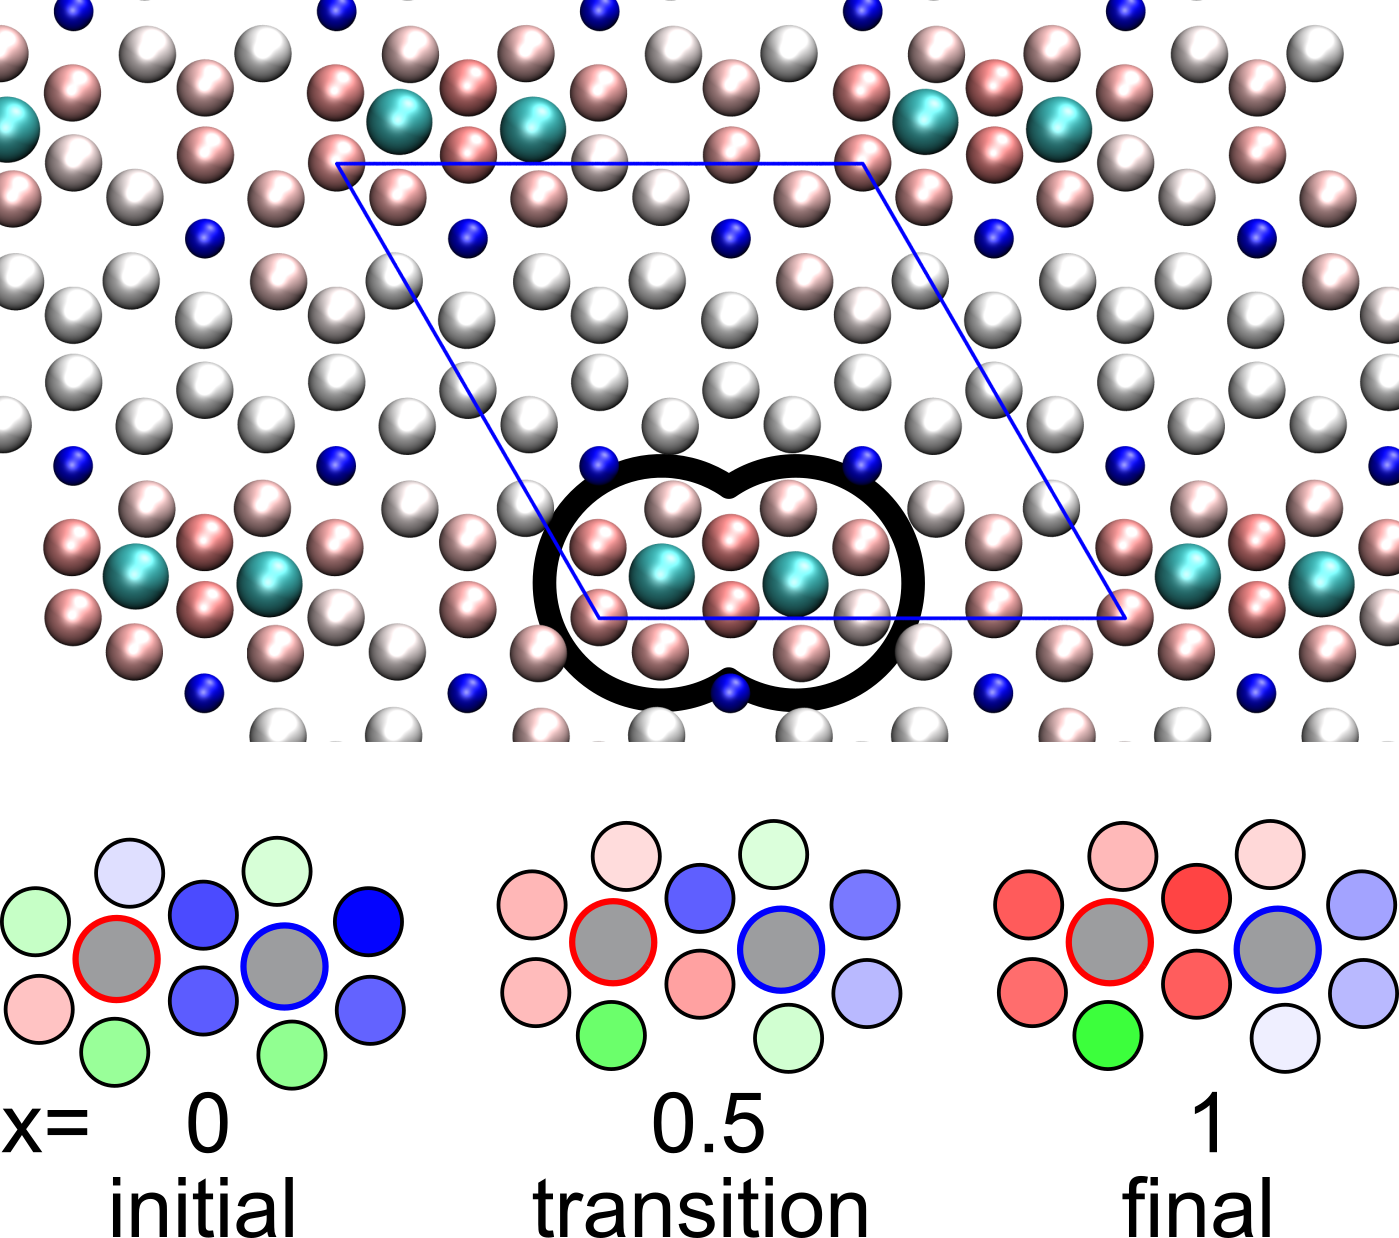
Finally, in order to gauge the polaron mobility we calculate hopping barriers between our most stable configuration and adjacent Ti atoms. To this end, we again make use of the matrix control approach,25, 26 but with a modified occupation matrix scheme outlined in the supplementary material. This approach allows us to restrain the electronic configuration of the system along a pre-selected reaction coordinate x, which linearly interpolates between two stable polaronic states, localized at neighboring atoms. Representatively for all hopping processes in the system we compute the “in-plane” transition of L3-7/L2-10 (x = 0.0) to L3-7/L2-9 (x = 1.0) and the “out-of-plane” transition of L3-7/L1-3 (x = 0.0) to L3-7/L2-9 (x = 1.0).
We illustrate this pathway in Figure 2, which in a) shows the spin density of the final state L3-7/L2-9 and in b) depicts we the relaxation of atoms from their respective sites in the pristine crystal for the transition from L3-7/L2-10 to L3-7/L2-9 via a transition state. We thereby only depict O atoms nearest to the involved Ti sites as only these show any significant distortion during a full geometry optimization. Figure 2b clearly shows relaxation of the O-atoms towards the respective Ti3+ sites in the initial (L2-10, blue) and final (L2-9, red) states, indicating a small polaron hopping mechanism. A similar picture arises for the transition from L3-7/L1-3 to L3-7/L2-9 (not pictured).
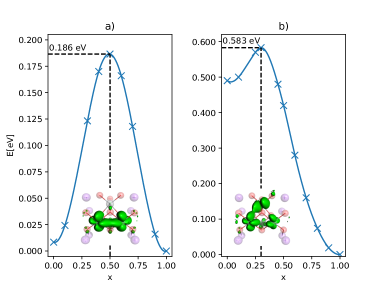
The energy profiles of these two transitions are depicted in Figure 3. As highlighted by the dashed black lines, the hopping barriers for transition L3-7/L2-10 to L3-7/L2-9 and for transition L3-7/L1-3 to L3-7/L2-9 are 186 meV and 583 meV respectively, with the later being much larger due to the already significant energy difference of 485 meV between the two stable states. With these barrier heights we can roughly estimate the in- and out-of-plane conductivity based on a simple hopping model (cf. supplementary material) and using an experimentally measured density of Ti3+ centers of 30 as a measure for the charge carrier density. For the in-plane conductivity we thus find a value of mS/cm, while the significantly higher out-of-plane hopping barrier results in a much smaller conductivity of mS/cm. To put these results into context, even our lower bound for the conductivity of reduced LTO is already five orders of magnitude higher than the pristine material,30 while our ideal upper bound is of the order of the ion conductivities in currently employed electrolytes.31 Note that the estimate for the ideal conductivity rests on the assumption that there are no other, significantly higher barriers along the whole pathway of charge percolation through the crystal. This implies a distribution of defects aligned along the [100] axis of the crystal. Considering the fairly high density of oxygen defects present in blue LTO, such a case is certainly achievable.
3 Discussion
To conclude, our stability analysis clearly indicates that the experimentally observed Ti3+ centers in reduced LTO can in fact be the result of small polaron formation. Moreover, comparatively small barrier heights indicate that charge hopping dynamics can already occur at room temperature. This renders a polaron hopping mechanism to be the most likely origin of the increased electronic conductivity observed in blue LTO. Indeed a simple conductivity model puts even the worst estimate of mS/cm five orders of magnitude above pristine LTO. On the other hand, the ideal predicted case based on an in-plane hopping mechanism would lead to a conductivity of mS/cm, which, though significantly lower than that of other anode materials 32, 31, 33, is nevertheless comparable to the ion conductivities of the pristine material and super–ionic conductors.34, 10, 2 Moreover, the existence of polarons also hints at a mechanism for the improved ion diffusivity in blue LTO, which is about twice that of pristine LTO.30 The presence of polarons, which we have shown to localize near Li-rich regions, could serve to “soften” the environment for Li-diffusion by screening the positive charge carriers. Thus, both, the ideal polaron conductivity of blue LTO, and its improved Li diffusivity, would make it a suitable option for an anode material for use in tomorrow’s batteries. Note that our results show a very wide range of potential conductivity values, depending on defect patterning, local crystal structure and crystal orientation. Our study thus highlights the potential and also pitfalls of defect engineering as a means for the generation of mobile charge carriers in otherwise insulating materials.
 |
 |
| a) | b) |
4 Methods
All necessary calculations have been carried out using the FHI-aims code.35 To achieve adequate electron localization we used the DFT+U23 variant of the PBE 20 exchange correlation functional. In detail we used the rotationally invariant +U form 24 with the double-counting correction in the fully localized limit.36 The Ti atomic like basis functions served as Hubbard projectors and a U value of 2.65 eV has been applied. Numerical convergence has been reached using a tight tier1 basis—roughly equivalent to a polarized triple zeta split valence Gaussian type orbital basis set37—employing a 2 2 1 k-point grid. Geometries have been relaxed until residual force fell below eV/Å. A detailed description of the methodology used to estimate barriers is given in the supplementary material.
5 Acknowledgements
The authors would like to thank the German Research Foundation DFG (Grant OB425/4-1) and the Solar Technologies Go Hybrid Initiative of the State of Bavaria for support. Partially funded by the Deutsche Forschungsgemeinschaft (DFG, German Research Foundation) under Germany’s Excellence Strategy – EXC 2089/1 – 390776260.
References
- Islam and Fisher 2014 Islam, M. S.; Fisher, C. A. J. Lithium and sodium battery cathode materials: computational insights into voltage, diffusion and nanostructural properties. Chem. Soc. Rev. 2014, 43, 185–204
- Zhao et al. 2015 Zhao, B.; Ran, R.; Liu, M.; Shao, Z. A comprehensive review of Li4Ti5O12-based electrodes for lithium-ion batteries: The latest advancements and future perspectives. Mater. Sci. Eng. R Rep 2015, 98, 1–71
- Chu and Majumdar 2012 Chu, S.; Majumdar, A. Opportunities and challenges for a sustainable energy future. Nature 2012, 488, 294 EP–
- Armand and Tarascon 2008 Armand, M.; Tarascon, J.-M. Building better batteries. Nature 2008, 451, 652 EP–
- Aricò et al. 2005 Aricò, A. S.; Bruce, P.; Scrosati, B.; Tarascon, J.-M.; van Schalkwijk, W. Nanostructured materials for advanced energy conversion and storage devices. Nat. Mater. 2005, 4, 366–377
- Heenen et al. 2017 Heenen, H. H.; Scheurer, C.; Reuter, K. Implications of occupational Disorder on ion mobility in Li4Ti5O12 battery materials. Nano Lett. 2017, 17, 3884–3888
- Yuan et al. 2010 Yuan, T.; Yu, X.; Cai, R.; Zhou, Y.; Shao, Z. Synthesis of pristine and carbon-coated Li4Ti5O12 and their low-temperature electrochemical performance. J. Power Sources 2010, 195, 4997–5004
- Yan et al. 2015 Yan, B.; Li, M.; Li, X.; Bai, Z.; Yang, J.; Xiong, D.; Li, D. Novel understanding of carbothermal reduction enhancing electronic and ionic conductivity of Li4Ti5O12 anode. J. Mater. Chem. A 2015, 3, 11773–11781
- Qiu et al. 2014 Qiu, J.; Lai, C.; Gray, E.; Li, S.; Qiu, S.; Strounina, E.; Sun, C.; Zhao, H.; Zhang, S. Blue hydrogenated lithium titanate as a high-rate anode material for lithium-ion batteries. J. Mater. Chem. A 2014, 2, 6353–6358
- Kaftelen et al. 2013 Kaftelen, H.; Tuncer, M.; Tu, S.; Repp, S.; Göçmez, H.; Thomann, R.; Weber, S.; Erdem, E. Mn-substituted spinel Li4Ti5O12 materials studied by multifrequency EPR spectroscopy. J. Mater. Chem. A 2013, 1, 9973–9982
- Jakes et al. 2015 Jakes, P.; Granwehr, J.; Kungl, H.; Rüdiger-A, E. Mixed ionic-electronic conducting Li4Ti5O12 as anode material for lithium ion batteries with enhanced rate capability - impact of oxygen non-stoichiometry and aliovalent Mg2+-doping studied by electron paramagnetic resonance. Z. Phys. Chem. 2015, 229, 1439–1450
- Deskins et al. 2011 Deskins, N. A.; Rousseau, R.; Dupuis, M. Distribution of Ti3+ surface sites in reduced TiO2. J. Phys. Chem. C 2011, 115, 7562–7572
- Shibuya et al. 2012 Shibuya, T.; Yasuoka, K.; Mirbt, S.; Sanyal, B. A systematic study of polarons due to oxygen vacancy formation at the rutile TiO2(110) surface by GGA+U and HSE06 methods. J. Phys. Condens. Matter 2012, 24, 435504
- Setvin et al. 2014 Setvin, M.; Franchini, C.; Hao, X.; Schmid, M.; Janotti, A.; Kaltak, M.; Van de Walle, C. G.; Kresse, G.; Diebold, U. Direct view at excess electrons in rutile and anatase. Phys. Rev. Lett. 2014, 113, 086402
- Kick et al. 2019 Kick, M.; Reuter, K.; Oberhofer, H. Intricacies of DFT+U, not only in a numeric atom centered orbital framework. J. Chem. Theor. Comput. 2019, 15, 1705–1718
- Reticcioli et al. 2018 Reticcioli, M.; Setvin, M.; Schmid, M.; Diebold, U.; Franchini, C. Formation and dynamics of small polarons on the rutile (110) surface. Phys. Rev. B 2018, 98, 045306
- Kowalski et al. 2010 Kowalski, P. M.; Camellone, M. F.; Nair, N. N.; Meyer, B.; Marx, D. Charge localization dynamics induced by oxygen vacancies on the surface. Phys. Rev. Lett. 2010, 105, 146405
- Deschanvres et al. 1971 Deschanvres, A.; Raveau, B.; Sekkal, Z. Mise en evidence et etude cristallographique d’une nouvelle solution solide de type spinelle . Mater. Res. Bull. 1971, 6, 699–704
- Hohenberg and Kohn 1964 Hohenberg, P.; Kohn, W. Inhomogeneous electron gas. Phys. Rev. 1964, 136, B864–B871
- Perdew et al. 1996 Perdew, J. P.; Burke, K.; Ernzerhof, M. Generalized gradient approximation made simple. Phys. Rev. Lett. 1996, 77, 3865–3868
- Cohen et al. 2008 Cohen, A. J.; Mori-Sánchez, P.; Yang, W. Insights into current limitations of density functional theory. Science 2008, 321, 792–794
- Hubbard 1963 Hubbard, J. Electron correlations in narrow energy bands. Proc. R. Soc. A 1963, 276, 238–257
- Anisimov et al. 1991 Anisimov, V.; Zaanen, J.; Andersen, O. K. Band theory and Mott insulators: Hubbard U instead of Stoner I. Phys. Rev. B 1991, 44, 943–954
- Dudarev et al. 1998 Dudarev, S. L.; Botton, G. A.; Savrasov, S. Y.; Humphreys, C. J.; Sutton, A. P. Electron-energy-loss spectra and the structural stability of nickel oxide: An LSDA+U study. Phys. Rev. B 1998, 57, 1505–1509
- Dorado et al. 2009 Dorado, B.; Amadon, B.; Freyss, M.; Bertolus, M. . Phys. Rev. B 2009, 79, 235125
- Allen and Watson 2014 Allen, J. P.; Watson, G. W. Occupation matrix control of d- and f-electron localisations using DFT + U. Phys. Chem. Chem. Phys. 2014, 16, 21016–21031
- Kohtani et al. 2017 Kohtani, S.; Kawashima, A.; Miyabe, H. Reactivity of trapped and accumulated electrons in titanium dioxide photocatalysis. Catalysts 2017, 7, 303
- Diebold 2003 Diebold, U. The surface science of titanium dioxide. Surf. Sci. Rep. 2003, 48, 53–229
- Morgan and Watson 2010 Morgan, B. J.; Watson, G. W. description of lithium intercalation into anatase . Phys. Rev. B 2010, 82, 144119
- Nasara et al. 2017 Nasara, R. N.; Tsai, P.-C.; Lin, S.-K. One-step synthesis of highly oxygen-deficient lithium titanate oxide with conformal amorphous carbon coating as anode material for lithium ion batteries. Adv. Mater. Interfaces 2017, 4
- Park et al. 2010 Park, M.; Zhang, X.; Chung, M.; Less, G. B.; Sastry, A. M. A review of conduction phenomena in Li-ion batteries. J. Power Sources 2010, 195, 7904–7929
- Dutta 1953 Dutta, A. K. Electrical Conductivity of Single Crystals of Graphite. Phys. Rev. 1953, 90, 187–192
- Creffield et al. 1974 Creffield, G. K.; Down, M. G.; Pulham, R. J. Electrical resistivity of liquid and solid lithium. J. Chem. Soc., Dalton Trans. 1974, 2325–2329
- Stenina et al. 2015 Stenina, I. A.; Il’in, A. B.; Yaroslavtsev, A. B. Synthesis and ionic conductivity of Li4Ti5O12. Inorg. Mater. 2015, 51, 62–67
- Blum et al. 2009 Blum, V.; Gehrke, R.; Hanke, F.; Havu, P.; Havu, V.; Ren, X.; Reuter, K.; Scheffler, M. Ab initio molecular simulations with numeric atom-centered orbitals. Comput. Phys. Commun. 2009, 180, 2175–2196
- Himmetoglu et al. 2014 Himmetoglu, B.; Floris, A.; de Gironcoli, S.; Cococcioni, M. ”Hubbard-corrected DFT energy functionals: The LDA+U description of correlated systems”. Int. J. Quantum Chem. 2014, 114, 14–49
- Lamiel-Garcia et al. 2017 Lamiel-Garcia, O.; Ko, K. C.; Lee, J. Y.; Bromley, S. T.; Illas, F. When Anatase nanoparticles become bulklike: Properties of realistic TiO2 nanoparticles in the 1–6 nm size range from all electron relativistic density functional theory based calculations. J. Chem. Theor. Comput. 2017, 13, 1785–1793