Asymmetric Surface Brightness Structure of Caustic Crossing Arc in SDSS J1226+2152: A Case for Dark Matter Substructure
Abstract
We study the highly magnified arc SGAS J122651.3+215220 caused by a star-forming galaxy at crossing the lensing caustic cast by the galaxy cluster SDSS J1226+2152 (), using Hubble Space Telescope observations. We report in the arc several asymmetric surface brightness features whose angular separations are a fraction of an arcsecond from the lensing critical curve and appear to be highly but unequally magnified image pairs of underlying compact sources, with one brightest pair having clear asymmetry consistently across four filters. One explanation of unequal magnification is microlensing by intracluster stars, which induces independent flux variations in the images of individual or groups of source stars in the lensed galaxy. For a second possibility, intracluster dark matter subhalos invisible to telescopes effectively perturb lensing magnifications near the critical curve and give rise to persistently unequal image pairs. Our modeling suggests, at least for the most prominent identified image pair, that the microlensing hypothesis is in tension with the absence of notable asymmetry variation over a six-year baseline, while subhalos of – anticipated from structure formation with Cold Dark Matter typically produce stationary and sizable asymmetries. We judge that observations at additional times and more precise lens models are necessary to stringently constrain temporal variability and robustly distinguish between the two explanations. The arc under this study is a scheduled target of a Director’s Discretionary Early Release Science program of the James Webb Space Telescope, which will provide deep images and a high-resolution view with integral field spectroscopy.
keywords:
gravitational lensing: micro – gravitational lensing: strong – dark matter – galaxies: clusters: individual: SGAS J122651.3+215220; SDSS J1226+21521 Introduction
Massive clusters of galaxies are powerful cosmic gravitational lenses that often make outstanding magnified images of background galaxies, usually referred to as “arcs”. The most dramatic phenomenon takes place when a background galaxy happens to straddle the caustic cast by the foreground gravitational lens, offering an opportunity to closely study an elongated image of the galaxy with a zoomed-in view near the caustic. Smoothly distributed mass in the foreground lens universally produces symmetric pairs of merging images near a fold lensing critical curve. However, intracluster microlensing of individual superluminous stars in the source galaxy (Miralda-Escudé, 1991; Venumadhav et al., 2017; Diego et al., 2018; Oguri et al., 2018b) or sub-galactic dark matter (DM) substructure predicted to exist in cluster halos (Press & Schechter, 1974; White & Rees, 1978; Davis et al., 1985), can cause temporary or persistent departure from the symmetric appearance of the arc, respectively.
By analysing this image asymmetry one can study distant extragalactic objects that are otherwise prohibitively difficult to probe. First, microlensing allows one to scrutinize individual bright stars at (Kelly et al., 2018; Chen et al., 2019; Kaurov et al., 2019), or reveal stellar transients from the distant Universe (Rodney et al., 2018; Diego, 2019; Windhorst et al., 2018). The upcoming 192-orbit HST program (GO-15936, PI: Kelly) may increase the number of detections of extremely bright extragalactic stars (Kelly et al., 2019). This may be used to probe the intracluster population of stellar microlenses inside the cluster halo, or even a multitude of (sub-)planetary mass self-gravitating DM minihalos if they form in large abundance during the early Universe (Dai & Miralda-Escudé, 2019; Arvanitaki et al., 2019; Blinov et al., 2019). Second, perturbations in the shape of the critical curve on scales will inform us about the abundance of DM subhalos within the cluster-sized lens halo (Dai et al., 2018), thereby probing a dynamic range not easily accessible with other methods.
Previously, multi-epoch Hubble Space Telescope (HST) observations in the field of the galaxy cluster MACS J0416.1-2403 allowed Chen et al. (2019) and Kaurov et al. (2019) to carry out independent studies of time-varying image asymmetries in a arc crossing the cluster critical curve. Both groups suggested that the most significant asymmetric feature is at least partially caused by microlensing induced random brightening of macro images of an underlying supergiant star. Interestingly, the boost in brightness was detected in 2014 for the former and in 2012 for the latter. Moreover, Kaurov et al. (2019) mentioned that the arc may have several other less significant asymmetric features.
In this paper, we examine the giant arc SGAS J122651.3+215220 (hereafter S1226) with a spectroscopic redshift in the field of the galaxy cluster SDSS J1226+2152. This arc, resulting from two images of a background galaxy merging along a critical line, was first discovered from the SDSS Giant Arcs Survey (SGAS) as a Lyman Break Galaxy during intense star formation (Koester et al., 2010a). Concerning the study of image asymmetries, S1226 is particularly advantageous because it exhibits multiple bright compact star-forming clumps, whose image pairs across the critical curve have small angular separations and hence are highly magnified. We examine HST imaging data obtained in 2011 in two optical filters F606W and F814W, and data obtained in 2017 in two infrared (IR) filters F110W and F160W. We identify several asymmetric image pairs following a method similar to the one presented in Kaurov et al. (2019) for an arc in the field of MACS J0416.1-2403, and then carry out an analysis based on template matching to robustly measure the absolute fluxes and flux asymmetry of image pairs.
We identify in S1226 at least three magnified image pairs of significant surface brightness asymmetries in the F606W and F814W filters, among which the brightest one also shows significant and consistent asymmetry in the lower resolution F110W and F160W filters. This is unexpected for a smooth mass distribution in the lens. Located within a fraction of an arcsecond from the critical curve, these asymmetric features must be highly magnified images of underlying sources in the star-forming galaxy smaller than a few parsecs, and the high intrinsic luminosities imply that they are probably groups of many bright stars rather than individual super-bright stars. The brightest pair has a high degree of asymmetry consistent in all four HST filters, with tentative evidence for persistence over a six-year observing baseline. We find that the absence of significant variability in asymmetric features implies tension with stochastic intracluster microlensing as the explanation for the asymmetry. On the other hand, we suggest that lensing by sub-galactic DM subhalos of masses – as predicted by the standard theory of hierarchical structure assembly with Cold Dark Matter (CDM) (Moore et al., 1999; Springel et al., 2008; Fiacconi et al., 2016) can explain persistent asymmetries at the observed level. This derives from the idea of using image flux ratios as diagnostic of invisible substructure (Mao & Schneider, 1998; Metcalf & Madau, 2001), but extends from galactic host halos (Gilman et al., 2019) to more massive ones and into the regime of large magnification factors , by examining just one caustic straddling system. Lack of existing multi-epoch imaging in any single HST filter, however, prevents us from decisively ruling out microlensing variability in favor of substructure lensing. Promisingly, S1226 has been selected as a target of the approved Director’s Discretionary Early Release Science (DD-ERS) program with the James Webb Space Telescope (JWST) (# 1335, PI: Rigby) (Rigby et al., 2017). Forthcoming data will make this highly magnified arc a particularly interesting system.
This paper is organized as follows: in Sec. 2 we summarize existing HST and the upcoming JWST data. Then in Sec. 3, we show the under-resolved star-forming clumps exhibiting significant flux asymmetry between their highly magnified image pairs. In Sec. 4, we use the macro lens model describing the galaxy cluster SDSS J1226+2152 to infer coarse-grained properties at the location of the arc. In Sec. 5, we estimate the abundance of foreground intracluster stars in the arc projected vicinity, which is useful information for quantitatively understanding microlensing. We then consider two possible physical explanations for the observed image asymmetry: time-varying intracluster microlensing in Sec. 6, and persistent DM substructure lensing in Sec. 7. We conclude that intracluster microlensing is not conclusively ruled out but is unfavorable in light of the roughly consistent asymmetries across a six-year observational baseline, while DM subhalo lensing is theoretically expected and naturally explains non-variability. Finally, we give concluding remarks in Sec. 8. Furthermore, we include App. A presenting non-rigid registration as an alternative method to corroborate the existence of flux asymmetries, and App. B providing data analysis details. In App. C, we analytically estimate magnification asymmetry induced by perturber lenses in the proximity of the critical curve, supporting the argument that nearby minor cluster member galaxies are not the cause of the observed asymmetries.
2 Data
The caustic-straddling lensed arc SGAS 122651.3+215220 was discovered in December 2007 at the 2.5m Nordic Optical Telescope (Koester et al., 2010b) and is in the catalog of SDSS Giant Arcs Survey (SGAS; Hennawi et al. (2008)). The arc redshift is determined to be from nebular lines (Rigby et al., 2018). The spectroscopic redshift of the galaxy cluster lens SDSS J1226+2152 was reported by Bayliss et al. (2014). Data were used to perform lens modeling with the LENSTOOL software package (Jullo et al., 2007). It approximates the cluster mass distribution as a linear superposition of mass halos and then uses Markov Chain Monte Carlo sampling to determine the best-fit set of parameters for the lens model. The fitting procedure for analogous clusters is described in Sharon et al. (2019).
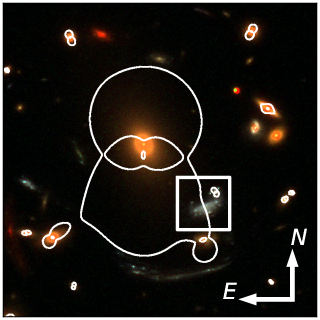
The arc S1226 was imaged in multiple HST filters. We use for our analysis images taken with the Advanced Camera for Surveys (ACS) in two optical filters, F606W and F814W, and with the Wide Field Camera 3 (WFC3) in two IR filters, F110W and F160W. The images in the optical filters were obtained 6 years prior to the images obtained in the IR filters. Tab. 1 summarizes the observations. In Fig. 1, we show a composite false-color image of the cluster and a zoomed-in view of the arc.
The arc will be observed with the Near Infrared Spectrograph (NIRSpec) and the Mid-Infrared Instrument (MIRI) integral field unit (IFU) and imaged with the Near Infrared Camera (NIRCam) in multiple filters aboard JWST, as part of the DD-ERS program (see Tab. 2 for details).
| Instrument | Filter | Exposure [ks] | Date | Program # | PI |
|---|---|---|---|---|---|
| ACS | F606W | 2.0 | 2011-04-14 | 12368 | Morris |
| ACS | F606W | 2.0 | 2011-04-15 | 12368 | Morris |
| ACS | F814W | 2.0 | 2011-04-14 | 12368 | Morris |
| ACS | F814W | 2.0 | 2011-04-15 | 12368 | Morris |
| WCF3 | F110W | 1.2 | 2017-12-18 | 15378 | Bayliss |
| WCF3 | F160W | 1.3 | 2017-12-18 | 15378 | Bayliss |
| Instrument | Filters/methods | Exposure [ks] |
|---|---|---|
| NIRSPEC | F170LP, G235H (IFU) | 8.3 |
| MIRI | F560W, MRS (IFU) | 3.6 |
| NIRCAM | F115W, F277W | 0.3 |
| NIRCAM | F150W, F356W | 0.3 |
| NIRCAM | F200W, F444W | 0.3 |
3 Asymmetries in the arc
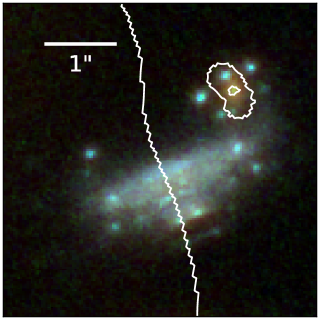
According to our macro lens model, the portion of the critical line that passes through the arc is nearly a straight line and is approximately perpendicular to the direction of arc elongation (shown as the white curve in Fig. 1), except that a small cluster member galaxy to the northwest (also shown in Fig. 1 with the small critical curve it generates) slightly deforms the surface brightness profile of the arc. The focus of this study is on the brightest part of the arc on the south which is not significantly influenced by the galaxy perturber (also see discussion in Sec. 7.1). Images of the arc in four HST filters are shown in Fig. 2, after rotation to make the principal axis of elongation of the arc horizontal. Our five slits are shown in the bottom panel, on the same image of the arc as in Fig. 1. If the lens surface mass distribution is locally smooth, a symmetric appearance across the critical curve is expected.
In Sec. 3.1, we first qualitatively show evidence for departure from symmetry using a simple method which was previously applied to a similar caustic-straddling arc in MACS J0416.1-2403 (Kaurov et al., 2019). In this method, we align multiple slits with the direction of arc elongation, and identify prominent bright features on both sides of the critical curve that are likely to be image pairs of major underlying compact sources. We then undertake a rigorous measurement of their flux inequality that is described in Sec. 3.2.
3.1 Slits
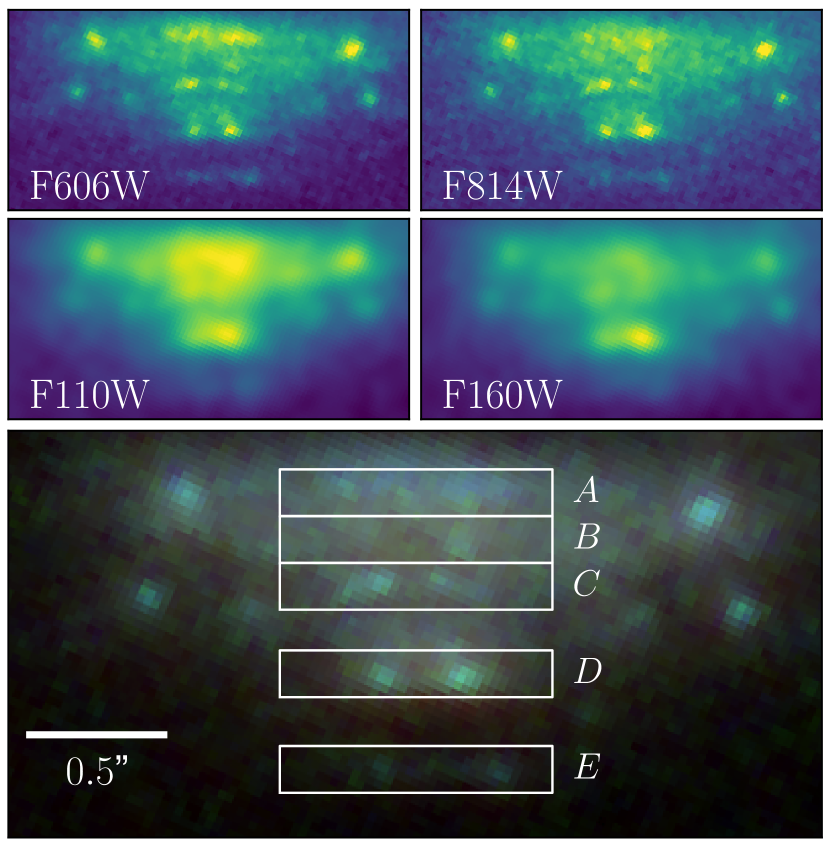
We define five slits along the critical curve, each of which is positioned to align with the direction of arc elongation and to include a pair of major surface brightness features, as shown in Fig. 2. For every HST filter, we sum the flux along the perpendicular direction, and plot the summed flux as a function of the position along the slit direction in Fig. 3.
In Slit D, a major pair of flux peaks in both F606W and F814W is clear, with sizable asymmetries that are compatible between the two filters. The pair of peaks is also present in F110W and F160W, but are broadened by the wider point spread functions (PSFs). In each of Slits B, C and E, a major pair of unequal peaks are also visible in F606W and F814W, but other minor peaks make the pair identification less clear. Asymmetric double-peaked profiles in rough correspondence are also visible in the two IR filters. The profiles in slit A are more complex with multiple peaks of comparable heights and are harder to interpret.
To further explore the presence of asymmetric image pairs, we apply in App. A a non-physical technique to search for asymmetric features which flexibly accounts for small deviations from perfect fold symmetry. As shown there, this method highlights the asymmetric features in Slits C and D in F606W and F814W, as well as the feature in Slit E in F606W. The most outstanding feature in Slit D is also clear from the results for F110W and F160W.
We interpret the major flux double peaks in Slits B, C, D and E as pairs of highly magnified images of luminous, compact star-forming regions near the macro caustic. For these image pairs with sub-arcsecond separation, significantly asymmetric magnifications are however unexpected from a smooth lens. Note that other image pairs at larger separations, , may have unequal magnifications that can be explained by higher order corrections to an idealized fold lens model near the critical curve.
3.2 Flux asymmetries
Motivated by the findings of Sec. 3.1 through eyeballing slit flux profiles, we now set out to measure asymmetric fluxes carefully. We relegate extra technical details of this analysis to App. B.
Adopting the assumption that lensed images are underresolved, we model major macro lensed images with appropriate PSFs. This assumption is valid if sources are individual stars or star groups that are more compact than , where is the magnification.
In each filter separately, and for each asymmetric feature under study, we first create a suitable cutout which consists of pixels and contains the presumptive image pair. The cutout is chosen to be large enough to capture most information provided by the PSFs of the image pair, but cropped to exclude complex neighboring surface brightness structures. We evaluate a likelihood function , where we define the chi-squared function:
| (1) |
Here is the flux in pixel , which we fit to the superposition of two PSFs representing a pair of unresolved images centered at with fluxes for respectively, and components of diffuse surface brightness background with profiles , parameterized by an additional set of parameters , for , respectively. We introduce the inverse weights to quantify flux errors, making the simplifying assumption that errors are uncorrelated among pixels. In this work, we set all ’s to be a uniform number (i.e. the white noise approximation). Refer to App. B for our choices for the diffuse background profiles and .
In Eq. (1), the noise should not be interpreted as a photometric error only. In fact, the HST images are deep enough that detector noise and photon shot noise are subdominant. We adopt the philosophy that mainly reflects our ignorance about the details of an underlying population of minor surface brightness structures on the arc, acting as an effective noise background when we fit the image pairs. To avoid overfitting due to over-constrained background templates used in Eq. (1), we set an empirical value for by requiring that the per effective degree of freedom in Eq. (1), for the maximal likelihood solution, should be around unity. In this way, we include modeling uncertainties about fainter surface brightness structures into our quoted errorbars.
The likelihood evaluation is then coupled to the sampler PyMultiNest (Buchner et al., 2014) to derive the joint posterior distribution of the model parameters. Flat priors are adopted for all parameters over conservatively wide sampling ranges.
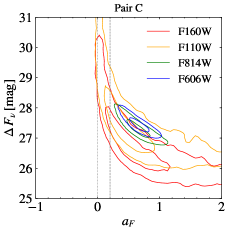
We apply the above methodology to the asymmetric image pairs in Slit C, D and E, which are visually discernible in all four HST filters. From the measured normalizations for the two fitted PSFs, we compute the fractional flux asymmetry
| (2) |
in accord with the fractional magnification asymmetry that will be defined later in Eq. (4), and the absolute flux difference , where () is the flux of the brighter (dimmer) image of the pair. In Fig. 4, we show the measured values for and with their uncertainties.
The image pair in Slit D has a most probable value – from the F606W and F814W filters, with a robust lower bound . The results from the F110W and F160W filters are fully consistent with – but have larger uncertainties. The flux inferred for either of the lensed image pair monotonically increases from the bluest filter to the reddest one, consistent with the color of young, hot stars or young stellar association at . In particular, the pair flux difference is safely brighter than 28th magnitude in F606W and F814W. These results are consistent with lensed macro image pairs with significantly different but achromatic magnification factors, persistent over a timescale of about six years.
Flux asymmetries of features in Slits C and E are also robustly detected in the F606W and F814W filters, with probable values in the range –. Asymmetries and absolute flux measurements in F110W and F160W are subject to large uncertainties because centroiding of point sources is affected by blending in these two filters with wide PSFs. The asymmetry is nevertheless compatible with that seen in F606W and F814W, and a source color consistent with star-forming regions. We therefore find evidence that even the features in Slits C and E exhibit significant asymmetry in optical filters, although consistency in IR filters remains unproven.
Having demonstrated that asymmetric image pairs arise in several places along the critical curve, with at least one bright pair (Slit D) being well measured, in the next Sections we will explore the physical interpretation of this phenomenon.
4 Macro lens model near critical curve
At the location of arc, we infer from the cluster lens model a ratio between the coarse-grained total surface mass density of the lens at the line of sight and the critical surface mass density (Blandford & Narayan, 1986) , where , and are the angular diameter distances to the cluster lens at , to the source galaxy at , and from the lens to the source. This is the local coarse-grained value for the lensing convergence of the macro lens. Near the critical curve, a compact source appears as a pair of macro images, each of which has an unsigned magnification factor
| (3) |
where (signed) equals to half the angular separation between the image pair, is the gradient of inverse magnification in the critical curve vicinity, and is the angle between the critical curve and the direction of arc elongation. Numerically, we measure from our cluster lens model and , which gives . While the lensed arc considered here at is substantially more distant than the caustic straddling lensed galaxies studied in MACS J1149.5+2223 (Kelly et al., 2018) and MACS J0416.1-2403, the magnification factor as a function of image separation across the critical curve is similar in order of magnitude to the values found in those systems.
5 Intracluster stars
The line of sight to the arc is at a projected distance of to the BCG. Intervening intracluster stars can originate from several sources: (i) diffuse light extending from the BCG (Zwicky, 1951; Lin & Mohr, 2004; Zibetti et al., 2005); (ii) diffuse light extending from a major cluster member galaxy south of the arc; (iii) diffuse light extending from a minor cluster member galaxy just away from the arc to the northwest. The minor member galaxy acts as a substructure lens, causing a compact and bright star-forming source to appear in multiple images, as can be seen in the right panel of Fig. 1. The colors measured from the 4 HST filters are consistent between components (i) and (ii), while it is difficult to reliably determine the colors of component (iii) due to arc contamination. Inferred from the image taken in the reddest filter F160W, component (iii) can be safely neglected, and component (ii) is subdominant compared to the diffuse light halo of the BCG, if not entirely negligible.
The major axis of the BCG diffuse light nearly intersects the lensed arc. We fit the isophotes in each HST filter to ellipses centered at the BCG and adopt the same ellipticity for all four filters. We find consistent colors wherever contamination from other sources are negligible. The surface brightness at the location of the arc calculated from the fitted isophote ellipses is within a factor of two when compared to a few nearby places that are not on top of the arc.
We use the population synthesis code Flexible Stellar Population Synthesis (FSPS) to model intracluster stars (Conroy et al., 2009; Conroy & Gunn, 2010) assuming the initial mass function of Kroupa (2001). We find that the colors are consistent with an old simple stellar population, with a single age and metallicity. The age ranges from Gyr for low metallicity to Gyr for high metallicity . Varying from to correspond to a conservative range . While breaking the age-metallicity degeneracy necessitates spectroscopic analysis, we think the most likely age is Gyr with metallicity , a value found typical for intracluster light (ICL) at similar cluster-centric radii in many cluster lenses of similar redshifts (Montes & Trujillo, 2018). This translates into a local surface density of intracluster stars and hence a convergence , which we use hereafter as our fiducial value. This value is comparable to previous estimates carried out for caustic straddling lensed galaxies in MACS J1149.5+2223 (Oguri et al., 2018a) and in MACS J0416.1-2403 (Kaurov et al., 2019).
In calculating , we have included into the synthesized stellar population white dwarfs in addition to main sequences and evolved stars, but have neglected neutron stars and black holes. The latter group are in any case remnants of massive stars , which account for only a sub-dominant fraction of the initial star-forming mass. In our model, intracluster stars have masses in the range –. Insensitive to modeling uncertainty, the most abundant microlenses are main sequence dwarfs whose masses are around .
6 Intracluster Microlensing
The observed flux of a compact source is affected by stellar microlenses near the line of sight, which render the two macro images unequally bright at a given epoch. One possibility is that each observed asymmetric pair of images reflects the microlensing phenomenon acting on either a single super-luminous source star or a compact group of bright source stars in the lensed galaxy. Under this hypothesis, no substructure in the lens mass distribution other than that in individual stellar microlenses needs to be invoked to explain the asymmetries.
Intracluster stars should break the smooth macro critical curve into an interconnected network of micro critical curves, whose full width is –, with our best estimate being . This network band has one edge at the expected location of the macro critical curve, and the other edge lies on its interior (Venumadhav et al., 2017). Under the assumption that the macro critical curve roughly bisects the asymmetric pairs of surface brightness features in Fig. 2, none of the features lie within this band. This implies that microlensing variability is infrequent and occurs over a long timescale for any single lensed star.
6.1 Microlensing of a single source star
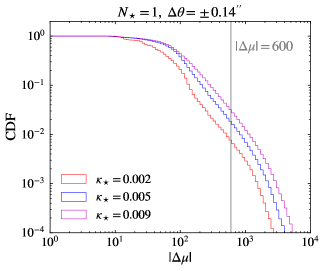
To corroborate this, in Fig. 5 we simulate random realizations of the total microlensing magnification factor for one of the macro images across a small region on the source plane, assuming a macro lens model appropriate for S1226, and stellar microlens masses randomly drawn from a Simple Stellar Population model with age Gyr and . The resolution of these magnification maps is . For – and , appropriate e.g. for the prominent asymmetries in Slits D and C, the range of source-plane length scales indicates that the magnification may vary by order unity on a timescale of several years for a typical effective source-lens relative velocity (see Eq.(12) of Venumadhav et al. (2017)) of .
If the asymmetric fluxes observed in several slits (e.g. Slits C, D and E, and especially Slit D) are due to microlensing of a single source star, the pairs of macro images must have large differences in their magnification factors. At , only the most luminous source stars in the rest-frame UV under unusually high magnification can explain the observed flux asymmetries reported in Fig. 4. The best constraints are obtained from the F814W filter because the asymmetric features are brighter than in F606W, and sharper than in F110W and F160W. In F814W, the image pair flux difference is safely brighter than magnitude in Slits C and D, and is likely as bright as in Slit E. Assuming mag, which is conservative for Slits C and D, we list in Tab. 3 the required minimum magnification differences, , needed to explain the measured flux asymmetries for several candidate types of stars.
The best candidate source stars are low-metallicity blue supergiants (BSG), but even these require a magnification asymmetry . The most luminous main-sequence (MS) stars require much higher magnifications of , which are much less likely. This is under the optimistic assumption of zero dust reddening, while Chisholm et al. (2019) report E(B-V)mag measured for S1226. Since we have conservatively compute for mag, the magnification difference needs to be another factor of four larger in order to explain the asymmetry in Slit D.
There is no evidence for rare stars (e.g. zero metallicity, extremely massive stars) that might be much brighter than those listed in Tab. 3. The rest-frame UV spectrum of the arc analyzed by Chisholm et al. (2019) suggests that S1226 has a moderately sub-solar metallicity and a stellar age –Myr, and is dominated by B-type giants with no trace of O stars detected. The best stellar candidates for the image pairs that can produce asymmetries through microlensing are therefore BSGs as listed in Tab. 3.
The required values of in Tab. 3 clearly exceed the expected macro magnification by a large factor, and are rarely reached as seen in Fig. 5. This large magnification difference is only possible when the source star undergoes a micro caustic transit. Fig. 6 indicates that randomly occurs for less than a few percent of the time. Microlensing of a single source star is therefore unlikely to be the cause of the flux asymmetries seen in the arc. The main difference between the case of S1226 and the caustic straddling galaxies lensed by MACS J1149.5+2223 and MACS J0416.1-2403, which have confirmed microlensed individual stars, is the lower redshift of the latter sources, and , making it much more likely for a microlensed luminous star to reach the faintest observable fluxes.
| stellar type | |||||||
|---|---|---|---|---|---|---|---|
| blue supergiant | 3 | ||||||
| blue supergiant | 3 | ||||||
| blue supergiant | 3 | ||||||
| blue supergiant | 3 | ||||||
| main sequence | 0.3 | ||||||
| main sequence | 0.3 | ||||||
| main sequence | 1 | ||||||
| main sequence | 0.3 |
6.2 Microlensing of a group of source stars
The large asymmetric fluxes are more naturally explained by a group of luminous stars (possibly co-existing with many more fainter stars). Indeed, hot luminous stars commonly cluster in compact star-forming regions or open clusters. The age of the arc stellar population, estimated to be –Myr from rest-frame UV spectroscopy (Chisholm et al., 2019), is longer than that of the BSGs in Tab. 3, which implies that the stellar light is dominated by giant B stars that are individually less massive and luminous than the BSGs in Tab. 3.
The asymmetric image pairs, e.g. in Slits C and D, appear barely resolved in the F814W image. Given the angular distance from the cluster critical curve, our macro lens model constrains their physical sizes to be pc. Neglecting closely bound multiple stars for the time being, member stars within the group should have mutual separations on the order of parsecs, which is much greater than the source-plane correlation lengths – of microlensing magnifications as shown in Fig. 5.
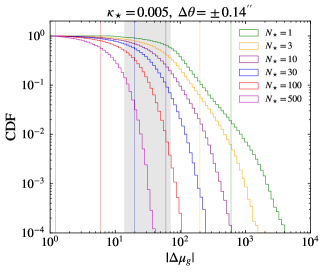
This implies that at any given time individual luminous stars have statistically independent microlensing magnifications. Under this assumption, we show in Fig. 7 the probability distribution of for a star group, where is the (microlensing affected) magnification averaged over stars for one (unresolved) macro image of the star group on one side of the macro critical curve. As increases, the distribution of approaches a Gaussian centered at zero with decreasing width. For simplicity, we assume that all stars are identical. A small number is disfavored for the same reason as in the previous subsection (typical values of are insufficient to explain the flux asymmetries). The minimum to account for the flux asymmetries is reduced as . We find that a value – is most consistent with the level of macro image asymmetry seen in Fig. 3. This number yields a typical magnification difference induced by uncorrelated microlensing of – of , shown as the shaded vertical band in Fig. 7. A number – of stars of comparable brightness might still produce a ratio compatible with Fig. 7, but each star should then be fainter in order not to overproduce the observed flux of either macro image. For , would be highly diluted and a flux asymmetry as large as – would be implausible. For a more accurate analysis, one could replace the simplifying assumption of identical source stars with a model of a continuous luminosity function. We leave such analysis for future investigation.
If ultra-luminous stars form a system more compact than AU, their microlensing magnifications will be highly correlated. They may simultaneously have a magnification asymmetry . For –, the value for would be typical of the distribution shown in Fig. 6. The lower required magnification may then be more likely to occur, but the tight star clusters required may not be abundant enough to explain the multiple observed asymmetric image pairs.
To summarize, by measuring unequal image pairs at just one random epoch per HST filter, we conclude that while the hypothesis of microlensing of a single ultra-luminous source star is hardly viable, the asymmetries might be explained by a group of stars, under one of the following three situations: uniform microlensing of – extremely luminous BSGs tightly bound within AU, or uncorrelated microlensing of a group of – such BSGs within a region of size , or uncorrelated microlensing of a cluster of – less luminous stars (most likely B-type giants) within a region of size . As we will see next, frequent temporal variability of the flux asymmetry is generally expected from these microlensing scenarios.
6.3 Temporal variability of flux asymmetry
The flux asymmetry between the two macro images induced by microlensing is expected to vary with time as each source star slowly traverses the microlensing magnification pattern on the source plane (as in Fig. 5). As a result, the asymmetry can frequently change its sign.
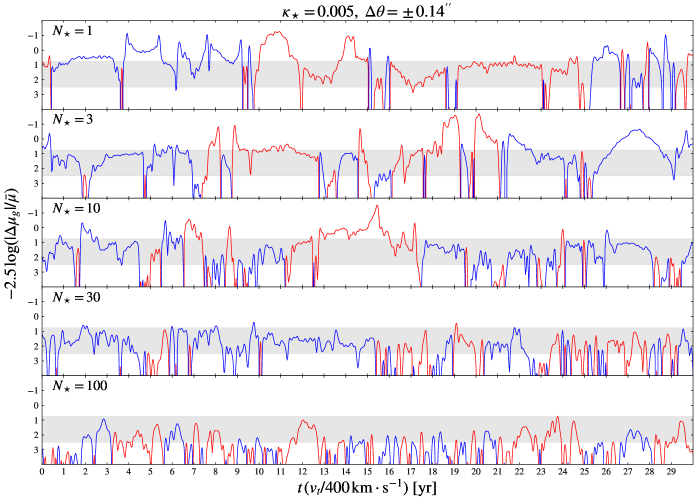
As the star number of a group increases, the overall flux asymmetry should vary more rapidly because the flux asymmetry from each member star varies independently and there are more frequent micro caustic crossings, but the fractional size of the asymmetry is more diluted. This is clearly reflected in Fig. 8, where we show numerical examples of flux asymmetry variation from randomly drawn microlens realizations, up to the uncertainty in the timescale that scales inversely with the unknown effective transverse velocity parameter .
Since the arc has not been imaged at more than one epoch in any single filter, we cannot rule out temporal variation in the flux asymmetries with complete certainty. Still, the asymmetries in Slit D seen in F606W and F814W are very similar to those seen in F110W and F160W, if not identical, even though the two optical filters and the two IR filters were used at two different epochs separated by more than 6 years. This seems to hint that in Slit D the observed flux asymmetry is persistent, or the variable component is relatively small.
Assuming a fiducial velocity , up to a factor of few uncertainty unless fine-tuned, the apparent non-variability over yr can be compatible with –, but we have seen that such few number of dominant bright stars are probably incompatible with the large size of the asymmetries in absolute flux units. On the other hand, Fig. 8 suggests that would lead to changes in the sign and magnitude of that occur too frequently over the yr timescale, unless the relative transverse velocity is surprisingly low, . Extremely tight systems of – supergiant stars with nearly uniform microlensing might still explain some of the asymmetries, but taking into account all previous considerations, we believe the observed persistent flux asymmetry in Slit D is not in good agreement with microlensing models of either a single or an under-resolved group of source stars. Ultimately, imaging in the same filters at additional epochs is necessary to robustly establish or falsify microlensing variability over a timescale of years.
7 Substructure lensing
In Sec. 6, we have studied flux asymmetries from intracluster microlensing operating on minuscule angular scales far beyond telescope resolution. In this Section, we consider substructure lensing from either small galaxies or star-free DM subhalos inside the cluster halo, which also cause flux asymmetries as we show below. The characteristic lensing angular scales of to are marginally resolved in diffraction limited exposures. Unlike microlensing, asymmetric patterns resultant from substructure lensing do not exhibit noticeable variability over timescales of decades to centuries.
7.1 Galaxy perturbers
The smooth lens model inevitably deviates from the idealized fold model (Schneider et al., 1992) away from the macro critical curve. Large perturber lenses far away in projection can induce curvature in the macro critical curve on arc second scales. Indeed, the right panel of Fig. 1 shows that our smooth lens model predicts such an example of curvature due to a minor foreground galaxy to the northwest. However, these large and distant perturbers are usually unable to generate magnification asymmetries larger than between image pairs with small separation .
Consider an image of a point source on one side of the critical curve, with magnification , and its counter image with magnification . Define the signed fractional magnification asymmetry
| (4) |
Let be the mass of a faraway perturber, its Einstein angular scale, and the angular impact parameter from the image pair. We estimate that is of the order (derived in App. C)
| (5) |
where we assume and that the perturber is at the cluster redshift . The perturber galaxy would therefore have to enclose a mass within to produce tens of percent asymmetry. In fact, a blue compact source, probably a young star cluster associated with the arc at , is lensed by this foreground galaxy into multiple images separated by a critical curve loop of size . Taking into account that a macro magnification should be acting to enhance the effect of the perturber, we find the small size of the critical curve loop inconsistent with the central part of the foreground galaxy (where star light is detected) enclosing .
In Fig. 9, we further confirm that the galaxy perturber alone could not have caused the magnification asymmetry. For every image point, we locate the counter image point and calculate as defined in Eq. (4). In our smooth lens model, only reaches a few percent within of the critical curve, which is compatible with our order of magnitude estimate in Eq. (7.1).
7.2 Dark matter subhalos
While no evidence supports that any minor foreground galaxy significantly breaks the symmetry near the cluster critical curve, we hypothesize that a population of abundant and non-luminous DM subhalos may be the reason. Unlike the larger but rarer perturbers, sub-galactic subhalos are predicted to be numerous enough to be frequently found close to the critical curves, where their perturbing effects are greatly enhanced (Minor et al., 2017; Dai et al., 2018).
To numerically assess the effect of subhalos expected from the standard Cold Dark Matter (CDM) theory, we populate the cluster DM halo with randomly generated subhalos, which are superimposed on top of an ideal fold model with parameters appropriate for the arc S1226. We follow the method outlined in Dai et al. (2018) using an extrapolation of the semi-analytic model of Han et al. (2016) down to subhalo-host mass ratios as small as . For simplicity, we model the host DM halo of SDSS J1226+2152 using a spherical Navarro-Frenk-White (NFW) profile (Navarro et al., 1996, 1997), with a characteristic mass and a concentration parameter . These broadly reproduce a measured Einstein radius (Oguri et al., 2012), a local convergence at the line of sight as inferred from our macro lens model, as well as an empirical mass-concentration relation found for a catalog of strong and weak lensing SGAS clusters (Bayliss et al., 2011; Oguri et al., 2012). The host DM halo has an NFW scale radius . Subhalos are assumed to follow a power-law mass function (Mo et al., 2010), and are approximated as spherical but tidally truncated NFW profiles (Baltz et al., 2009; Cyr-Racine et al., 2016). We refer interested readers to Appendix B of Dai et al. (2018) for technical details.
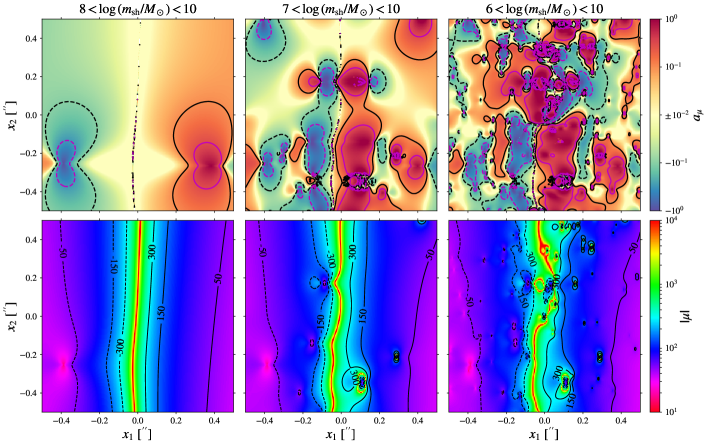
Similarly to Fig. 9, we calculate the magnification asymmetry between a pair of images by ray shooting: for every chosen image position, we first find the corresponding source position, and then locate the counter images. When more than one counter image is present, we pick the brightest counter image and evaluate according to Eq. (4).
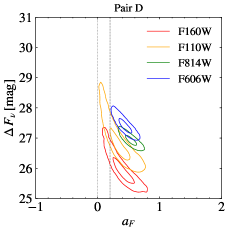
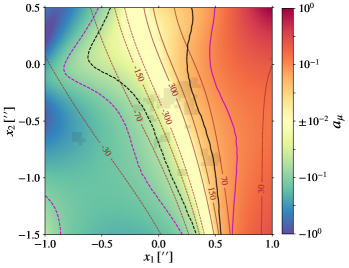
In Fig. 10, we show the pattern of influenced by one random realization of subhalos for a compact source, within a vicinity of the cluster critical curve. The pattern of signed magnification is also shown. The influence of a subhalo much more massive than lying on top of the lensed arc should be large enough to be noticeable. But the expected number density of such massive subhalos is low enough that having any one of them within of the cluster critical curve is improbable. We generate smaller subhalos with . The model of Han et al. (2016) we adopt here predicts about one subhalo with within a disk of radius centered on the cluster critical curve. On the other hand, typically many subhalos with are present just a fraction of an arcsecond away from the cluster critical curve. Unable to host star formation, these halos cannot be observed except for gravitational probes sensitive to small scale structures, like the lensing perturbations causing asymmetries in highly magnified image pairs.
As shown in Fig. 10, even one subhalo can induce substantial magnification asymmetry if it is sufficiently close to one of the image pair. A subhalo of mass located from the cluster critical curve can cause within – from its center. At from the cluster critical curve, small subhalos with appear common enough to produce across a significant portion of the image plane. Even smaller subhalos should be more numerous and may contribute to sizable very close to the critical curve. Our simulation of tiny subhalos is limited by computational cost. Their effects may be important for extremely compact sources such as individual bright stars, but are likely to dilute away for sources of size larger than pc.
The precise distribution of magnification asymmetry naturally fluctuates among realizations of subhalos, and mildly depends on host halo structural parameters and . The typical magnification asymmetry scales with the normalization of the subhalo mass function. Despite these uncertainties, it seems plausible from our simulations that a population of DM subhalos in the mass range – induces ubiquitous asymmetry at the level for pairs of highly magnified images within from the cluster critical curve. Subhalos in this mass range are also capable of imprinting astrometric effects detectable with future imaging efforts (Dai et al., 2018). It is therefore theoretically possible that the flux asymmetries in S1226, such as those in Slits C, D and E, are entirely or partially caused by subhalo lensing. Regarding the ambiguous identification of any image pair in Slit A, for example, we surmise that it could be due to a subhalo creating additional lensed images of the same source.
7.3 Satellite galaxies and globular clusters
If sub-galactic perturber lenses are in fact responsible for the observed image pair asymmetries, could DM subhalos be confused by dwarf galaxies in the cluster or along the line of sight, globular clusters or other known stellar systems that are too faint to be detected by HST? Such star clusters or dwarf galaxies would have to be much smaller than, e.g., the minor perturber galaxy to the north of S1226 so as not to induce obvious deformation of the arc, and they would have to be numerous enough to be found near the critical curve with reasonable likelihood. Our ICL estimate at the location of the arc implies that the FoV in Fig. 10 on average only encloses of stars, leaving little mass budget to have many stellar mass clumps comparable to the DM subhalos we consider. It is also well known that the general dwarf galaxy luminosity function is much less steep at the faint end than the predicted CDM subhalo mass function at the low-mass end, so dwarf galaxy abundances should be much smaller than required for producing the perturbations illustrated in Fig. 10.
Globular clusters (GCs) populate the intracluster medium due to tidal stripping from their host galaxies (White, 1987; West et al., 1995). In recent years, intracluster GCs have been studied in several galaxy clusters up to (Lee et al., 2010; Peng et al., 2011; West et al., 2011; Alamo-Martínez et al., 2013; D’Abrusco et al., 2016; Lee & Jang, 2016). In the core of rich clusters, the GC surface number density is found to be around (Lee et al., 2010; Alamo-Martínez et al., 2013; D’Abrusco et al., 2016; Lee & Jang, 2016), which would correspond to no more than a few GCs within the same FoV in Fig. 10. Even in the extreme case of the core of the Coma Cluster, for which a GC surface density of was reported by Peng et al. (2011), this number would be , an order of magnitude smaller than DM subhalos with . Furthermore, these GCs have masses – (probably without any significant DM), smaller than those of the DM subhalos we have considered. Hence, interloper GCs are also not abundant enough to be the major cause of the observed image asymmetries.
Satellite galaxies are thought to reside in DM halos. Therefore, satellites should be no more numerous than the DM subhalos that match their host DM halo size, which are already included in the DM subhalo population model we adopt. DM subhalos small enough to be common within the FoV of Fig. 10 probably lack any significant stellar component. In the cores of nearby rich galaxy clusters, an extrapolation of the observed satellite luminosity function to the luminosity of GCs (Bernstein et al., 1995; Mobasher et al., 2003; Ferrarese et al., 2016) still falls short of the DM subhalo number density seen in Fig. 10 by more than two orders of magnitude. Averaging over the entire cluster, we suggest that intracluster satellite galaxies and GCs are less abundant than DM subhalos to ubiquitously perturb the proximity of the smooth critical curve and induce magnification asymmetries. In the case of S1226, this abundance may be enhanced by satellite galaxies and GCs bound to nearby cluster member galaxies in projection. Deep imaging of the nearby ICL with JWST will set stringent limits on the abundance of faint satellites. Spectroscopic analysis will help rule out foreground stellar systems superimposed on top of the arc.
8 Conclusions
We have investigated HST data showing asymmetric surface brightness features within from the lensing critical curve in a magnified arc behind the galaxy cluster SDSS J1226+2152. We have identified highly magnified image pairs of compact star-forming regions, many of which are inconsistent with being perfectly symmetric. Careful measurement of the brightest of these image pairs robustly constrains the flux ratio to be in two optical filters, and indicates a most probable flux ratio as large as – in all four HST filters.
Intracluster microlensing inevitably introduces uncorrelated magnification fluctuations in different images of the same source, causing unequal fluxes at any given epoch. Due to the high source redshift , we have found that the sources of several asymmetric image pairs are too luminous to be just one or a few supergiants even if each star is as bright as , but are more likely to be clusters of more than bright stars. Our modeling suggests that having – comparably luminous stars shortens the timescale of asymmetry variability to just or yrs. In this case, the asymmetry should even flip its sign several times over six years. This appears, in the case of the brightest image pair, at odds with the consistent sign and degree of asymmetry between optical and IR exposures taken six years apart. For a cluster of comparable stars, microlensing induced asymmetry should be severely diluted, while variability should occur even more rapidly. Since HST images in 2011 and in 2017 were not taken in the same filters, we have not been able to derive a tight constraint on variability, and in fact, variability at some level, however small, is unavoidable. An additional HST epoch in both UV and IR filters would tighten the constraint on any asymmetry component of microlensing origin, giving helpful guidance to upcoming JWST observations.
A population of – intervening DM subhalos perturbing the magnification symmetry in the proximity of the critical curve is the other viable hypothesis we have considered, for which persistent asymmetries are natural outcomes. Using a reasonable model for subhalo abundance and mass function derived for the CDM paradigm, we have found it plausible that image pairs having more than a fractional difference in magnifications are common within of the cluster critical curve in the case of S1226.
Precise characterization of the cluster halo of SDSS J1226+2152 and improved substructure modeling will enable us to draw a more robust conclusion on whether asymmetric image pairs neighboring the critical curve in S1226 are caused by substructure lensing. Deeper images taken at many epochs with HST and JWST will help reduce the uncertainty in the flux asymmetry measurement, separate any time-varying component from the persistent component, and rule out possible interloper satellite galaxies or GCs. In particular, in IR filters JWST will have good spatial resolution on par with HST in optical filters.
Nebular lines from HII regions surrounding hot stars, if spatially compact enough, might provide additional evidence for asymmetries insensitive to microlensing thanks to large source sizes. More generally, we expect an increased number of caustic straddling arcs with clumpy star-forming features in the proximity of lensing critical curves to be discovered in the future. Imaging and spectroscopy follow-ups of the source-lens systems will allow us to examine many such magnified image pairs and establish whether asymmetric magnifications are ubiquitous.
Detecting the population of small-scale subhalos through lensing near caustics will be unprecedented and will complement other efforts to uncover the invisible DM structure on sub-galactic scales, including flux ratio measurements of multiply imaged quasars (Nierenberg et al., 2014; Nierenberg et al., 2017; Gilman et al., 2019) and dynamic modeling of Milky Way stellar streams (Johnston et al., 2002; Ibata et al., 2002; Carlberg, 2009; Banik et al., 2019; Bonaca et al., 2019). Thereby, improved constraints will be derived for alternative DM models such as Warm Dark Matter (Kusenko, 2009; Shoemaker & Kusenko, 2009; Abazajian, 2017) or “fuzzy” DM (Press et al., 1990; Sin, 1994; Goodman, 2000; Peebles, 2000; Hu et al., 2000; Amendola & Barbieri, 2006; Schive et al., 2014; Hui et al., 2017).
Acknowledgements
The authors are grateful to the anonymous referee for important comments that led to substantial improvement of this work. The authors are also thankful for insightful discussions with Eliot Quataert and Kailash Sahu. This work is based on observations made with the NASA/ESA Hubble Space Telescope, obtained from the data archive at the Space Telescope Science Institute. STScI is operated by the Association of Universities for Research in Astronomy, Inc. under NASA contract NAS 5-26555. LD and TV acknowledge the support of John Bahcall Fellowships at the Institute for Advanced Study. AK is supported by the IBM Einstein fellowship. JM has been supported by Spanish Fellowship PRX18/00444, and by the Corning Glass Works Foundation Fellowship Fund. MB acknowledges support by NASA through grant number HST-GO-15378.006-A from the Space Telescope Science Institute, which is operated by AURA, Inc., under NASA contract NAS 5-26555. We acknowledge the use of the publicly available Python package Colossus to carry out cosmological calculations (Diemer, 2018).
Appendix A Non-rigid registration
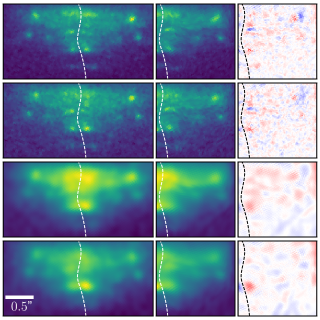
The method of non-rigid registration allows to smoothly deform one surface brightness pattern to match another. In Kaurov et al. (2019), this method was applied to the arc in MACS J0416.1-2403. In that case, asymmetries were marginally observed in several slits using deeper co-added HST exposures. Thus, in that case non-rigid registration relied on matching arc surface brightness features seen on both sides of the critical curve to account for imperfections of the ideal fold lens model. The main finding from this method in Kaurov et al. (2019) was that asymmetries appear more prominent as one examines the portion of the image plane closer to the critical curve, a trend broadly expected from both intracluster microlensing and DM substructure lensing. For S1226, asymmetries are significant in many of the slits we define in Sec. 3.1. Thus, the method of non-rigid registration is naively less reliable. However, we apply it here to see what we can recover.
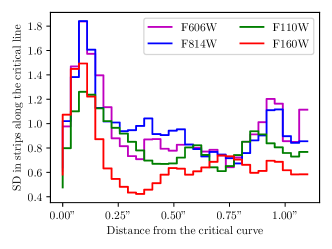
The resulting non-rigid transformation is presented in Fig. 11, where we plot the speculated morphology of the (perhaps perturbed) critical curve as the white dashed curve. The figure highlights many inconsistencies along the critical line, which is in line with what we have found in Sec. 3.1. In Fig. 12, we show the average amplitude of match residuals as a function of distance to the critical curve, similar to what was done in Kaurov et al. (2019). While some surface brightness mismatches are mitigated or eliminated by the non-rigid transformation, others cannot be perfectly cured, especially at smaller distances to the critical curve.
Appendix B Measuring fluxes of lensed image pairs
For our analysis, we use reduced science product images drizzled to a uniform pixel scale of , one image per filter. The pixel resolution improves upon those of individual exposures, namely a detector pixel scale for ACS (F606W and F814W) and for WFC3 IR (F110W and F160W).
We use the publicly available software package TinyTim (Krist et al., 2011). To allow sub-pixel centroiding, we need subsampled PSFs output by TinyTim, which neglect the charge diffusion effect (Krist, 2004). Only precisely applicable to individual exposures, those neither include further PSF broadening in drizzled images (Hook & Fruchter, 2000). Using stars in the FoV for calibration, we empirically find that convolving TinyTim PSFs with a two-dimensional isotropic gaussian kernel whose sigma equals pixel scale on the detector provides good fits, with bias in photometry and error in astrometry.
In each filter and for each of the significant asymmetric features in Slits C, D and E, we explore the in Eq. (1) within a cutout of suitable size which contains the presumptive lensed image pair. We centroid each lensed image within a search region in (RA, DEC) centering at the pixel of peak flux. Some of the relevant parameters adopted in our analysis can be found in Tab. 4.
We adopt simple and reasonable parametrized models for the diffuse background based on the surface brightness properties within each cutout. For the image pairs in Slits C and E, we adopt the gradient model which is simply a two-dimensional linear function with 3 coefficients:
| (6) |
This form captures any smooth ICL and sky backgrounds.
The brighter image pair in Slit D happen to be located at a boundary separating two distinct sections of the arc with high and low surface brightness, respectively. The arc is bright enough that ICL and sky backgrounds are unimportant. Near the lensing critical curve, this boundary is physically constrained to be parallel to the direction of arc elongation. We therefore introduce the smooth step model for the diffuse background, which is the sum of a uniform component and a one-dimensional profile describing a smooth transition in the surface brightness:
| (7) |
The smooth step model has a total of 5 parameters, which include two constants and , and 3 other parameters characterizing the orientation, position, and width of the surface brightness transition respectively.
For the inverse variance weights ’s in Eq. (1), we adopt the white noise approximation by setting all ’s to be a constant , which models fit residuals due to both flux measurement errors and uncertainties in the intrinsic surface brightness inhomogeneities on the arc. Its value is tuned such that for the maximum likelihood solution the per effective degree of freedom is around unity. In the two optical filters F606w and F814W, the total number of effective degrees of freedom is taken to be the total number of cutout pixels minus the total number of fitting parameters . The drizzled /pixel images for F110W and F160W are oversampled, which causes residuals to show correlation across many pixels (see bottom rightmost panel of Fig. 13). We estimate a factor of 4 for oversampling in resolution, and hence reduce the effective number of pixels by a factor of 16 in those two filters.
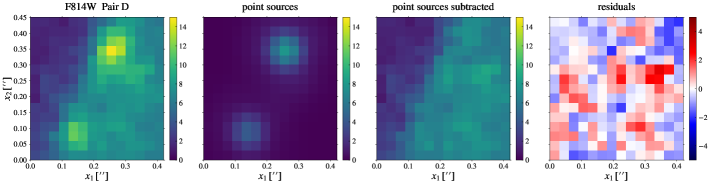
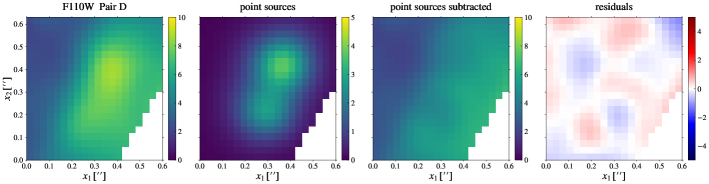
As an example, in Fig. 13 we show results of our aforementioned fitting procedure for the most prominent asymmetric image pair feature in Slit D, in one optical filter F814W and one IR filter F110W. The fitting residuals for F814W show only moderate departure from white noise, mainly due to the presence of secondary underlying compact sources on the arc. We do not expect the white noise approximation leads to significant mis-estimation of the errorbars. The fitting residuals for F110W clearly exhibit correlation as expected from oversampling, justifying the reduction in the effective number of pixels used to tune .
For a cross check, we re-perform the analysis using HST images of individual visits (two visits each for F606W and F814W with /pixel; one visit each for F110W and F160W with /pixel) produced by the standard reduction pipeline and downloadable from the Mikulsky Archive for Space Telescopes (https://mast.stsci.edu/portal/Mashup/Clients/Mast/Portal.html), properly treating astrometric misalignment between images taken from different visits. The results obtained are in good agreement with what we conclude with our own drizzled images.
| image pair | HST filter | diffuse background model | ||||
| Slit C | ||||||
| F606W | 195 | 2 | gradient | 9 | 0.60 | |
| F814W | 188 | 2 | gradient | 9 | 0.80 | |
| F110W | 264 | 2 | gradient | 9 | 1.20 | |
| F160W | 264 | 2 | gradient | 9 | 1.70 | |
| Slit D | ||||||
| F606W | 210 | 2 | smooth step | 11 | 0.50 | |
| F814W | 210 | 2 | smooth step | 11 | 0.65 | |
| F110W | 383 | 2 | smooth step | 11 | 1.00 | |
| F160W | 383 | 2 | smooth step | 11 | 1.60 | |
| Slit E | ||||||
| F606W | 339 | 2 | gradient | 9 | 0.40 | |
| F814W | 253 | 2 | gradient | 9 | 0.54 | |
| F110W | 406 | 2 | gradient | 9 | 0.60 | |
| F160W | 406 | 2 | gradient | 9 | 1.50 |
Appendix C Magnification asymmetry across critical curve
In this Appendix, we estimate the degree of uneven fluxes between a close pair of highly magnified images on both sides of the critical curve. We aim to derive the parametric dependence on the perturber parameters.
Consider a pair of images at image plane positions and . Demanding that they map to the same source point, we obtain from the lens equation
| (8) |
where is the deflection field as a function of the two-dimensional image plane vector . Let us write and , where is the midpoint between the image pair.
Assuming that is smooth, we Taylor expand in powers of :
| (9) |
where denotes image-plane derivative with respect to , and stands for evaluation at . Ignoring terms at cubic and higher orders, the Jacobian matrix at satisfies . This means that is an eigenvector with a vanishing eigenvalue.
The inverse of the signed magnification is
| (10) |
where we again Taylor expand around :
| (11) | ||||
In a suitably oriented coordinate system, aligns with the first axis, and the only nonzero element of is the 22 element being order unity.
If we neglect terms of in Eq. (11), the determinant is at the leading order proportional to the term in the 11 element of the full Jacobian matrix. Since this term has equal magnitudes but opposite signs at both image positions and , we recover the familiar result that a pair of images across an ideal fold are equally magnified.
Departure from perfect magnification symmetry is induced by two types of correction in Eq. (11): (i) the term in the 11 element; (ii) the product of terms from two matrix elements. Having the same signs at and at , these correct the leading magnification factor in opposite directions at the two images and hence generate asymmetry.
The lowest order derivative of the deflection field is usually determined by the large-scale lens, while the higher order derivatives can be dominated by small perturber lenses. By definition, is on the order of the image separation . Neglecting numerical prefactors, we assume is of order from the large-scale mass distribution. We assume that a perturber lens dominates the derivative at the next order,
| (12) |
as long as the angular impact parameter is larger than the characteristic Einstein radius of the perturber. We also require so that Taylor expansion in is justified. Fractional correction to magnification from terms of type (i) is therefore
| (13) |
The fractional correction to magnification from terms of type (ii) is of order , independent of the perturber. This is comparable to the inverse of the leading order magnification factor. For image pairs of interest in this work, the magnification factor is as large as . Hence, these terms only induce insignificant fractional magnification asymmetry at (sub-)percent levels.
References
- Abazajian (2017) Abazajian K. N., 2017, Physics Reports, 711, 1
- Alamo-Martínez et al. (2013) Alamo-Martínez K. A., et al., 2013, Astrophys. J., 775, 20
- Amendola & Barbieri (2006) Amendola L., Barbieri R., 2006, Physics Letters B, 642, 192
- Arvanitaki et al. (2019) Arvanitaki A., Dimopoulos S., Galanis M., Lehner L., Thompson J. O., Van Tilburg K., 2019
- Baltz et al. (2009) Baltz E. A., Marshall P., Oguri M., 2009, Journal of Cosmology and Astroparticle Physics, 2009, 015
- Banik et al. (2019) Banik N., Bovy J., Bertone G., Erkal D., de Boer T. J. L., 2019, arXiv e-prints, p. arXiv:1911.02663
- Bayliss et al. (2011) Bayliss M. B., Hennawi J. F., Gladders M. D., Koester B. P., Sharon K., Dahle H., Oguri M., 2011, The Astrophysical Journal Supplement Series, 193, 8
- Bayliss et al. (2014) Bayliss M. B., Johnson T., Gladders M. D., Sharon K., Oguri M., 2014, ApJ, 783, 41
- Bernstein et al. (1995) Bernstein G. M., Nichol R. C., Tyson J. A., Ulmer M. P., Wittman D., 1995, AJ, 110, 1507
- Blandford & Narayan (1986) Blandford R., Narayan R., 1986, The Astrophysical Journal, 310, 568
- Blinov et al. (2019) Blinov N., Dolan M. J., Draper P. I., 2019
- Bonaca et al. (2019) Bonaca A., Hogg D. W., Price-Whelan A. M., Conroy C., 2019, ApJ, 880, 38
- Buchner et al. (2014) Buchner J., et al., 2014, Astron. Astrophys., 564, A125
- Carlberg (2009) Carlberg R., 2009, The Astrophysical Journal Letters, 705, L223
- Chen et al. (2019) Chen W., et al., 2019, ApJ, 881, 8
- Chisholm et al. (2019) Chisholm J., Rigby J. R., Bayliss M., Berg D. A., Dahle H., Gladders M., Sharon K., 2019, ApJ, 882, 182
- Conroy & Gunn (2010) Conroy C., Gunn J. E., 2010, The Astrophysical Journal, 712, 833
- Conroy et al. (2009) Conroy C., Gunn J. E., White M., 2009, The Astrophysical Journal, 699, 486
- Cyr-Racine et al. (2016) Cyr-Racine F.-Y., Moustakas L. A., Keeton C. R., Sigurdson K., Gilman D. A., 2016, Physical Review D, 94, 043505
- D’Abrusco et al. (2016) D’Abrusco R., et al., 2016, The Astrophysical Journal Letters, 819, L31
- Dai & Miralda-Escudé (2019) Dai L., Miralda-Escudé J., 2019, arXiv e-prints, p. arXiv:1908.01773
- Dai et al. (2018) Dai L., Venumadhav T., Kaurov A. A., Miralda-Escud J., 2018, ApJ, 867, 24
- Davis et al. (1985) Davis M., Efstathiou G., Frenk C. S., White S. D. M., 1985, ApJ, 292, 371
- Diego (2019) Diego J. M., 2019, Astron. Astrophys., 625, A84
- Diego et al. (2018) Diego J. M., et al., 2018, ApJ, 857, 25
- Diemer (2018) Diemer B., 2018, The Astrophysical Journal Supplement Series, 239, 35
- Ferrarese et al. (2016) Ferrarese L., et al., 2016, ApJ, 824, 10
- Fiacconi et al. (2016) Fiacconi D., Madau P., Potter D., Stadel J., 2016, ApJ, 824, 144
- Gilman et al. (2019) Gilman D., Birrer S., Treu T., Nierenberg A., Benson A., 2019, MNRAS, 487, 5721
- Goodman (2000) Goodman J., 2000, New Astronomy, 5, 103
- Han et al. (2016) Han J., Cole S., Frenk C. S., Jing Y., 2016, Monthly Notices of the Royal Astronomical Society, 457, 1208
- Hennawi et al. (2008) Hennawi J. F., et al., 2008, AJ, 135, 664
- Hook & Fruchter (2000) Hook R., Fruchter A., 2000, in Astronomical Data Analysis Software and Systems IX. p. 521
- Hu et al. (2000) Hu W., Barkana R., Gruzinov A., 2000, Physical Review Letters, 85, 1158
- Hui et al. (2017) Hui L., Ostriker J. P., Tremaine S., Witten E., 2017, Physical Review D, 95, 043541
- Ibata et al. (2002) Ibata R., Lewis G., Irwin M., Cambrésy L., 2002, Monthly Notices of the Royal Astronomical Society, 332, 921
- Johnston et al. (2002) Johnston K. V., Spergel D. N., Haydn C., 2002, The Astrophysical Journal, 570, 656
- Jullo et al. (2007) Jullo E., Kneib J.-P., Limousin M., Elíasdóttir Á., Marshall P. J., Verdugo T., 2007, New Journal of Physics, 9, 447
- Kaurov et al. (2019) Kaurov A. A., Dai L., Venumadhav T., Miralda-Escudé J., Frye B., 2019, ApJ, 880, 58
- Kelly et al. (2018) Kelly P. L., et al., 2018, Nature Astronomy, 2, 334
- Kelly et al. (2019) Kelly P., et al., 2019, HST Proposal
- Koester et al. (2010b) Koester B. P., Gladders M. D., Hennawi J. F., Sharon K., Wuyts E., Rigby J. R., Bayliss M. B., Dahle H., 2010b, ApJ, 723, L73
- Koester et al. (2010a) Koester B. P., Gladders M. D., Hennawi J. F., Sharon K., Wuyts E., Rigby J., Bayliss M. B., Dahle H., 2010a, The Astrophysical Journal Letters, 723, L73
- Krist (2004) Krist J. E., 2004, in Optical and Infrared Detectors for Astronomy. pp 328–335
- Krist et al. (2011) Krist J. E., Hook R. N., Stoehr F., 2011, in Optical Modeling and Performance Predictions V. p. 81270J
- Kroupa (2001) Kroupa P., 2001, Monthly Notices of the Royal Astronomical Society, 322, 231
- Kusenko (2009) Kusenko A., 2009, Physics Reports, 481, 1
- Lee & Jang (2016) Lee M. G., Jang I. S., 2016, The Astrophysical Journal, 831, 108
- Lee et al. (2010) Lee M. G., Park H. S., Hwang H. S., 2010, Science, 328, 334
- Lin & Mohr (2004) Lin Y.-T., Mohr J. J., 2004, The Astrophysical Journal, 617, 879
- Mao & Schneider (1998) Mao S., Schneider P., 1998, MNRAS, 295, 587
- Metcalf & Madau (2001) Metcalf R. B., Madau P., 2001, ApJ, 563, 9
- Minor et al. (2017) Minor Q. E., Kaplinghat M., Li N., 2017, ApJ, 845, 118
- Miralda-Escudé (1991) Miralda-Escudé J., 1991, ApJ, 379, 94
- Mo et al. (2010) Mo H., Van den Bosch F., White S., 2010, Galaxy formation and evolution. Cambridge University Press
- Mobasher et al. (2003) Mobasher B., et al., 2003, The Astrophysical Journal, 587, 605
- Montes & Trujillo (2018) Montes M., Trujillo I., 2018, Mon. Not. Roy. Astron. Soc., 474, 917
- Moore et al. (1999) Moore B., Ghigna S., Governato F., Lake G., Quinn T., Stadel J., Tozzi P., 1999, The Astrophysical Journal Letters, 524, L19
- Navarro et al. (1996) Navarro J. F., Frenk C. S., White S. D. M., 1996, ApJ, 462, 563
- Navarro et al. (1997) Navarro J. F., Frenk C. S., White S. D., 1997, The Astrophysical Journal, 490, 493
- Nierenberg et al. (2014) Nierenberg A., Treu T., Wright S., Fassnacht C., Auger M., 2014, Monthly Notices of the Royal Astronomical Society, 442, 2434
- Nierenberg et al. (2017) Nierenberg A., et al., 2017, Monthly Notices of the Royal Astronomical Society, 471, 2224
- Oguri et al. (2012) Oguri M., Bayliss M. B., Dahle H., Sharon K., Gladders M. D., Natarajan P., Hennawi J. F., Koester B. P., 2012, MNRAS, 420, 3213
- Oguri et al. (2018a) Oguri M., Diego J. M., Kaiser N., Kelly P. L., Broadhurst T., 2018a, Phys. Rev. D, 97, 023518
- Oguri et al. (2018b) Oguri M., Diego J. M., Kaiser N., Kelly P. L., Broadhurst T., 2018b, Phys. Rev., D97, 023518
- Peebles (2000) Peebles P. J. E., 2000, Astrophys. J., 534, L127
- Peng et al. (2011) Peng E. W., et al., 2011, The Astrophysical Journal, 730, 23
- Press & Schechter (1974) Press W. H., Schechter P., 1974, The Astrophysical Journal, 187, 425
- Press et al. (1990) Press W. H., Ryden B. S., Spergel D. N., 1990, Physical review letters, 64, 1084
- Rigby et al. (2017) Rigby J., et al., 2017, JWST Proposal ID 1355. Cycle 0 Early Release Science
- Rigby et al. (2018) Rigby J., et al., 2018, The Astronomical Journal, 155, 104
- Rodney et al. (2018) Rodney S. A., et al., 2018, Nature Astronomy, 2, 324
- Schive et al. (2014) Schive H.-Y., Chiueh T., Broadhurst T., 2014, Nature Physics, 10, 496
- Schneider et al. (1992) Schneider P., Ehlers J., Falco E. E., 1992, Gravitational Lenses, doi:10.1007/978-3-662-03758-4.
- Sharon et al. (2019) Sharon K., et al., 2019, arXiv e-prints, p. arXiv:1904.05940
- Shoemaker & Kusenko (2009) Shoemaker I. M., Kusenko A., 2009, Physical Review D, 80, 075021
- Sin (1994) Sin S.-J., 1994, Phys. Rev. D, 50, 3650
- Springel et al. (2008) Springel V., et al., 2008, MNRAS, 391, 1685
- Venumadhav et al. (2017) Venumadhav T., Dai L., Miralda-Escudé J., 2017, ApJ, 850, 49
- West et al. (1995) West M. J., Côté P., Jones C., Forman W., Marzke R. O., 1995, The Astrophysical Journal Letters, 453, L77
- West et al. (2011) West M. J., Jordán A., Blakeslee J. P., Côté P., Gregg M. D., Takamiya M., Marzke R. O., 2011, Astronomy & Astrophysics, 528, A115
- White (1987) White R. E., 1987, Monthly Notices of the Royal Astronomical Society, 227, 185
- White & Rees (1978) White S. D., Rees M. J., 1978, Monthly Notices of the Royal Astronomical Society, 183, 341
- Windhorst et al. (2018) Windhorst R. A., et al., 2018, The Astrophysical Journal Supplement Series, 234, 41
- Zibetti et al. (2005) Zibetti S., White S. D., Schneider D. P., Brinkmann J., 2005, Monthly Notices of the Royal Astronomical Society, 358, 949
- Zwicky (1951) Zwicky F., 1951, Publications of the Astronomical Society of the Pacific, 63, 61