Magnetic entropy change of ErAl2 magnetocaloric wires fabricated by a powder-in-tube method
Abstract
We report the fabrication of ErAl2 magnetocaloric wires by a powder-in-tube method (PIT) and the evaluation of magnetic entropy change through magnetization measurements. The magnetic entropy change of ErAl2 PIT wires exhibits similar behavior to the bulk counterpart, while its magnitude is reduced by the decrease in the volume fraction of ErAl2 due to the surrounding non-magnetic sheaths. We find that another effect reduces the magnetic entropy change of the ErAl2 PIT wires around the Curie temperature, and discuss its possible origin in terms of a correlation between magnetic properties of ErAl2 and mechanical properties of sheath material.
Keywords: magnetic refrigeration, hydrogen liquefaction, intermetallic compounds, powder-in-tube method
1 Introduction
Magnetic refrigeration is a cooling technology based on the magnetocaloric effect in which the variation in magnetic entropy (or temperature) of a magnetic material is caused by changing a magnetic field. A well-established applied technique is a cooling by adiabatic demagnetization to achieve ultra-low temperatures below 1 K[1, 2]. Since 1997, the application to room temperature refrigerators has been enthusiastically studied because magnetic refrigeration has the potential to outperform the conventional vapor-compression refrigeration concerning energy efficiency and environmental friendliness[3, 4]. Many great efforts have been made up to date on the development of working materials with a large magnetocaloric effect near room temperature [5, 6, 7] (e.g., Gd5Si2Ge2 discovered by Pecharsky and Gschneidner[8]) and efficient refrigeration systems such as an active magnetic regenerator (AMR) [9, 10, 11].
A newly attracting potential application of magnetic refrigeration is the hydrogen liquefaction. Hydrogen is one of the cleanest energy sources to replace fossil fuels[12]. For the use in society, it is efficient and economical to transport and store hydrogen in a liquid state because liquid hydrogen is denser than gaseous hydrogen. In this context, high-efficient liquefaction technology is required. One of the authors has confirmed >50% liquefaction efficiency in a test apparatus of the Carnot magnetic refrigerator worked around the hydrogen liquefaction temperature (20.3 K)[13]. On the other hand, in the practical liquefaction process, it is necessary to pre-cool the hydrogen gas from the temperature of a heat sink, such as liquid nitrogen, to nearly 20.3 K by using a multistage AMR cycle [14, 15, 16]. What should be noted here is that the magnetocaloric material must be processed into a specific shape suitable for each refrigeration system. For example, spherical particles or thin plates have been employed for AMR systems to gain better heat exchange efficiency between the working material and the heat-exchanger fluid [17, 18].
Candidate materials for hydrogen magnetic refrigeration are often found in intermetallic compounds containing heavy rare-earth elements. A representative example is the lanthanide (R) Laves phase RT2 (T Al, Co, and Ni) [19, 20, 21], which exhibits a large magnetic entropy change in the temperature range from 20 to 80 K. However, these compounds are difficult to be shaped due to their poor ductility and malleability. Moreover, these materials are quite brittle, leading to a risk of damage by the friction between them during the refrigeration cycle operation. Such mechanical properties prevent these candidate materials from being used as magnetic refrigerants. Besides, they are known to easily absorb hydrogen, resulting in the degradation of the refrigerants and their performance. A coating for protection is a typical way to solve this issue, but this takes extra effort in addition to the shaping process for producing magnetic refrigerants.
Very recently, Funk et al. reported[22] a way for producing magnetocaloric wire by a PIT method in La (Fe, Co, Si)13, which is a promising material for the room temperature magnetic refrigeration [23, 24]. The PIT method is a conventional and simple technology that has been developed in the field of superconducting wires[25, 26], in which a powdered raw material is filled into a metal tube and then formed into wire-shaped by various metal workings. This approach is attractive because of many advantages in applying the PIT method to the candidate materials for hydrogen magnetic refrigeration as follows: (1) This method is available even for the difficult-to-process materials since raw materials can be powder. (2) The metal sheath surrounding the magnetic refrigerants protects them from the friction wear or the hydrogen embrittlement. (3) As Funk et al. have pointed out, the wires provide the possibility of various arrangements of magnetic refrigerants. Besides, it should be noted that recent works have focused on wire-shaped magnetocaloric materials because they have been suggested to show superior performance as magnetic refrigerants to conventional spherical or plate-like materials[27, 28, 29].
In this paper, we investigate the effects of a PIT process on the magnetocaloric properties in a well-studied compound ErAl2 that exhibits a second-order ferromagnetic transition at 14 K [19, 30, 31]. We have confirmed that the magnetic entropy change is similar in the ErAl2 PIT wires and the bulk counterpart, while it decreases in magnitude for the former due to a reduction of volume fraction of ErAl2 in the wires. We have further found that another effect causes an additional decrease of near , which depends on the sheath material. This is the first report to apply the PIT method for fabricating magnetocaloric wire for the hydrogen liquefaction.
2 Experimental details
ErAl2 single-core wires were fabricated by an ex-situ PIT method without any heat treatment. ErAl2 raw powder with a diameter of less than 50 m was prepared by a gas-atomization process. The powder was filled into several metal tubes with 50 mm in length, an outer diameter () of 6 mm, and inner diameter () of 4 or 5 mm (hereafter, referred to 64 tube and 65 tube respectively). The tubes were plugged on both sides by cylinders 7 mm in length made of the same material as each tube. Thus-made initial rods were first groove-rolled into wires with a size of 2 mm stepwisely. Then the wires were cut into about 70 mm and further groove-rolled into those with a size of 1 mm stepwisely. The resulting PIT wires were 260-300 mm in length. Cu, Al, and Brass were employed as the sheath materials because they are non-magnetic and show relatively high thermal conductivity.
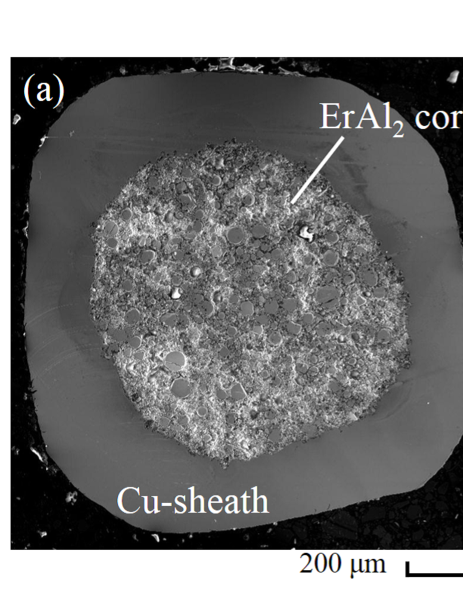
The cross-sectional observations for the fabricated PIT wires were carried out using a JEOL JSM-6010LA scanning electron microscope (SEM) operated at 15 kV. The cross-sectional area was evaluated using an image analysis software Image-J (National Institute of Health, US). Figures 1(a) and 1(b) show SEM images of ErAl2/Cu PIT wires fabricated from the 64 and 65 tubes, respectively. These images indicate that the ErAl2 powder is uniformly filled inside the Cu-sheath as a core material. The cross-section ratios of the ErAl2 core to the whole wire were evaluated to be 0.437 from Fig. 1(a) and 0.655 from Fig. 1(b), which are comparable to the theoretical filling rate, defined as , expected for each initial tube (0.444 for the 64 tube and 0.694 for the 65 tube). This result implies that the core and the sheath material were deformed at the same proportion during the rolling process. We have found the same features in ErAl2/Al and ErAl2/Brass PIT wires.
Magnetization measurements were performed by a Quantum Design magnetic property measurement system. Temperature () dependence of magnetization () of the ErAl2 powder and the PIT wires was measured between 2 and 60 K at a temperature sweep rate of 0.5 K/min under various magnetic fields () ranging from 0.1 to 5 T in zero-field cooling (ZFC) process. The magnetic fields were applied along the longitudinal direction of each PIT wire with 5-7 mm in length. For the powder sample, field dependence of magnetization was collected between 0 and 5 T in the temperature range of 2 40 K.
The magnetic entropy change is often evaluated from the isothermal magnetization (-) measurements by using one of Maxwell’s relations
| (1) |
where and is the initial and final magnetic field, and . However, this way requires us to collect lots of magnetization curves at various temperatures for correct evaluation, which is somewhat time-consuming and makes it difficult to obtain in detail the temperature dependence of . So we first examined how to efficiently and accurately evaluate from the isofield magnetization (-) measurements in the ErAl2 powder. Then the validity of this unconventional method was verified by comparing the results obtained from this and the often-used method. In the following, is set to zero.
3 Results and discussion
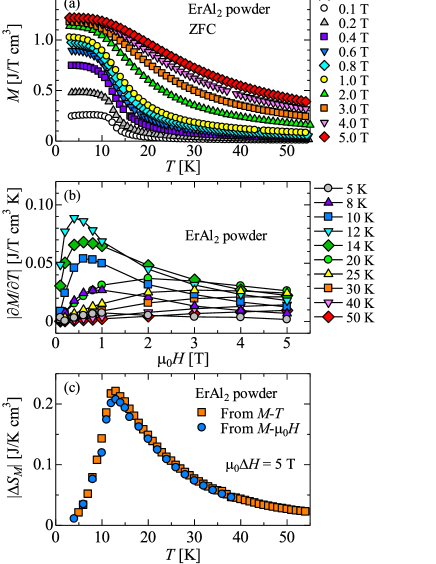
Figure 2(a) shows the - curves of the ErAl2 powder. One finds the features typical of a second-order ferromagnetic transition with of 12 K, defined as the temperature at which at 0.1 T takes a maximum. The slight discrepancy with the in the literatures may be because that the ErAl2 powderwas made by the gas-atomization process in which where the material is quenched. Similar - curves have been observed in all the ErAl2 PIT wires (not shown). To calculate correctly from - measurements, one should select the measuring magnetic fields properly. As shown in Fig. 2(b), calculated from Fig. 2(a) exhibit a non-monotonic field dependence, especially around : it steeply increases and reaches the highest point below 1 T, followed by a gradual decrease under higher fields. Since at a fixed is equivalent to the area in the - plane, this peak structure can largely affect the evaluated value of . Accordingly, it is essential to finely collect the - curves under magnetic fields in which the peak of appears[32]. Figure 2(c) shows (, 5 T) of the ErAl2 powder evaluated using Eq. (1) based on - data calculated from the - curves and the - curves (see the supplementary data), respectively. Two curves almost agree with each other and peaks at . This result indicates that the magnetic entropy change can be correctly evaluated through the isofield magnetization measurements. of the PIT wires were evaluated by the same procedure.
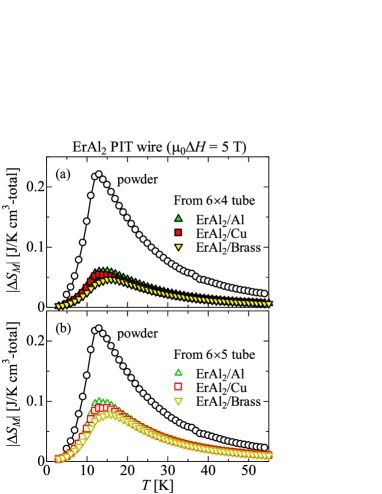
Figures 3 (a) and 3 (b) represent the temperature dependence of for 5 T per total volume of 1 cm3 in various ErAl2 PIT wires fabricated from the 64 and 65 tubes. The data for the ErAl2 powder is also shown for the comparison. The magnetic entropy change of the PIT wires exhibits qualitatively similar characteristics as those of the powder sample, while the magnitude is decreased by about 60-70%. This result is not surprising because the volume fraction of ErAl2 is reduced in the PIT wires. In that sense, the data for the powder sample can be regarded as of a hypothetical wire with 100% ErAl2 core material. Indeed, becomes larger in the case of the PIT wire fabricated from the 65 tube, namely, the larger filling rate of the core material. Furthermore, when the filling rate is the same, at the temperatures above 30 K, does not depend on the sheath material. These facts suggest that the volume fraction of the ErAl2 core material mainly determines the magnetic entropy change of the PIT wires. On the other hand, we should notice the difference in between the PIT wires at around , where the of the ErAl2/Brass wire is significantly decreased. A possible origin of which is discussed below.
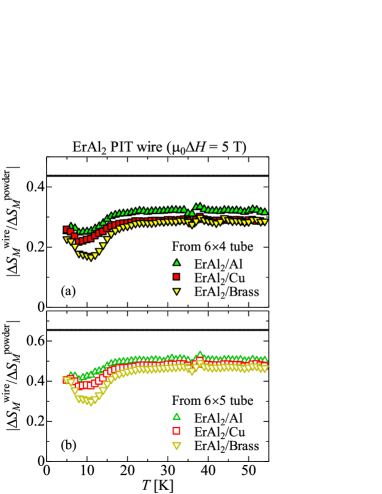
Here let us evaluate the ratios of the magnetic entropy change in each PIT wire () to that in the ErAl2 powder (), which should correspond to the volume fraction of the core material. Figures 4(a) and 4(b) show the temperature dependence of calculated for the PIT wires made from the 64 and 65 tubes. One finds that the ratios take constant values at temperatures above 30 K. This makes sense because the volume fraction should not change at any temperature. On that account, we employ the mean value of the temperature-independent as the actual volume fraction of ErAl2 in the PIT wires, being 0.30 for the wires made from the 64 tube and 0.49 for those made from the 65 tube. These values are about 70-75% of the theoretical volume fraction expected from the SEM images assuming no voids. Funk et al. have reported that the volume fraction of La(Fe, Si, Co)13 core is about 85% of the theoretical one, even though pre-compacted raw materials were filled into a metal tube[22]. In contrast, ErAl2 powder was filled without any treatments in this study, implying that there can be more voids in our PIT wires compared with the La(Fe, Si, Co)13 PIT wire. Accordingly, the obtained values of the ErAl2 core volume fraction seem to be reasonable. With further decreasing temperature, gradually decreases and exhibits a dip structure near , whose characteristic is noticeable with ErAl2/Brass wires. This behavior suggests that there is another contribution that affects the magnetic entropy change of ErAl2 itself in the PIT wires, in addition to the decrease in the volume fraction of the core material.
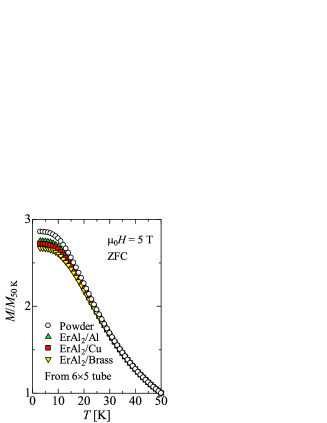
Now we will discuss a possible origin of the extra reduction of around observed in the PIT wires. According to Eq. (1), a decrease in results from a decrease in ()H, which occurs when decreases without changing the temperature dependence and/or when the temperature dependence itself becomes more gradual. To clarify this point, we plot at 5 T as a function of temperature in Fig. 5 for the ErAl2 powder and the PIT wires made from the 65 tube. The magnetizations show the same temperature dependence down to 30 K for all the samples, but the rise in of the PIT wires is suppressed with decreasing temperature, the trend is most significant in the ErAl2/Brass wire. This mild temperature variation does be the cause of the decrease in ()H for the PIT wires. The difference in - curves observed here resembles those found in ferromagnetic materials with a uniaxial magnetic anisotropy [33, 34, 35], in which ()H becomes smaller in the direction perpendicular to an easy axis of the magnetization. Thus, the extra reduction of around implies that the PIT process induces a magnetic anisotropy in the ErAl2 core material with an easy axis perpendicular to the longitudinal direction of the wire.
It is well known that a rolling process causes a kind of magnetic anisotropy in magnetic materials [36, 37, 38, 39]. This magnetic anisotropy is known to increase as the mechanical deformation increases, and the latter usually increases with the stress on magnetic material during rolling. On the other hand, in several studies on superconducting PIT wires [40, 41], it has been pointed out that the higher the hardness of sheath material, the stronger the stress on core material during cold working. From these facts, the magnetic anisotropy induced by rolling is expected to be large in the use of the harder tube in a PIT process. In fact, since Vickers hardness is higher in the order of Al, Cu, and Brass, the expectation is consistent with the result that around is most decreased in the ErAl2/Brass PIT wires. Therefore, we conclude that the PIT process affects the magnetocaloric properties of the ErAl2 core material through the induced uniaxial magnetic anisotropy. However, the exact nature of the magnetic anisotropy remains unclear at the present stage. To get more insight, it is desirable to investigate the effect of annealing that may control the plastic deformation.
4 Conclusion
We have fabricated the magnetocaloric wires of ErAl2 cladded by non-magnetic metal sheaths by using a powder-in-tube method combined with groove rolling. These PIT wires exhibit magnetic entropy changes similar to that of the powder sample, with their magnitude reduced due to the decrease in the volume fraction of the ErAl2 core. We propose that the PIT process affects the magnetocaloric properties of the core material through a kind of the induced uniaxial magnetic anisotropy and causes the extra reduction of the magnetic entropy change around . There is still room for improvement of the magnetocaloric properties in the PIT wires by annealing process and additional processes that increase the volume fraction of the core. We believe that the wire-shaped magnetocaloric materials prepared by a PIT method would be of benefit to the development of magnetic refrigerators for the hydrogen liquefaction.
References
References
- [1] Debye P 1926 Ann. Phys. 81 1154.
- [2] Giauque W F 1927 J. Am. Chem. 49 1864.
- [3] Zimm C, Jastrab A, Sternberg A, Pecharsky V, Gschnedner Jr K, Osborne M, and Anderson I 1998 Adv. Cryog. Eng. 43 1759.
- [4] Brck E 2005 J. Phys. D: Appl. Phys. 38 R381.
- [5] Gschneidner Jr K A, Pecharsky V K, and Tsokol A O 2005 Rep. Prog. Phys. 68 1479.
- [6] Tishin A M 2007 J. Magn. Magn. Mater. 316 351.
- [7] Franco V, Blázquez J S, Ipus J J, Law J Y, Moreno-Ramírez L M, Conde A 2018 Prog. Mater. Sci. 93 112.
- [8] Pecharsky V K and Gschneidner Jr K A 1997 Phys. Rev. Lett. 78 4494.
- [9] Barclay J A and Steyert W A 1982 U. S. Patent 4 332 135.
- [10] Gschneidner Jr K A and Pecharsky V K 2008 Int. J. Ref. 31 945.
- [11] Nielsen K K, Tusek J, Engelbrecht K, Schopfer S, Kitanovski A, Bahl C R H, Smith A, Pryds N, Peredos A 2011 Int. J. Ref. 34 603.
- [12] Jones L W 1971 Science 174 367.
- [13] Kamiya K, Takahashi H, Numazawa T, Nozawa H, and Yanagitani T 2007 Cryocooler 14 637.
- [14] Utaki T, Kamiya K, Nakagawa T, Yamamoto T A, and Numazawa T 2007 Cryocooler 14 645.
- [15] Matsumoto K, Kondo T, Yoshioka S, Kamiya K, and Numazawa T 2009 J. Phys.: Conf. Ser. 150 012028.
- [16] Numazawa T, Kamiya K, Utaki T, Matsumoto K 2014 Cryogenics 62 185.
- [17] Yu B, Liu M, Egolf P W, and Kitanovski A 2010 Int. J. Ref. 33 1029.
- [18] Tuek J, Kitanovski A, and Poredo A 2013 Int. J. Ref. 36 1456.
- [19] Hashimoto T, Matsumoto K, Kurihara T, Numazawa T, Tomokiyo A, Yayama H, Goto T, Todo S, and Sahashi M 1986 Adv. Cryog. Eng. Mater. 32 279.
- [20] Tomokiyo A, Yayama H, Wakabayashi H, Kuzuhara T, Hashimoto T, Sahashi M, and Inomata K 1986 Adv. Cryog. Eng. Mater. 32 295.
- [21] Zhu T, Asamoto K, Nishimura Y, Kouen T, Abe S, Matsumoto K, and Numazawa T 2011 Cryogenics 51 494.
- [22] Funk A, Freundenberger J, Waske A, and Krautz M 2018 Mater. Today Ener. 9 223.
- [23] Hu F X, Shen B G, Sun J R, Cheng Z H, Rao G H, and Zhang X X 2001 Appl. Phys. Lett. 78 3675.
- [24] Fujieda S, Fujita A, and Fukamichi K 2002 Appl. Phys. Lett. 81 1276.
- [25] Kunzler J E, Buehler E, Hsu F S L, and Wernick J H 1961 Phys. Rev. Lett. 6 89.
- [26] Kunzler J E 1961 Rev. Mod. Phys. 33 501.
- [27] Shen H X, Xing D W, Sánchez Liamazares J L, Sánchez-Valdés C F, Belliveau H, Wang H, Qin F X, Liu Y F, Sun J F, Srikanth H, and Phan M H 2016 Appl. Phys. Lett. 108 092403.
- [28] Kondo M, Ueno K, Takeuchi K, Nomura R, and Kizaki T 2017 Fujikura Tech. Rev. 47 47.
- [29] Vuarnoz D and Kawanami T 2012 Appl. Therm. Eng. 37 388.
- [30] Nereson N, Olisen C, and Arnold G, 1968 J. Appl. Phys. 39 4605.
- [31] Pecharsky V K and Gschneidner Jr K A 1999 J. Appl. Phys. 86 565.
- [32] This magnetic field range corresponds to that in which the magnetization at a sufficiently low temperature increases rapidly and almost saturates in the - plane. (see the supplementary data)
- [33] Zhang X X, Wei H L, Zhang Z Q, and Zhang L 2001 Phys. Rev. Lett. 87 157203.
- [34] Luis F, Bartolomé F, Petroff F, Bartolomé J, García L M, Deranlot C, Jaffrés H, Martínez M J, Bencok P, Wilhelm F, Rogalev A, and Brookes N B 2006 Europhys. Lett. 76 142.
- [35] Liu Y and Petrovic C 2019 Phys. Rev. Mat. 3 014001.
- [36] Chikazumi S 1958 J. Appl. Phys. 29 346.
- [37] Chikazumi S, Suzuki K, and Iwata H 1960 J. Phys. Soc. Jpn. 15 250.
- [38] Chin G Y, Nesbitt E A, Wernick J H, and Vanskike L L 1967 J. Appl. Phys. 38 2623.
- [39] Morita H, Fujimori H, and Obi Y 1979 Jpn. J. Appl. Phys. 18 683.
- [40] Grasso G, Malagoli A, Ferdeghini C, Roncallo S, Braccini V, and Cimberle M R, 2001 Appl. Phys. Lett. 79 230.
- [41] Kumakura H, Matsumoto A, Fujii H, Kitaguchi H, Togano K, 2002 Physica C 382 93.